
The precision manufacturing of spur and pinion gears is a cornerstone of modern mechanical transmission systems. The accuracy of their geometric parameters directly dictates the performance, efficiency, and longevity of the final assembly. Traditional tactile measurement methods, reliant on coordinate measuring machines (CMMs) or specialized gear testers, are often time-consuming, involve complex calculations, and risk damaging delicate gear surfaces. The advent of computer vision technology offers a paradigm shift, enabling non-contact, high-speed, and highly automated inspection. This article details the comprehensive design and research of a novel numerical measurement instrument based on computer vision, specifically engineered for the precise evaluation of spur and pinion gears. The system integrates advanced image processing algorithms with a robust hardware architecture to achieve real-time, online measurement, seamlessly coupling quality control with the manufacturing process.
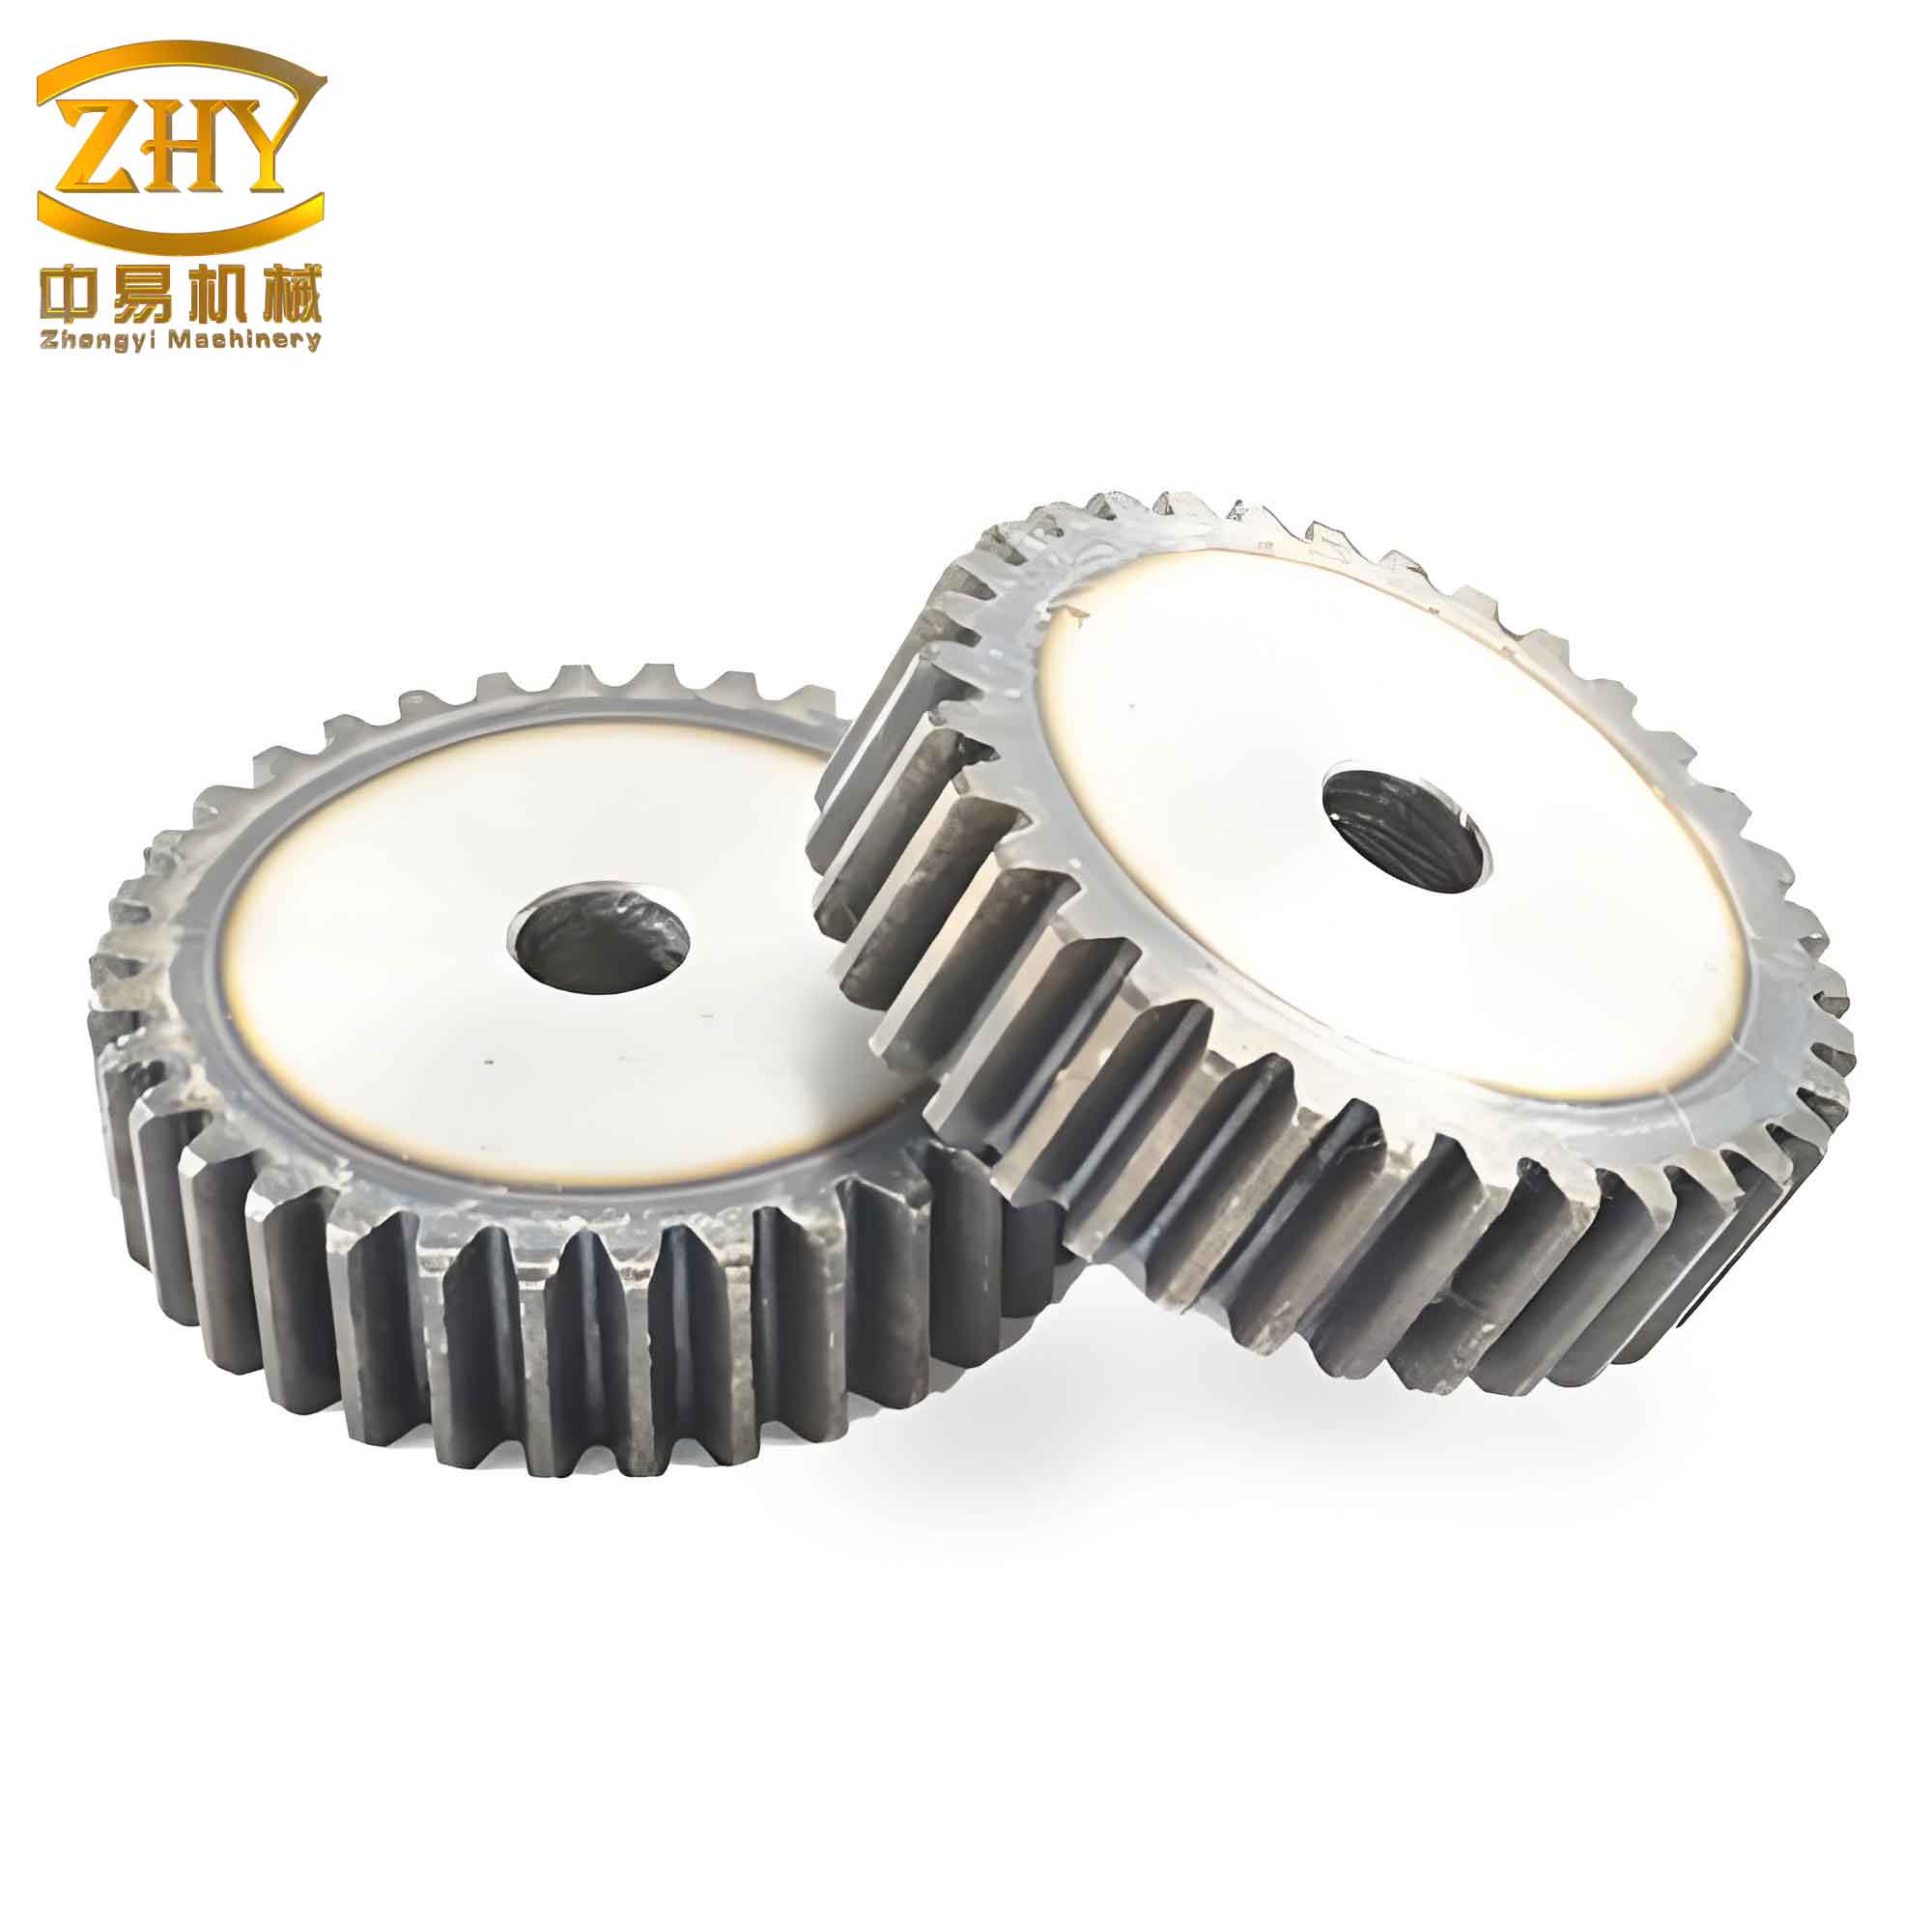
Fundamental Measurement Principle
The operational principle of the instrument is to translate the physical dimensions of a spur and pinion gear into a digital image coordinate system, which is then mapped to the real-world instrument coordinate system through calibration. The gear is placed on a backlit, uniform LED illumination stage. A CCD camera, mounted on a motorized XY stage, captures a high-contrast 2D image of the gear silhouette. This optical signal is converted into a digital signal via a frame grabber and transmitted to an industrial PC (IPC). Sophisticated image processing software then extracts the gear’s contour, identifies key features, and calculates its fundamental parameters. The system employs dual data channels: one for live video feed via an AV port for rough positioning and focus, and another for high-resolution static image capture via USB for precise analysis. The spatial position of the camera, measured by linear encoders (glass scales) on the X and Y axes, is combined with the image analysis results to yield the final, absolute measurements, which are displayed and stored in a dedicated database for traceability and statistical process control (SPC).
Instrument Architecture and Functional Modules
The instrument is a synergistic integration of mechanical, optical, electronic, and software subsystems, each playing a critical role in achieving high-precision measurement.
| System Module | Key Components | Primary Function |
|---|---|---|
| Mechanical System | Precision linear guideways (X, Y), ball screws, stepper motors, manual fine-adjustment handwheels, granite base. | Provides stable support, enables precise and repeatable positioning of the vision system relative to the gear under test. |
| Vision & Illumination System | CCD camera with macro lens, red LED backlight (λ=680nm), collimating lenses, bandpass filter. | Generates a high-contrast, shadow-free, and noise-reduced image of the spur and pinion gear profile. Köhler illumination ensures even field brightness. |
| Data Acquisition & Control System | Industrial PC (IPC), motion control card, image acquisition card, linear encoder interface circuits. | Coordinates stage movement, captures image data, reads position feedback from encoders, and serves as the central processing unit. |
| Software System | Custom application developed in C++, incorporating image processing and computer vision libraries. | The core intelligence; performs image analysis, implements measurement algorithms, manages the user interface, and handles database operations. |
Core Software Algorithms and Image Processing Pipeline
The software transforms the raw gear image into precise dimensional data through a multi-stage algorithmic pipeline.
1. Image Pre-processing: Noise Reduction
Image noise from the sensor and electronics is mitigated using an improved adaptive median filter. Standard median filters can blur sharp edges critical for gear measurement. Our algorithm selects from three adjacent filtering windows $A_i (i=1,2,3)$, calculating the grayscale variance $B_i$ for each:
$$ B_i = \frac{1}{N} \sum_{p \in A_i} (g_p – \bar{g}_{A_i})^2 $$
where $g_p$ is the pixel grayscale value, $\bar{g}_{A_i}$ is the mean grayscale in window $A_i$, and $N$ is the number of pixels in the window. The window with the minimum variance $B_{min}$ is chosen, and its median value replaces the central pixel. This preserves edges while effectively suppressing noise.
2. Image Segmentation: Binarization
The grayscale image is converted to a binary image to separate the spur and pinion gear silhouette (foreground) from the background. After smoothing the histogram with a Gaussian function ($\sigma=15$), a global threshold $M$ is determined, typically using Otsu’s method. The binarization is defined as:
$$ F(x,y) = \begin{cases} 0, & \text{if } f(x,y) \leq M \text{ (Background)} \\ 255, & \text{if } f(x,y) > M \text{ (Gear)} \end{cases} $$
3. Sub-Pixel Edge Detection
Pixel-level edge detection is insufficient for precision measurement. We employ a fast sub-pixel algorithm. First, the edge normal angle $\alpha$ is estimated using spatial moments $M_{pq}$ to reduce the problem to one dimension:
$$ M_{pq} = \sum_{x} \sum_{y} x^p y^q h(x,y), \quad \alpha = \arctan\left(\frac{M_{01}}{M_{10}}\right) $$
Pixels are projected onto the edge normal line: $T = x \cos \alpha + y \sin \alpha$. Along this 1D profile, a 5th-order orthogonal polynomial $F_5(T)$ is fitted to the grayscale values using least squares. The sub-pixel edge location $T_{sub}$ is found at the point of maximum gradient, i.e., by solving for the root of the second derivative:
$$ \frac{d^2 F_5(T)}{d T^2} \bigg|_{T=T_{sub}} = 0 $$
This yields a closed-form solution for $T_{sub}$, providing edge coordinates with sub-pixel accuracy, which is crucial for measuring the fine tolerances of a spur and pinion gear.
4. Center Determination via Improved Randomized Hough Transform (RHT)
Accurately finding the gear center $(x_c, y_c)$ is paramount. The standard Hough Transform for circles is computationally expensive. We implement an efficient Randomized Hough Transform:
- Construct a set $E$ of all sub-pixel edge points.
- Randomly select three non-collinear points from $E$ to define a candidate circle with parameters $(x_c, y_c, r)$.
- Define an accumulator space for circle parameters. Increment the accumulator for the calculated $(x_c, y_c, r)$.
- If the accumulator count for a candidate exceeds a threshold $M_{min}$ (e.g., 80% of the expected perimeter points), it is validated as the true gear center and radius.
This method dramatically reduces processing time while maintaining robustness, as shown in the comparison below for a typical spur and pinion gear image.
| Algorithm | Processing Time (s) | Detected Center (pixels) |
|---|---|---|
| Standard Hough Transform | 21.52 | (433, 432) |
| Improved Randomized HHT | 4.28 | (430, 431) |
Spur and Pinion Gear Parameter Measurement Algorithms
With the gear center $O(x_c, y_c)$ precisely located, the following key parameters of the spur and pinion gear are calculated.
1. Tip Radius ($r_a$) and Root Radius ($r_f$)
The distance $r(\theta)$ from the center $O$ to each contour point is computed. For a perfect spur and pinion gear, $r(\theta)$ is periodic with constant maxima (tip points) and minima (root points). Manufacturing errors cause variation. By analyzing the derivative $dr/d\theta$, local maxima and minima are identified as tip and root points respectively. The tip and root radii are then the arithmetic means of these distances:
$$ r_a = \frac{1}{N_t} \sum_{i=1}^{N_t} ||P_{t,i} – O||, \quad r_f = \frac{1}{N_r} \sum_{j=1}^{N_r} ||P_{r,j} – O|| $$
where $P_{t,i}$ and $P_{r,j}$ are the coordinates of the $i$-th tip and $j$-th root point, and $N_t$, $N_r$ are their counts.
2. Number of Teeth ($Z$)
The tooth count is derived from the average angular pitch. After excluding regions with potential defects (e.g., keyways) via feature matching, the angles between consecutive tip points are measured. The average angular pitch $\bar{\phi}$ is calculated, yielding the tooth count:
$$ Z = \text{round}\left( \frac{360^\circ}{\bar{\phi}} \right) $$
3. Module ($m$)
The module, a fundamental parameter for any spur and pinion gear, is estimated from the tip and root diameters. The theoretical relationship for a standard gear is $d_a = m(Z + 2)$ and $d_f = m(Z – 2.5)$. Therefore, an estimated module $m_{est}$ is:
$$ m_{est} = \frac{r_a + r_f}{2} $$
This value is then compared to the nearest standard modules from ISO 54 (e.g., 1, 1.25, 1.5, 2, 2.5, 3…), and the closest standard value is assigned as the gear module $m$.
4. Base Tangent Length (Public Normal Line Length, $W_k$)
The base tangent length, measured over $k$ teeth, is a critical indicator of tooth spacing accuracy. First, the number of teeth spanned $k$ is determined based on the pressure angle $\alpha$ (typically $20^\circ$ for standard spur and pinion gears):
$$ k = \left\lfloor \frac{Z}{9} \right\rfloor + 1 \quad \text{(for } \alpha = 20^\circ\text{)} $$
where $\lfloor \cdot \rfloor$ is the floor function. The theoretical base tangent length $W_k$ is then calculated using the involution function $\text{inv}\,\alpha = \tan\alpha – \alpha$ (with $\alpha$ in radians):
$$ W_k = m \cos\alpha \left[ \pi (k – 0.5) + Z \cdot \text{inv}\,\alpha \right] $$
While our system primarily uses vision to measure $r_a$ and $r_f$, the software calculates and reports $W_k$ using the identified $Z$ and $m$ for comprehensive gear verification.
Experimental Results and Error Analysis
The instrument was tested on a standard spur and pinion gear (pressure angle $\alpha=20^\circ$, with a keyway). Measurements were compared against those from a high-precision coordinate measuring machine (CMM). The results demonstrate the system’s high accuracy and repeatability.
| Parameter | CMM Measurement (Reference) | Vision System Measurement | Absolute Difference |
|---|---|---|---|
| Tip Radius, $r_a$ (mm) | 29.981 | 29.975 | 0.006 |
| Root Radius, $r_f$ (mm) | 23.143 | 23.201 | 0.058 |
| Number of Teeth, $Z$ | 18 | 18 | 0 |
| Module, $m$ (mm) | 2.947 | 2.954 | 0.007 |
| Base Tangent Length, $W_k$ (mm) | 21.987 | 22.468 (Calculated) | 0.481* |
*The larger difference in $W_k$ arises because it is a calculated value from $Z$ and $m$, not directly measured by the vision system in this configuration. Discrepancies in $r_a$ and $r_f$ propagate through the formula.
The main sources of measurement error in the vision-based system for spur and pinion gears are systematically categorized below:
| Error Category | Specific Sources | Impact on Measurement |
|---|---|---|
| Hardware System Errors | CCD sensor resolution (pixel quantization), lens distortion, non-uniform illumination, electronic noise (shot noise, dark current), linear encoder resolution. | Limits the fundamental resolution, causes geometric distortion, introduces pixel-level uncertainty in edge location. |
| Image Processing & Algorithmic Errors | Threshold selection in binarization, approximation in sub-pixel edge fitting, finite sampling in RHT for center finding, errors in derivative calculation for tip/root detection. | Can lead to systematic bias or random noise in the extracted contour, affecting all derived parameters of the spur and pinion gear. |
| Calibration & Environmental Errors | Inaccurate pixel-to-millimeter calibration factor, thermal expansion of mechanical components, vibrations. | Introduces scaling errors and reduces measurement repeatability over time and across different conditions. |
Conclusion
This research presents the successful design and implementation of a fully automated numerical measurement instrument for spur and pinion gears, leveraging the power of computer vision. The system integrates a robust mechanical stage, a optimized optical path, and a sophisticated software suite featuring advanced algorithms like adaptive median filtering, sub-pixel edge detection, and randomized Hough transform. It achieves rapid, precise, and non-contact measurement of critical gear parameters such as tip/root diameter, tooth count, and module. The instrument’s architecture supports seamless integration into production lines for real-time, in-process quality control of spur and pinion gears, significantly enhancing manufacturing intelligence and automation. Future work will focus on extending the algorithm suite to directly measure profile deviations, pitch errors, and other quality indices from the captured gear image, further solidifying its role as a comprehensive tool for gear metrology.