
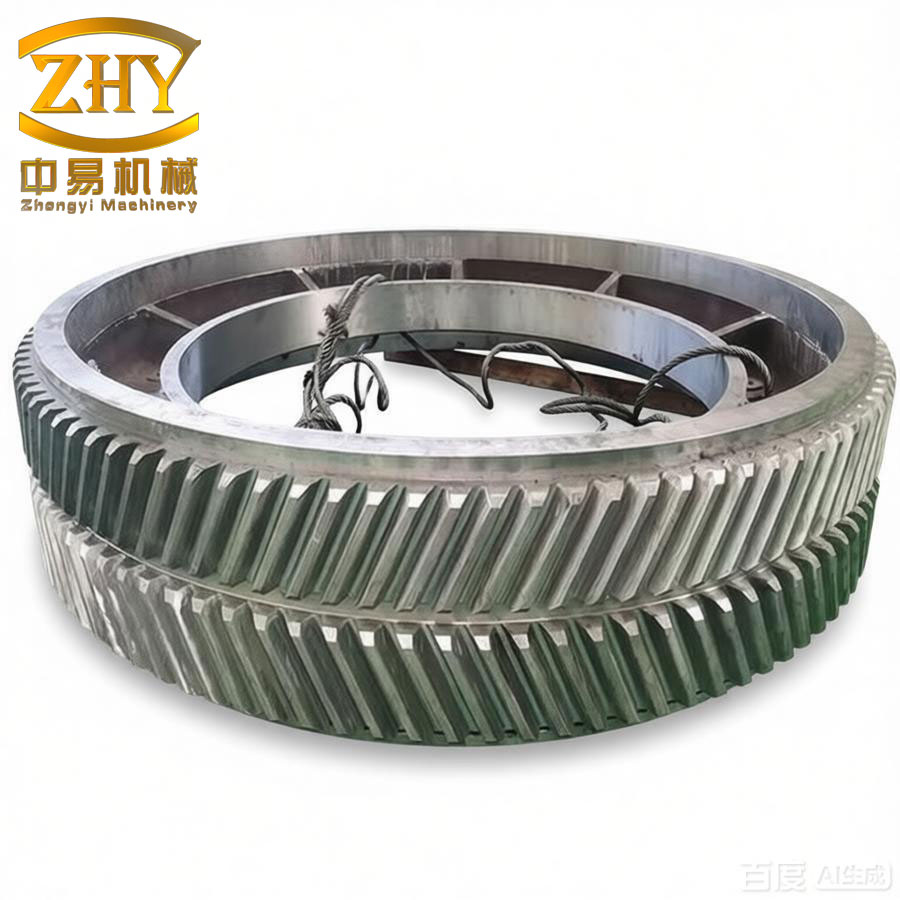
Herringbone gears, distinguished by their compact structure, high torque transmission capability, stable transmission ratio, and the absence of additional axial forces, are extensively utilized in aerospace, marine propulsion, and heavy industrial applications. However, the rapid advancement of modern industry imposes increasingly stringent requirements on the transmission performance of herringbone gears. To improve the meshing condition, reduce vibration and noise during transmission, and thereby enhance gear performance, significant benefits can be realized in national defense and high-end manufacturing sectors. Gear statics serves as the foundation for studying gear transmission. By employing appropriate modification measures to improve static characteristics and enhance the applicability of gear modification, it has become an essential task in gear design.
In this thesis, based on gear modification theory and utilizing the ROMAX software, I primarily analyze the static characteristics and modification sensitivity of herringbone gears to improve their static performance and applicability. The main research conducted in this thesis is as follows:
(1) Based on the theoretical foundation of gear modification, I determined the modification method as topological modification, selected the Monte Carlo method and genetic algorithm as the modification algorithms, and adopted a quadratic parabola as the modification curve.
(2) Since the herringbone gear under investigation is a composite gear with narrow tooth space width, high support stiffness, high installation accuracy, and symmetry, the load distribution on the left and right tooth surfaces of the herringbone gear is symmetrical. When modeling and loading the herringbone gear, I constructed a corresponding helical gear model and applied half the torque. After obtaining stress bar charts, safety factor bar charts, transmission error curves, normal load distribution per unit length, and contact stress distribution diagrams under various operating conditions before and after modification, I found that the genetic algorithm effectively improves the gear meshing characteristics.
(3) I conducted sensitivity analyses on three sets of optimal tooth profile modification data, three sets of optimal tooth direction modification data, and one set of optimal topological modification data. These analyses include: the sensitivity of modification parameters to transmission error and maximum contact stress, and the sensitivity of center distance installation error to transmission error. The results indicate that tooth profile modification parameters are sensitive to transmission error but insensitive to maximum contact stress; center distance installation error is insensitive to the transmission error of gears with profile modification. Tooth direction modification parameters are insensitive to both transmission error and maximum contact stress; center distance installation error is sensitive to the transmission error of gears with lead modification. Topological modification is sensitive to transmission error but insensitive to contact stress; center distance installation error is insensitive to the transmission error of gears with topological modification.
(4) I measured the transmission error amplitude of standard tooth surfaces using a purpose-built transmission error test bench and compared it with the transmission error amplitude calculated by the ROMAX software. The theoretically calculated transmission error amplitude is consistent with the experimentally measured variation pattern.
1. Introduction
1.1 Research Background and Significance
The application of gears in China has a long history, spanning at least two thousand years, from agricultural and wartime uses to transportation. During the Western Zhou Dynasty, gear transmission systems were already applied in the south-pointing chariot, where the accuracy of the gear drive directly affected the overall quality of the vehicle. In the Han Dynasty, the odometer cart was designed and manufactured with gear systems as their core components, enabling accurate measurement of travel distances. These historical examples demonstrate the deep consideration and continuous exploration of gear applications by ancient Chinese people. In modern society, gear transmission systems are widely used in vehicle systems, electric power systems, mining equipment, aerospace, and other fields due to their high transmission efficiency, compact structure, accurate transmission ratio, and long service life.
The main types of transmission gears include spur gears, helical gears, and herringbone gears. Spur gears are simpler and cheaper to manufacture than helical and herringbone gears, making them widely used. However, loaded gears experience significant impact forces during meshing in and out, affecting normal gear engagement. Helical gears have smaller meshing impact, vibration, and noise, but they generate substantial axial forces, increasing energy loss during transmission. Herringbone gears, as an excellent representative of gear transmission systems, can cancel axial forces during transmission, possessing not only the basic advantages of gear transmission but also smooth transmission and high torque capacity.
Herringbone gears are applied in the automotive industry. The well-known French automobile manufacturer Citroën’s logo features herringbone gears; the company’s founder established the first herringbone gear manufacturing company and used them in automotive gearboxes.
Herringbone gears are used in petroleum machinery. Due to their absence of axial force and low energy loss, they are applied in twin-screw pumps, improving operational reliability and work efficiency. Similarly, herringbone gears are used in the gear transmission devices of twin-screw conveying pumps, enhancing transmission synchronization and stability.
Herringbone gears are applied in national defense industries. Due to their high torque capacity and good reliability, despite relatively difficult manufacturing and high costs, many countries adopt herringbone gears in ship transmission systems, improving speed and reliability. Furthermore, with their high rotational speed, small axial force, and strong stability, planetary herringbone gear reduction mechanisms have been applied to gear-driven turbofan engines in aircraft, replacing traditional dual-rotor turbofan engines and achieving energy savings, emission reduction, and noise reduction.
However, the design and manufacturing of herringbone gears have always been challenging, directly restricting the development of national defense industries. Herringbone gears operate at very high speeds and bear large loads, causing significant vibration during transmission, which reduces transmission stability and leads to additional periodic varying stresses, resulting in gear failure (scoring, tooth breakage, plastic deformation, etc.). Moreover, the excessive noise caused by transmission error amplitude variations greatly affects transmission stability and reliability.
Gear modification is an important method to improve gear transmission performance. Therefore, reasonable modification of herringbone gears can reduce system vibration and noise, effectively control contact stress distribution, reduce transmission error variations, and consequently reduce fatigue damage, improving the gear meshing condition. My research group has collaborated with Northwestern Polytechnical University to conduct modification design optimization studies on herringbone gears, aiming to improve tooth surface transmission performance and modification sensitivity analysis, thereby enhancing the reliability and practicality of gear modification.
1.2 Literature Review
1.2.1 Research Status of Modification Theory
International Research: In 2019, Miryam B. Sánchez et al. determined spur gear modification conditions (including modification curve type, position, and amount) through meshing stiffness, load distribution, and transmission error, achieving higher accuracy than methods based on the latest meshing stiffness equations, but only applicable to simple spur gear models. In 2016, S.S. Ghosh et al. used contour mapping and semi-analytical methods for optimal profile modification of spur gears to reduce vibration caused by geometric errors during transmission. In 2014, J. Bruyère et al. obtained modification equations for spur and helical gears through numerical analysis, effectively controlling transmission error and stress, though requiring high-precision tooth surfaces with complex calculations. In 2013, Cheon-Jae Bahk et al. studied the effect of profile modification of spur planetary gears on vibration excitation, determining the parameter set minimizing vibration. In 2011, Marcello Faggioni et al. used a stochastic-complex optimization algorithm for spur gear modification, showing good theoretical reliability but limited root and tip stress reduction in practice.
Domestic Research: In 2019, Yu Yingying proposed a root profile modification design method for high-contact-ratio internal gears, analyzing stress distribution and improving contact ratio, though resulting in higher contact and bending stresses. In 2018, Xu Jing calculated the meshing stiffness of herringbone gears after profile modification and crowning modification using finite element methods, showing that stiffness increase decreases with increasing modification amount. In 2017, Yang Li et al. proposed a gear vibration reduction modification optimization algorithm based on Kriging models and genetic algorithms, obtaining optimal modification parameters for typical spur gear drives. In 2015, Jiang Jinke et al. established a 10-degree-of-freedom dynamic model of herringbone gear meshing considering bending-torsion-axis-swing, optimized with load transmission error amplitude and axial force as objectives, and experimentally verified that modified herringbone gears effectively reduce system vibration and noise. In 2010, Liu Xiaoyong et al. used 3D contact finite element analysis to calculate gear tooth deformation and conducted profile and lead modification designs accordingly. In 2009, Wang Cheng et al. used parabolic profile modification curves and the complex optimization method to obtain optimal herringbone gear modification parameters with minimum load transmission error as the objective.
1.2.2 Research Status of Gear Statics
Transmission Error: The concept of transmission error was first proposed by Professor Smith of Cambridge University, defined as the lag of actual output rotation angle relative to the ideal output rotation angle under perfectly accurate and rigid driving conditions. Transmission error is the primary excitation source of vibration and noise in gears and the entire transmission system. Traditional calculation methods include absolute value, probability, and Monte Carlo methods. Classical calculation methods include material mechanics, mathematical elasticity, and finite element methods. In 2016, Ph. Velex et al. established a 3D model of meshing gears and analyzed the relationship between dynamic excitation and transmission error based on the minimum dynamic mesh force criterion. In 2006, P. Velex et al. built an extended finite element theoretical model of a spur gear test rig, analyzing loaded and geometric transmission errors. In 2005, Jesper Brauer proposed a global-local finite element method in ANSYS, requiring only local mesh refinement at contact areas, improving computational speed. Domestically, in 2013, Lei Duncai used ABAQUS for spur gear transmission error analysis. In 1998, Professor Fang Zongde proposed the Loaded Tooth Contact Analysis (LTCA) method combining physical contact models with compliance matrix mathematical models, improving analysis accuracy.
Contact Stress: In 2013, Miryam B. Sánchez et al. proposed a new calculation method for contact stress of spur and helical gears with transverse contact ratios greater than 2. In 2011, José I. Pedrero et al. applied a non-uniform load distribution model for helical gears based on minimum elastic deformation and Hertz equations. In 2009, Szu-Han Wu et al. numerically solved contact problems considering tooth surface contact deformation and bending deflection, effective for non-Hertzian contact. Domestically, in 2019, Song Xiangnan introduced slack and artificial variables to convert contact equations into linear programming form for face gears. In 2017, Qiu Lixin used penalty function methods to optimize herringbone gears, reducing contact stress by less than 8%. In 2002, Li Wanxi used finite element software to analyze damage conditions of herringbone gears during transmission.
2. Theoretical Basis of Gear Modification
Gear modification theory is the foundation for studying gear modification, with modification principles as its core. By studying modification principles, algorithms, and curves, effective modification can be conducted to improve modification effectiveness. Gear modification is based on the fact that after the loaded deformation of involute tooth profiles, the original conjugate profiles become non-involute. Through modification, the deformed profiles can remain involute, thereby improving transmission accuracy.
2.1 Principles of Gear Modification
According to the modification direction, gear modification is classified into profile modification, lead modification, and topological modification. Profile modification includes root modification and tip relief; lead modification includes crowning and end relief; topological modification is simultaneous profile and lead modification.
2.1.1 Principle of Profile Modification
Profile modification refers to modification only along the involute profile direction (in the gear tooth transverse plane). The principle is as follows: in the profile direction, during double-tooth meshing zones, the load is smaller; in the single-tooth meshing zone, the load is larger. When gears are installed at standard center distance, interference occurs when the driven gear tooth tip meshes with the driving gear. This load change inevitably brings impact to the transmission system, which in turn exacerbates the interference. Profile modification removes material at the interference locations, reducing elastic deformation of meshing teeth and improving system stability. Therefore, tip relief and root modification are performed on the driving gear (for manufacturing convenience, all modifications are accumulated on the pinion).
2.1.2 Principle of Lead Modification
Lead modification refers to modification only along the face width direction (for helical gears, along the helix direction). In the lead direction, under ideal conditions without deformation, the tooth surface load distribution should be completely uniform. However, in practice, due to housing deformation, bearing deformation, shaft deflection, etc., the gear deviates from the theoretical meshing position, causing interference and non-uniform load distribution. To reduce interference and improve tooth surface contact, lead modification is applied.
2.1.3 Principle of Topological Modification
Topological modification refers to simultaneous modification along both the profile and face width directions. It combines the advantages of both profile and lead modification, reducing meshing impact and improving load distribution. Therefore, this thesis adopts topological modification for the herringbone gears.
2.2 Selection of Modification Algorithms
The Romax Designer 17.0 software provides several algorithms, including full factorial methods, the Monte Carlo method, and genetic algorithms. The full factorial method has a limited number of combinations and cannot adequately explore the parameter space. The Monte Carlo method generates random numbers based on parameter distributions to solve random variable problems. The genetic algorithm follows the principle of “survival of the fittest” in biological evolution, iteratively evolving individual genes through selection, crossover, and mutation to find the global optimum. The genetic algorithm offers strong flexibility, good adaptability, and rapid convergence. Therefore, I employ both the Monte Carlo method and the genetic algorithm for gear modification and compare their effectiveness.
2.3 Selection of Modification Curves
Modification curves define how the tooth profile or lead is modified along a specified curve, which can be linear, circular arc, quadratic parabola, or higher-order curves. Linear modification produces significant stress concentration, while parabolic modification effectively reduces stress concentration and provides good tolerance for installation errors. Therefore, I select the quadratic parabola modification curve for both profile and lead directions, as it is available in ROMAX and provides excellent performance.
3. Loaded Analysis of Modified Tooth Surfaces
Standard herringbone gears experience relatively high transmission error peak-to-peak values and concentrated load distributions during transmission, leading to tooth surface meshing failures. Therefore, modification measures must be adopted to improve the meshing condition. In this chapter, I use the Monte Carlo method and genetic algorithm to perform topological modification of the standard pinion, conduct parametric gear modeling using ROMAX software, and obtain stress bar charts, safety factor bar charts, transmission error diagrams, contact stress diagrams, and normal load distribution per unit length before and after modification.
3.1 Modeling of the Herringbone Gear Transmission System
Based on existing literature, the meshing stiffness of a herringbone gear can be considered as twice that of the corresponding helical gear. Therefore, for static loading analysis, I can simplify the herringbone gear by applying half the torque to the equivalent helical gear model. When the pinion is axially floated and the system has large support stiffness and high installation precision, the load distribution on the left and right tooth surfaces is symmetrical. Thus, I model the equivalent helical gear pair and apply half torque for static analysis.
The basic parameters of the standard herringbone gear pair are shown in Table 1.
| Parameter | Unit | Pinion | Gear |
|---|---|---|---|
| Number of teeth | – | 17 | 44 |
| Normal module | mm | 6 | 6 |
| Normal pressure angle | ° | 20 | 20 |
| Helix angle | ° | 24.43 | -24.43 |
| Hand of helix | – | Left/Right | Right/Left |
| Single-side effective face width | mm | 55 | 55 |
The gear transmission system parameters are listed in Table 2.
| Transmission system parameter | Property or value |
|---|---|
| Gear material | Structural steel |
| Elastic modulus | 210 GPa |
| Poisson’s ratio | 0.3 |
| Addendum coefficient | 1 |
| Clearance coefficient | 0.25 |
| Input shaft bearing | SKF30209 |
| Output shaft bearing | SKF30216 |
| Lubricating oil | ISO VG150 |
The gear transmission operating conditions are shown in Table 3, with the pinion speed of 160 r/min. Based on the literature, the installation error of the meshing gear pair is set to 0.008 mm.
| Condition | Input shaft torque (N·m) |
|---|---|
| Condition 1 | 70 |
| Condition 2 | 110 |
| Condition 3 | 150 |
| Condition 4 | 190 |
| Condition 5 | 230 |
3.2 Modification Using the Monte Carlo Method
3.2.1 Modification Parameter Settings for the Monte Carlo Method
The Monte Carlo method steps are: (1) determine the probability distributions of 8 modification parameters; (2) repeatedly sample the parameters within these distributions to generate different combinations; (3) calculate transmission error for each combination; (4) select the combination satisfying constraint conditions (e.g., transmission error peak-to-peak value). In this study, the population size is set to 500.
For the five operating conditions, I modify the right tooth surface of the pinion. The modification type is parabolic. Based on the literature, the profile and lead modification parameter boundaries are shown in Tables 4 and 5.
| Parameter | Root modification amount | Root modification length | Tip modification amount | Tip modification length |
|---|---|---|---|---|
| Upper bound | 0.01mn | 0.6mn | 0.015mn | 0.8mn |
| Lower bound | 0.005 | 0.1mn | 0.005 | 0.15mn |
| Parameter | Inlet end modification amount | Outlet end modification amount | Unmodified section length |
|---|---|---|---|
| Upper bound | 0.02 | 0.02 | 0.5B |
| Lower bound | 0.005 | 0.005 | 0 |
Note: mn is the gear module, B is the face width.
To calculate the parabola tip relief starting angle range, I use the involute function:
$$ \text{inv}\,\alpha_k = \tan\alpha_k – \alpha_k \tag{3.1} $$
The roll angle at point k is calculated as:
$$ \frac{180}{\pi}\times\tan\alpha_k \quad \text{or} \quad \frac{180}{\pi}\times(\alpha_k+\theta_k) \tag{3.2} $$
The relationship between the diameter dk at the starting point and the base circle diameter db is:
$$ \cos\alpha_k = \frac{d_b}{d_k} \tag{3.3} $$
From Table 4, the tip modification length range is 0.9 mm-4.8 mm. The calculated tip parabola starting roll angle range is 31.142°-39.352°. The root parabola starting roll angle range is 10.400°-22.449°. The final profile modification parameter settings are shown in Table 6.
| Modification | Modification range |
|---|---|
| Parabolic tip relief (μm) | 5-90 |
| Parabolic root modification (μm) | 5-60 |
| Starting point to tip (degrees) | 31.142-39.352 |
| Starting point to root (degrees) | 10.400-22.449 |
The lead modification parameter settings are shown in Table 7.
| Modification | Modification range |
|---|---|
| Bottom parabola chamfer (μm) | 5-20 |
| Top parabola chamfer (μm) | 5-20 |
| Bottom parabola chamfer start (mm) | 15.28-24.44 |
| Top parabola chamfer start (mm) | 36.61-42.78 |
After calculating the standard tooth surface transmission error under five operating conditions, I set the modification goals, with the aim of minimizing the transmission error peak-to-peak value as much as possible. The goals are shown in Table 8.
| Condition | Transmission error peak-to-peak value (μm) |
|---|---|
| Condition 1 | 0-0.2 |
| Condition 2 | 0.1-0.3 |
| Condition 3 | 0.2-0.4 |
| Condition 4 | 0.3-0.5 |
| Condition 5 | 0.4-0.6 |
3.2.2 Topological Modification Parameters
A total of 40 schemes were successfully generated. The best scheme is applied to the standard gear to obtain the modified gear. The resulting profile modification parameters are shown in Table 9.
| Modification variable | Maximum modification amount and starting position |
|---|---|
| Parabolic tip relief (μm) | 54.42 |
| Parabolic root modification (μm) | 45.30 |
| Tip parabola starting point (degrees) | 35.484 |
| Root parabola starting point (degrees) | 17.529 |
The lead modification parameters are shown in Table 10.
| Modification variable | Maximum modification amount and starting position |
|---|---|
| Bottom parabola chamfer (μm) | 10.12 |
| Top parabola chamfer (μm) | 9.16 |
| Bottom parabola chamfer start (mm) | 23.396 |
| Top parabola chamfer start (mm) | 39.897 |
3.3 Modification Using the Genetic Algorithm
3.3.1 Genetic Algorithm Parameter Settings
The genetic algorithm process includes binary coding of modification parameters, initial population determination, fitness calculation, individual selection, crossover, mutation, and convergence judgment. I use the “Optimization, ROMAX Genetic Algorithm V2” with settings: 10 generations, population size 50, mutation 0.3, crossover 0.2, and generation gap 0.1. The modification parameter settings are the same as those used in the Monte Carlo method.
3.3.2 Topological Modification Parameters
A total of 500 schemes were generated, among which 204 schemes met the target conditions. The best scheme yields the profile modification parameters shown in Table 11.
| Modification variable | Maximum modification amount and starting position |
|---|---|
| Parabolic tip relief (μm) | 75.41 |
| Parabolic root modification (μm) | 53.73 |
| Tip parabola starting point (degrees) | 38.479 |
| Root parabola starting point (degrees) | 20.268 |
The lead modification parameters are shown in Table 12.
| Modification variable | Maximum modification amount and starting position |
|---|---|
| Bottom parabola chamfer (μm) | 5.24 |
| Top parabola chamfer (μm) | 17.80 |
| Bottom parabola chamfer start (mm) | 18.552 |
| Top parabola chamfer start (mm) | 38.230 |
3.4 Static Analysis of Gears
3.4.1 Strength Verification
Under the five operating conditions, the contact stress and bending stress of both the gear and pinion increase linearly with torque. The safety factor decreases nonlinearly with torque. The bending safety margin is relatively large, while the contact safety factor approaches 1, indicating that the tooth surface is most likely to suffer contact damage. Therefore, the gear design should be based on the tooth surface contact fatigue strength criterion.
For fatigue cumulative damage, ROMAX software uses the Palmgren-Miner linear cumulative damage rule. Under the worst operating condition, the pinion contact damage reaches over 60%, while the gear contact damage is less than 30%. This is because the pinion has more than twice the stress cycles of the gear. The bending stress is far below the fatigue limit, resulting in no bending damage within the expected life.
Important Note: Regardless of whether the Monte Carlo method or genetic algorithm is used, the contact stress, bending stress, safety factor, and damage degree obtained after modification are identical to those before modification. This is because micro-modification amounts are at the micron level, which is negligible relative to the tooth geometry dimensions. Therefore, micro-modification does not change the static strength of the gear.
3.4.2 Transmission Error Analysis
The angular displacement transmission error is:
$$ \delta = \left(\theta_2 – \theta_2^0\right) – \frac{z_1}{z_2}\left(\theta_1 – \theta_1^0\right) \tag{3.10} $$
The linear displacement transmission error is:
$$ \delta(t) = r_{b2}\left(\theta_2 – \theta_2^0\right) – r_{b1}\left(\theta_1 – \theta_1^0\right) \tag{3.11} $$
where θ1 and θ2 are the actual meshing angles of the pinion and gear, z1 and z2 are the numbers of teeth, θ1⁰ and θ2⁰ are the initial angles, and rb1 and rb2 are the base circle radii.
The transmission error comparison results are shown in Table 15.
| Condition | Standard tooth surface Max (μm) | Standard tooth surface PtP (μm) | Monte Carlo PtP (μm) | Monte Carlo PtP reduction (%) | Genetic algorithm PtP (μm) | Genetic algorithm PtP reduction (%) |
|---|---|---|---|---|---|---|
| 1 | 1.29 | 0.255 | 0.094 | 63.14 | 0.078 | 69.41 |
| 2 | 1.99 | 0.400 | 0.141 | 64.75 | 0.112 | 72.00 |
| 3 | 2.69 | 0.545 | 0.290 | 46.79 | 0.239 | 56.15 |
| 4 | 3.37 | 0.689 | 0.402 | 41.65 | 0.345 | 49.93 |
| 5 | 4.05 | 0.832 | 0.445 | 46.51 | 0.421 | 49.40 |
Both the Monte Carlo method and the genetic algorithm effectively reduce the transmission error peak-to-peak value. The genetic algorithm achieves a maximum reduction of 72.00% (Condition 2) and a minimum reduction of 49.40% (Condition 5). Both methods significantly improve the transmission stability of herringbone gears.
3.4.3 Normal Load Distribution per Unit Length
The normal load per unit length distribution determines whether the tooth surface meshing state is good. In an ideal case, the load distribution is uniform. After modification, the maximum normal load per unit length shifts from the tooth surface edges to the interior, effectively solving the edge-loading problem. The comparison results are shown in Table 16.
| Condition | Standard tooth surface | Monte Carlo modification | Genetic algorithm modification |
|---|---|---|---|
| 1 | 30.8 | 46.3 | 43.8 |
| 2 | 49.1 | 65.7 | 63.0 |
| 3 | 67.7 | 84.3 | 82.0 |
| 4 | 86.5 | 100.8 | 100.0 |
| 5 | 106.3 | 115.8 | 117.9 |
3.4.4 Contact Stress Analysis
The contact stress distribution is an important indicator of gear meshing performance. After modification, the maximum contact stress is reduced and the contact area moves toward the tooth surface interior. The comparison results are shown in Table 17.
| Condition | Before modification | Monte Carlo modification | Reduction (%) | Genetic algorithm modification | Reduction (%) |
|---|---|---|---|---|---|
| 1 | 339 | 345 | -1.74 | 320 | 5.94 |
| 2 | 428 | 410 | 4.39 | 382 | 12.04 |
| 3 | 502 | 459 | 9.37 | 434 | 15.67 |
| 4 | 567 | 500 | 13.40 | 479 | 18.37 |
| 5 | 626 | 537 | 16.57 | 520 | 20.38 |
In summary, the genetic algorithm modification yields better results in terms of transmission error reduction, load distribution improvement, and contact stress reduction. Furthermore, the success rate of the genetic algorithm (40.8%) is much higher than that of the Monte Carlo method (8%). Therefore, the genetic algorithm is more applicable for achieving excellent modification results in herringbone gears.
4. Sensitivity Analysis of Modification
During gear transmission, manufacturing and installation errors cause deviations between optimal modification simulation results and actual conditions, directly affecting transmission error and contact stress. Sensitivity analysis evaluates the stability of optimal modification parameters to these errors, which is of great significance for gear design and manufacturing. In this chapter, I conduct sensitivity analyses for optimal profile modification, optimal lead modification, and optimal topological modification, considering center distance installation errors and modification parameter variations.
4.1 Sensitivity Analysis of Profile Modification
4.1.1 Sensitivity of Profile Modification to Transmission Error
I perform sensitivity analysis based on three sets of profile modification results. The modification variation is set to ±0.7 mm in length and ±2 μm in maximum modification amount. The three sets of optimal profile modification parameters are shown in Tables 4.1, 4.2, and 4.3.
| Modification parameter | Maximum value or starting position |
|---|---|
| Parabolic tip relief (μm) | 7.88 |
| Parabolic root modification (μm) | 15.21 |
| Tip starting point (degrees) | 32.309 |
| Root starting point (degrees) | 19.352 |
| Modification parameter | Maximum value or starting position |
|---|---|
| Parabolic tip relief (μm) | 59.12 |
| Parabolic root modification (μm) | 15.12 |
| Tip starting point (degrees) | 33.203 |
| Root starting point (degrees) | 17.037 |
| Modification parameter | Maximum value or starting position |
|---|---|
| Parabolic tip relief (μm) | 26.46 |
| Parabolic root modification (μm) | 44.54 |
| Tip starting point (degrees) | 32.82 |
| Root starting point (degrees) | 14.21 |
The analysis results indicate that the variation of optimal profile modification parameters has a significant influence on the transmission error peak-to-peak value, making the profile modification sensitive to transmission error. However, the influence on the mean transmission error is small. Since the transmission error peak-to-peak value and mean value are closely related to stiffness fluctuations and combined meshing stiffness, the profile modification exhibits sensitivity to dynamic performance.
4.1.2 Sensitivity of Profile Modification to Maximum Contact Stress
For the three sets of profile modification parameters, the maximum contact stress values under modification variations are summarized. For example, for the first set, the results are shown in Tables 4.4 and 4.5.
| Condition | Optimal | Length +0.7 mm | Length -0.7 mm | Amount +2 μm | Amount -2 μm |
|---|---|---|---|---|---|
| 1 | 312 | 312 | 317 | 314 | 311 |
| 2 | 390 | 388 | 394 | 392 | 388 |
| 3 | 454 | 450 | 457 | 457 | 450 |
| 4 | 508 | 504 | 511 | 512 | 502 |
| 5 | 556 | 552 | 559 | 561 | 550 |
Similar results are obtained for the other two sets. The maximum variation is less than 3%, indicating that profile modification is insensitive to maximum contact stress.
4.1.3 Sensitivity of Center Distance Installation Error to Transmission Error with Profile Modification
For the three sets of profile optimal modifications, I analyze the effect of center distance installation error on transmission error. The results show that when the center distance installation error changes, the transmission error (both peak-to-peak value and mean value) remains almost unchanged. This is due to the separability of involute gear meshing. Therefore, the center distance installation error is insensitive to the transmission error of gears with profile modification.
4.2 Sensitivity Analysis of Lead Modification
4.2.1 Sensitivity of Lead Modification to Transmission Error
For the three sets of lead modification parameters, the modification variation is set to ±1 mm in length and ±1 μm in maximum modification amount. The three sets are shown in Tables 4.10, 4.11, and 4.12.
| Modification variable | Maximum value or starting position |
|---|---|
| Bottom parabola chamfer (μm) | 18.00 |
| Top parabola chamfer (μm) | 10.64 |
| Bottom chamfer start (mm) | 13.951 |
| Top chamfer start (mm) | 50.729 |
| Modification variable | Maximum value or starting position |
|---|---|
| Bottom parabola chamfer (μm) | 17.22 |
| Top parabola chamfer (μm) | 15.83 |
| Bottom chamfer start (mm) | 12.211 |
| Top chamfer start (mm) | 52.248 |
| Modification variable | Maximum value or starting position |
|---|---|
| Bottom parabola chamfer (μm) | 5.79 |
| Top parabola chamfer (μm) | 9.24 |
| Bottom chamfer start (mm) | 19.853 |
| Top chamfer start (mm) | 53.175 |
The analysis results show that the variation of optimal lead modification parameters has little influence on both the transmission error peak-to-peak value and the mean transmission error. Therefore, lead modification is insensitive to transmission error. Since the transmission error is closely related to stiffness fluctuations, lead modification is also insensitive to dynamic performance.
4.2.2 Sensitivity of Lead Modification to Maximum Contact Stress
For the three sets of lead modification parameters, the maximum contact stress variations are very small (less than 2%). Therefore, lead modification is insensitive to maximum contact stress.
4.2.3 Sensitivity of Center Distance Installation Error to Transmission Error with Lead Modification
For the three sets of lead optimal modifications, when the center distance installation error changes, the transmission error (both peak-to-peak value and mean value) changes significantly. For example, in Figure 4.18 (Condition 5), the transmission error changes by more than 10% when the center distance error varies from 0.008 mm to 1 mm. This is because the lead modification parameters are designed for a center distance error of 0.008 mm; when the center distance changes, the tooth surface deviates from the theoretical meshing position, causing significant transmission error changes. Therefore, the center distance installation error is sensitive to the transmission error of gears with lead modification.
4.3 Sensitivity Analysis of Topological Modification
4.3.1 Sensitivity of Topological Modification Parameters to Transmission Error
The topological modification parameters are shown in Table 4.19.
| Modification variable | Maximum value or starting position |
|---|---|
| Parabolic tip relief (μm) | 89.44 |
| Parabolic root modification (μm) | 35.25 |
| Tip starting point (degrees) | 37.34 |
| Root starting point (degrees) | 20.229 |
| Bottom parabola chamfer (μm) | 8.73 |
| Top parabola chamfer (μm) | 11.25 |
| Bottom chamfer start (mm) | 17.235 |
| Top chamfer start (mm) | 42.605 |
The analysis results show that the topological modification variation has a significant influence on the transmission error peak-to-peak value, but little influence on the mean transmission error. Therefore, topological modification is sensitive to transmission error.
4.3.2 Sensitivity of Topological Modification to Contact Stress
Under three center distance installation errors (0.008 mm, 0.5 mm, 1 mm), the contact stress distribution and maximum values are analyzed. The results are shown in Table 4.20.
| Condition | Error 0.008 mm | Error 0.5 mm | Error 1 mm |
|---|---|---|---|
| 1 | 325 | 322 | 321 |
| 2 | 393 | 390 | 386 |
| 3 | 445 | 442 | 438 |
| 4 | 489 | 485 | 482 |
| 5 | 529 | 525 | 521 |
From the contact stress distribution and the table, topological modification is insensitive to maximum contact stress and its distribution. The contact stress maximum remains in the tooth surface interior, and the variation is less than 2%.
4.3.3 Sensitivity of Center Distance Installation Error to Transmission Error with Topological Modification
For the topological modification parameters, the center distance installation error has almost no influence on the transmission error (both peak-to-peak and mean values), with a maximum change of less than 2%. Therefore, the center distance installation error is insensitive to the transmission error of gears with this topological modification.
4.4 Summary of Sensitivity Analysis
The sensitivity analysis results for the seven sets of modification parameters are summarized in Table 4.23.
| Sensitivity analysis variable | Profile modification | Lead modification | Topological modification |
|---|---|---|---|
| Transmission error | Sensitive | Insensitive | Sensitive |
| Maximum contact stress | Insensitive | Insensitive | Insensitive |
| Center distance error effect on transmission error | Insensitive | Sensitive | Insensitive |
Profile modification is sensitive to transmission error, while lead modification is insensitive. Since topological modification combines both, it is also sensitive to transmission error. Both profile and lead modification are insensitive to contact stress, so topological modification is likewise insensitive. The center distance installation error is insensitive to the transmission error of gears with profile modification, sensitive to that with lead modification, but insensitive to that with this topological modification (because the profile direction modification parameters dominate the topological modification in this case). To reduce the sensitivity, one can improve manufacturing and installation precision, and adopt shafts and bearings with higher support stiffness.
5. Experimental Verification of Transmission Error
After completing the static analysis of the gears, it is essential to verify whether the simulation results are consistent with actual measurements. Due to experimental constraints, I only verify the transmission error amplitude of the standard tooth surface. I build a closed power-flow mechanical transmission test rig and use high-precision Heidenhain angle encoders to record the input and output angular position data of herringbone gears. The data are collected with an Altai acquisition card and converted. I use Matlab software and Visual Basic 6.0 software to jointly develop a gear transmission error measurement software to process the converted data and obtain the transmission error.
5.1 Test Rig
The closed power-flow mechanical transmission test rig consists of: a DC motor, driving motor, flexible couplings, rotational speed-torque meter, elastic shaft loading coupling, test gearbox, companion gearbox, and high-precision angle encoders.
The two ROD280 angle encoders have 18,000 lines with an accuracy of ±5″ for the pinion, and the two RON886 encoders have 90,000 lines with an accuracy of ±1″ for the gear. The encoders are mounted at the shaft ends of the two gears. According to the ISO8015 standard, the eccentricity error is within 0.2 mm, and the measurement data are valid.
5.2 Data Acquisition and Calculation Software
The data acquisition software is PCI6755_SetupV1.8.0. The sampling frequency is calculated by:
$$ F = K \cdot \frac{N_1}{60} \cdot 20 \tag{5.1} $$
where F is the sampling frequency, N₁ is the pinion speed (r/min), K is the number of encoder lines, and 20 is the number of sampling points per sine wave signal.
The data calculation software includes a data input module, data operation module, and data output module. The main calculation program is For_CalTRE.m, which performs mean filtering, extracts complete sine wave cycles, converts the data into angular positions, and calculates the angular transmission error using Equation (3.10).
5.3 Measured Transmission Error of Standard Tooth Surface
The experimental conditions are shown in Table 5.1.
| Condition | Torque (N·m) |
|---|---|
| 1 | 140 |
| 2 | 220 |
| 3 | 300 |
| 4 | 380 |
| 5 | 460 |
Since the ROMAX software calculates linear transmission error, I convert it to angular transmission error for comparison using the gear base circle radius:
$$ \delta(\theta) = \frac{\delta(t)}{r_{b2}} \times \frac{180}{\pi} \times 3600 \tag{5.2} $$
or more directly:
$$ \delta(\theta) = \delta(t) \times \frac{412.5296}{d_{b2}} \tag{5.2′} $$
where δ(θ) is the angular transmission error in arc-seconds, δ(t) is the linear transmission error in μm, and db2 is the base circle diameter of the gear in mm.
The comparison results are shown in Table 5.2 and Figure 5.10.
| Condition | Theoretical amplitude (μm, arc-sec) | Experimental amplitude (arc-sec) |
|---|---|---|
| 1 | 0.255, 0.391 | 2.34 |
| 2 | 0.400, 0.613 | 5.02 |
| 3 | 0.545, 0.835 | 7.22 |
| 4 | 0.689, 1.056 | 9.02 |
| 5 | 0.832, 1.275 | 11.94 |
The theoretically calculated transmission error amplitude increases linearly with torque. The experimentally measured amplitude also increases, but at a faster rate. This is because the gear transmission system is influenced not only by static factors such as manufacturing and installation errors, but also by dynamic factors such as tooth surface friction, time-varying meshing damping, time-varying meshing stiffness, torque fluctuations, and shaft torsional/bending deformation. These dynamic factors, through their effect on the base pitch error of the involute tooth profile, cause an excessive increase in the experimentally measured transmission error amplitude. Nevertheless, the trend of the transmission error amplitude with torque is consistent between theory and experiment.
6. Conclusions and Future Work
6.1 Conclusions
This thesis focuses on herringbone gears. The main contributions and conclusions are as follows:
(1) Based on gear modification theory, I determined the topological modification method, selected the Monte Carlo method and genetic algorithm as the modification algorithms, and adopted the quadratic parabola as the modification curve.
(2) I applied the Monte Carlo method and genetic algorithm to modify herringbone gears. Both methods effectively reduce the transmission error peak-to-peak value, maximum contact stress, and improve the contact stress distribution of herringbone gears. The genetic algorithm achieves better results and has a higher success rate.
(3) Considering manufacturing and installation errors, I conducted sensitivity analyses of different modification cases. Profile modification is sensitive to transmission error, insensitive to maximum contact stress; center distance installation error is insensitive to transmission error with profile modification. Lead modification is insensitive to both transmission error and maximum contact stress; center distance installation error is sensitive to transmission error with lead modification. Topological modification is sensitive to transmission error, insensitive to contact stress; center distance installation error is insensitive to transmission error with topological modification (when profile direction modification dominates).
(4) I built a herringbone gear transmission test rig and measured the transmission error amplitude of standard tooth surfaces under five operating conditions. The experimentally measured transmission error amplitude variation is consistent with the theoretical calculation trend.
6.2 Future Work
(1) Due to experimental constraints, only the standard tooth surface was verified experimentally. Future work could extend the verification to modified herringbone gears.
(2) Due to the scope of this thesis, only center distance installation error was analyzed. The sensitivity analysis could be extended to include shaft angle installation errors in future studies.
(3) The dynamic transmission error analysis could be coupled with the static analysis to establish a more comprehensive evaluation system for herringbone gears.