
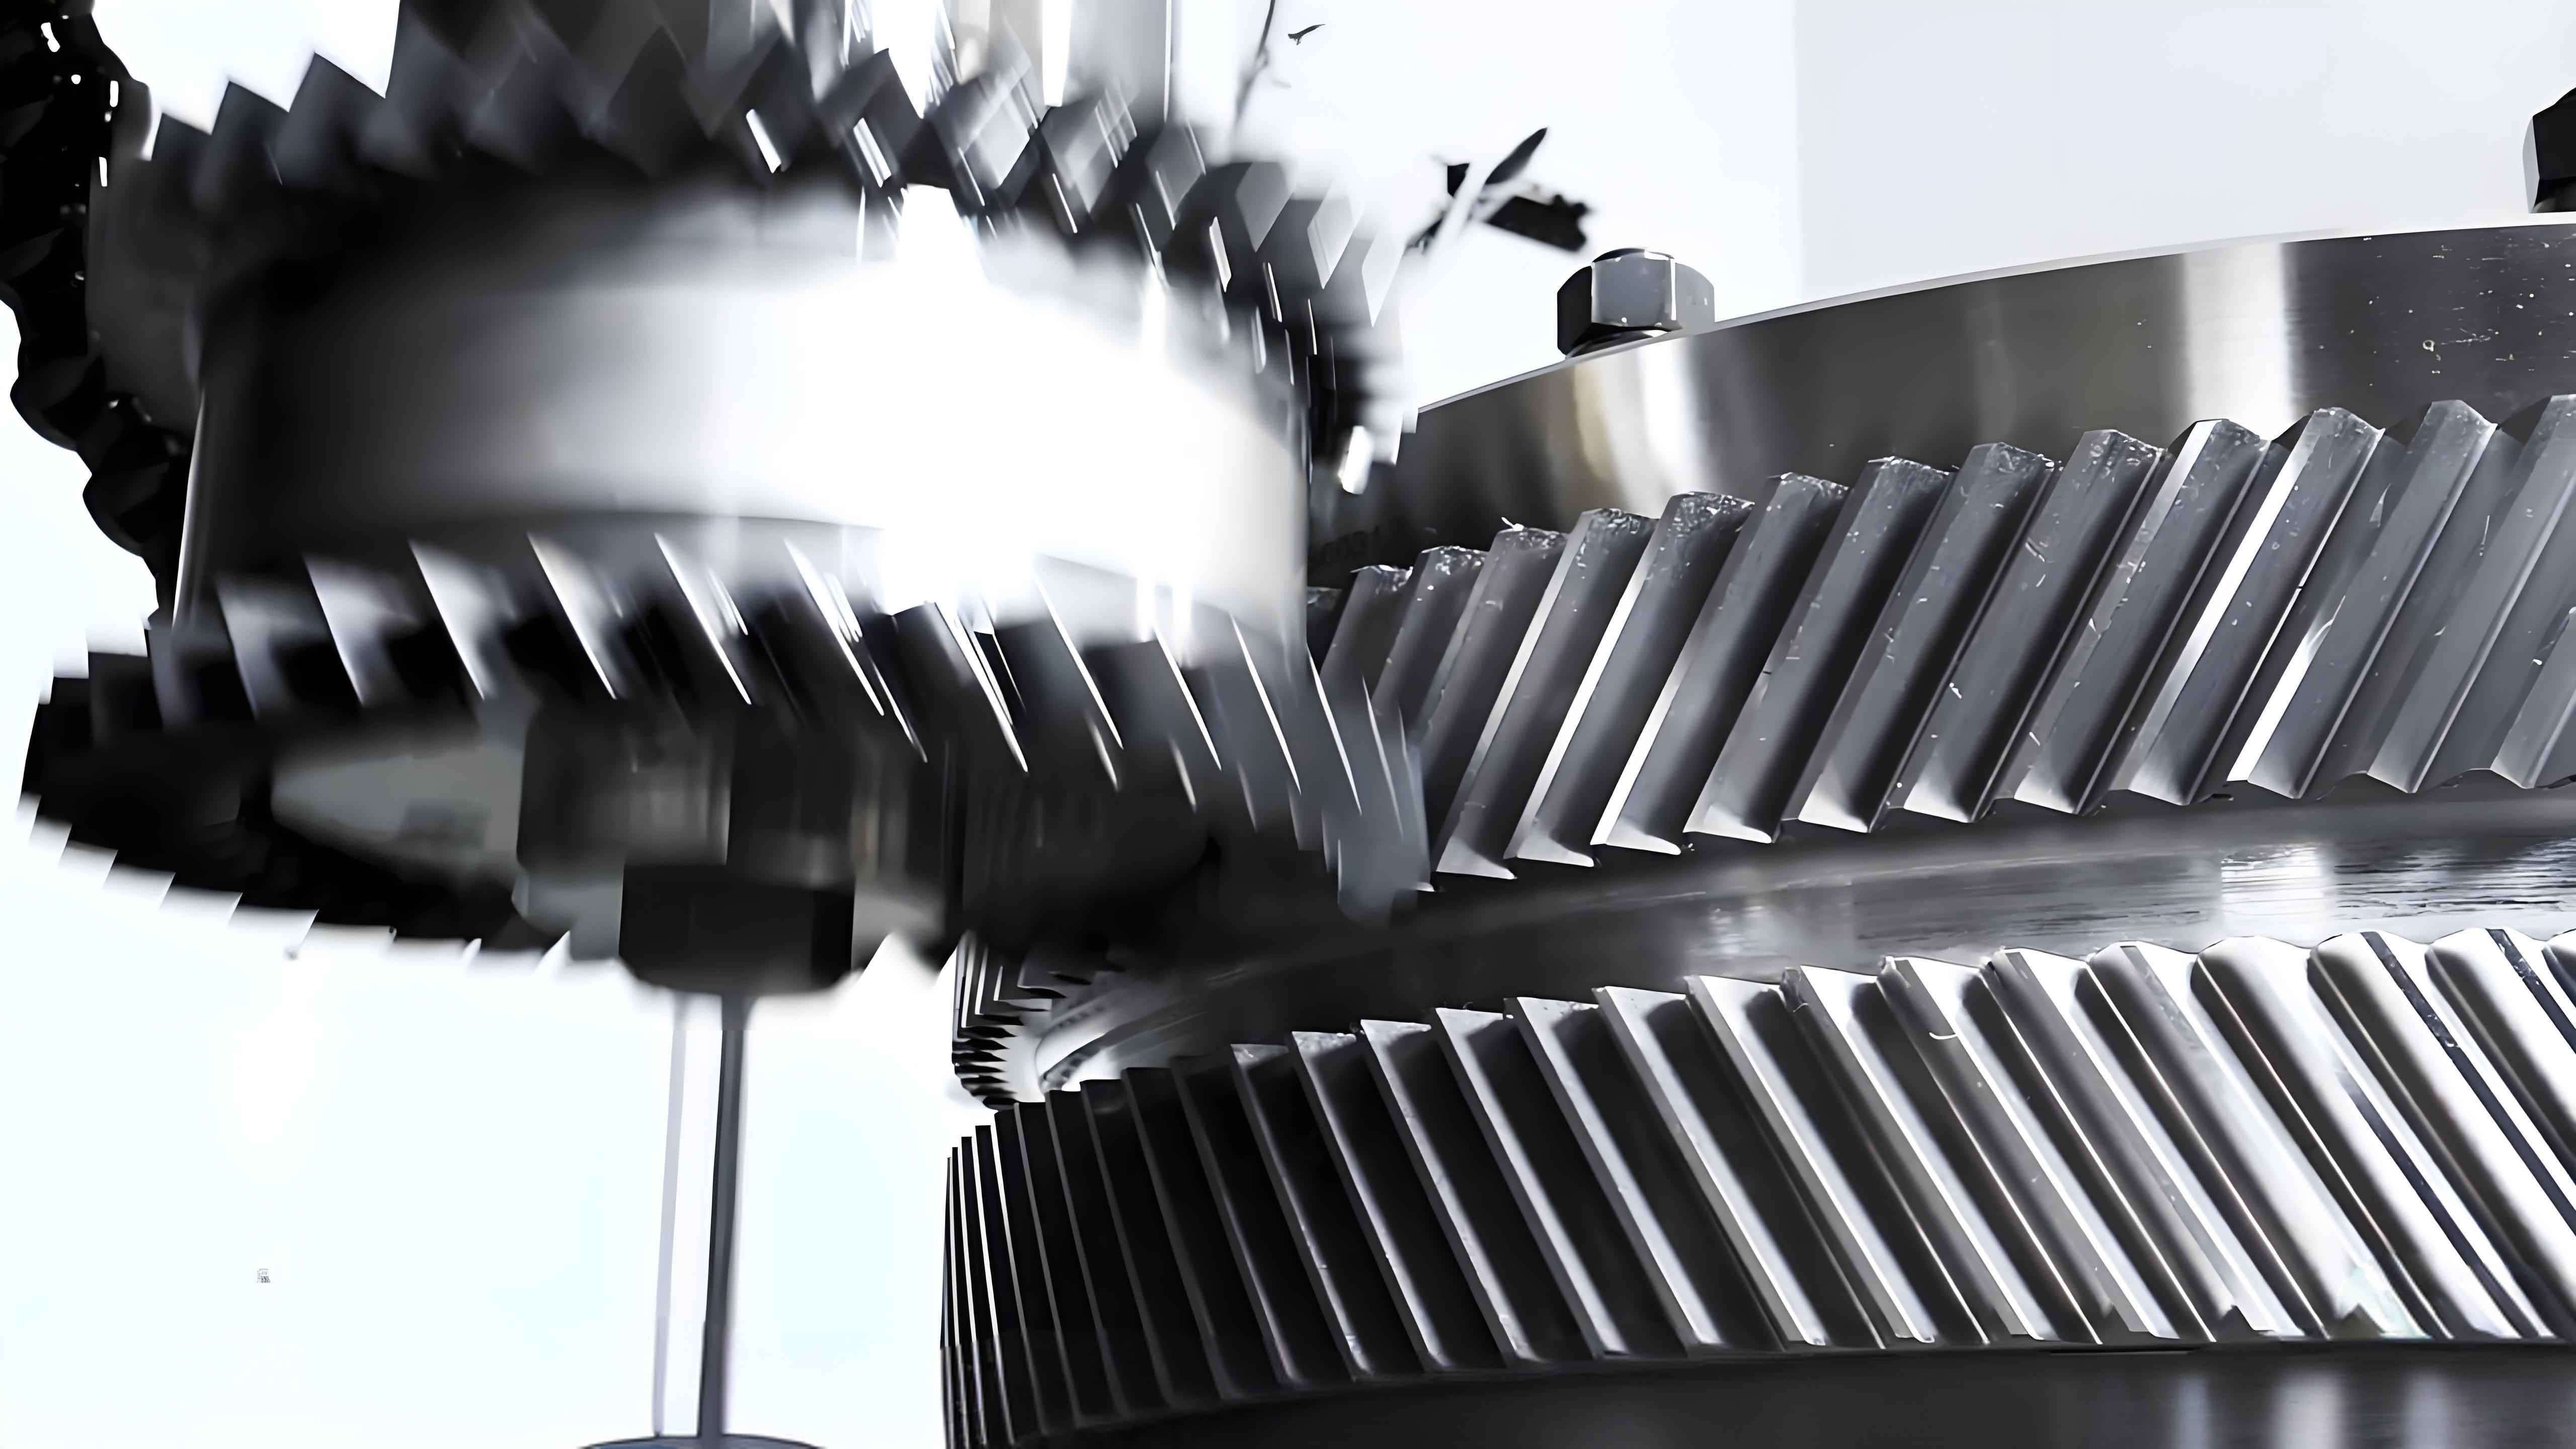
Herringbone gears, characterized by opposing helical teeth arrangements, are critical components in heavy-duty industrial applications due to their superior load-bearing capacity and vibration reduction properties. However, their complex geometry poses significant challenges in precision measurement and symmetry evaluation. This paper presents a dedicated measurement software system developed for CNC gear measurement centers to address these challenges through automated multi-project geometric error analysis.
Measurement Methodology
The measurement system employs four critical evaluation parameters for herringbone gears:
$$f_{pti} = p_i – p_m \quad (1)$$
$$F_p = \max(f_{pti}) – \min(f_{pti}) \quad (2)$$
$$f_{Ai} = Y_i – H \quad (3)$$
$$f_{oS} = \frac{1}{Z}\sum_{i=1}^{Z} f_{Ai} \quad (4)$$
Where $p_i$ represents actual pitch, $p_m$ theoretical pitch, $Y_i$ vertex coordinate, and $H$ symmetry plane position.
Software Architecture
| Module | Function | Precision (μm) |
|---|---|---|
| Tooth Profile | Form deviation measurement | ±1.2 |
| Helix | Lead angle analysis | ±1.5 |
| Pitch | Cumulative error detection | ±0.8 |
| Alignment | Symmetry evaluation | ±2.0 |
Experimental Verification
Repeatability tests conducted on 27-tooth herringbone gears demonstrated measurement stability:
| Tooth Position | Left Flank (μm) | Right Flank (μm) |
|---|---|---|
| #1 | 2.0±0.3 | 3.9±0.4 |
| #7 | 1.3±0.2 | 2.2±0.2 |
| #14 | 1.5±0.3 | 2.1±0.3 |
| #21 | 2.3±0.2 | 4.0±0.3 |
The alignment measurement algorithm calculates symmetry deviation through coordinate transformation:
$$X_i = T_i \cos\theta_i – R_i \sin\theta_i \quad (5)$$
$$Y_i = R_i \cos\theta_i – T_i \sin\theta_i \quad (6)$$
$$\theta_p = \frac{Z_p \tan\beta}{r_p} \quad (7)$$
Installation Error Compensation
Axial misalignment compensation tests showed significant improvement:
| Offset (μm) | Uncorrected (μm) | Corrected (μm) | Improvement |
|---|---|---|---|
| 20 | 62.8 | 38.8 | 38.2% |
| 40 | 68.7 | 38.5 | 43.9% |
| 60 | 77.6 | 39.4 | 49.2% |
Transmission Performance Analysis
The software calculates load distribution characteristics through vertex position analysis:
$$f_{oi} = f_{oE} – f_{oF} \quad (8)$$
$$F_o = \max|f_{oi}| \quad (9)$$
Where $f_{oE}$ and $f_{oF}$ represent load distribution coefficients for left/right helical sections.
Conclusion
The developed herringbone gear measurement system achieves comprehensive geometric evaluation with ≤2μm repeatability across all measurement parameters. Key innovations include:
- Simultaneous measurement of opposing helical sections
- Novel symmetry evaluation algorithm
- Automatic installation error compensation
- Integrated transmission performance prediction
Experimental results confirm the system’s capability to handle herringbone gears with 30° helix angles and 4mm clearance gaps while maintaining ISO 1328-1 Grade 4 accuracy. Future work will focus on dynamic transmission verification and multi-axis error coupling analysis.