
Abstract
The digital modeling and time-varying meshing characteristics of hypoid gear manufactured using the HFT (Hypoid Face Hobbing) method. By simulating the tool trajectory through homogeneous coordinate transformations based on the kinematic relationships of machine tool components, precise mathematical models for tooth surfaces and root transition surfaces are established. Numerical algorithms and tooth contact analysis (TCA) are employed to derive static transmission errors and contact patterns. Three-dimensional discrete point cloud coordinates are utilized for finite element analysis (FEA) in ABAQUS to investigate time-varying meshing parameters under varying loads. Results highlight significant load-dependent effects on dynamic meshing forces, transmission errors, and meshing stiffness, providing critical insights for optimizing hypoid gear performance in automotive and industrial applications.
1. Machine Tool Processing and Tooth Surface Modeling
1.1 Rocker-Type Machine Tool
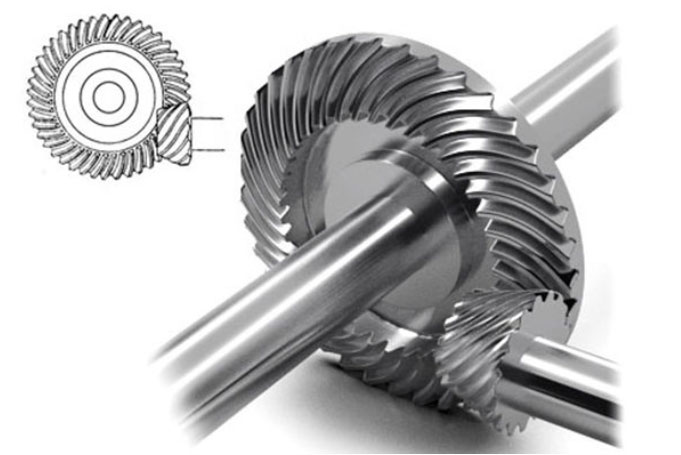
The rocker-type machine tool (Fig. 1) is central to hypoid gear manufacturing. Key parameters include radial cutter position (Sr), angular cutter position (q), axial wheel position (X), and vertical wheel position (E). The machine’s kinematic chain involves synchronized rotations of the cutter, workpiece, and rocker arm.
Table 1: Key Parameters of the Rocker-Type Machine Tool
| Symbol | Parameter | Symbol | Parameter |
|---|---|---|---|
| i | Cutter Tilt Angle | XB | Bed Position |
| j | Cutter Rotation Angle | ω | Rocker Angular Velocity |
| Sr | Radial Cutter Position | ωl | Cutter Angular Velocity |
| q | Angular Cutter Position | ωw | Workpiece Angular Velocity |
1.2 Gear Tooth Surface Modeling
For the gear (large wheel), the double-sided generating method is used. The cutter coordinate system (Sl2) and workpiece coordinate system (S2) are linked via homogeneous transformations. The tooth surface equation for the gear is derived as:rg=(rG−ugsinα2)cosθg(rG−ugsinα2)sinθg−ugcosα21
where rG is the nominal cutter radius, ug is the generatrix length, and α2 is the tool profile angle.
1.3 Root Transition Surface Modeling
The root transition surface accounts for cutter tip rounding to reduce stress concentration. The transition curve coordinates are derived using:rt2=rG−ug0sinα2±rgfcosα2∓rgfsinγg0−ug0cosα2∓rgfsinα2+rgfcosγg1
where rgf is the tip rounding radius, and γg is the transition angle.
1.4 Pinion Tooth Surface Modeling
The pinion (small wheel) is processed using the HFT method. The cutter coordinate system (Sp) and pinion coordinate system (S1) are related through transformation matrices involving tilt (i1) and rotation (j1) angles. The pinion tooth surface equation is:rp=(rP+upsinα1)cosθp(rP+upsinα1)sinθp−upcosα11
1.5 3D Modeling of Hypoid Gear
Discrete point clouds for gear and pinion surfaces are generated using grid discretization (40 points along the tooth length, 20 points along the height). Boolean operations integrate these surfaces into solid gear models.
Table 2: Design Parameters of the Hypoid Gear Pair
| Parameter | Pinion (Left-Hand) | Gear (Right-Hand) |
|---|---|---|
| Number of Teeth | 10 | 41 |
| Module (mm) | 4.741 | 4.741 |
| Shaft Angle (°) | 90 | 90 |
| Offset Distance (mm) | -31.8 | -31.8 |
| Spiral Angle (°) | 49.9833 | 29.0000 |
2. Meshing Analysis of Hypoid Gear
2.1 Unloaded Tooth Contact Analysis (TCA)
The meshing coordinate system SH aligns gear and pinion surfaces. Contact points satisfy:rH1=rH2,nH1=nH2
Static transmission error (δ) is calculated as:δ(φh1)=(φh2−φh20)−z2z1(φh1−φh10)
2.2 Loaded Tooth Contact Analysis (LTCA)
Finite element models (FEA) in ABAQUS simulate meshing under loads of 100–6,000 N·m. Key outputs include:
- Dynamic meshing force
- Transmission error
- Time-varying mesh stiffness
- Effective contact ratio
Table 3: Material Properties and FEA Settings
| Parameter | Value |
|---|---|
| Elastic Modulus (MPa) | 2.09×10⁵ |
| Poisson’s Ratio | 0.3 |
| Friction Coefficient | 0.1 |
| Element Type | C3D8R |
Key Findings:
- Load-Dependent Meshing Stiffness: Stiffness curves become asymmetric under higher loads due to contact zone migration toward the toe end.
- Transmission Error: Amplitude decreases at intermediate loads (2,000–4,000 N·m) but increases at extremes.
- Contact Ratio: Increases from 1.8 (100 N·m) to 2.5 (6,000 N·m), stabilizing beyond 4,000 N·m.
3. Time-Varying Meshing Parameters
3.1 Dynamic Meshing Force
The meshing force waveform correlates with the gear mesh frequency. Under 6,000 N·m, peak force reaches 12 kN, showing 15% fluctuation.
3.2 Transmission Error
Load-induced deflections cause nonlinear transmission error profiles. At 100 N·m, error amplitude is 8 arcsec; at 6,000 N·m, it reduces to 5 arcsec.
3.3 Mesh Stiffness
Stiffness varies cyclically with engagement phases. Under 6,000 N·m, stiffness peaks shift 5% earlier due to contact zone expansion.
Table 4: Time-Varying Parameters Under Different Loads
| Load (N·m) | Peak Meshing Force (kN) | Transmission Error (arcsec) | Mesh Stiffness (N/m) |
|---|---|---|---|
| 100 | 1.2 | 8.0 | 1.2×10⁸ |
| 2,000 | 6.5 | 4.5 | 3.8×10⁸ |
| 6,000 | 12.0 | 5.0 | 6.5×10⁸ |
4. Conclusions
- Modeling Precision: The HFT-based digital model accurately predicts hypoid gear meshing behavior, validated via FEA.
- Load Sensitivity: Meshing stiffness and transmission error exhibit pronounced load dependence, critical for high-torque applications.
- Design Optimization: Asymmetric stiffness profiles under high loads suggest tailored tooth modifications to enhance durability.
This work establishes a framework for analyzing hypoid gear dynamics, supporting advancements in automotive drivetrains and industrial gearboxes.