
A spiral bevel gear transmits motion between intersecting shafts through teeth whose traces are curved and progressively engaging. Compared with straight bevel gears, the gradual contact of the spiral tooth flank raises the contact ratio, spreads load over a longer path, and lowers mesh noise, which is why the geometry dominates final drives in automobiles, aircraft engines, marine transmissions and heavy machinery. The same geometry, however, makes the part unusually sensitive to heat treatment: the tooth is thin at the toe, massive at the heel, and supported by a rim whose stiffness changes abruptly. When the gear is quenched from the austenitizing temperature, the thermal gradient and the austenite-to-martensite transformation act on that uneven stiffness and produce a distortion field that is largest at the tooth tips.
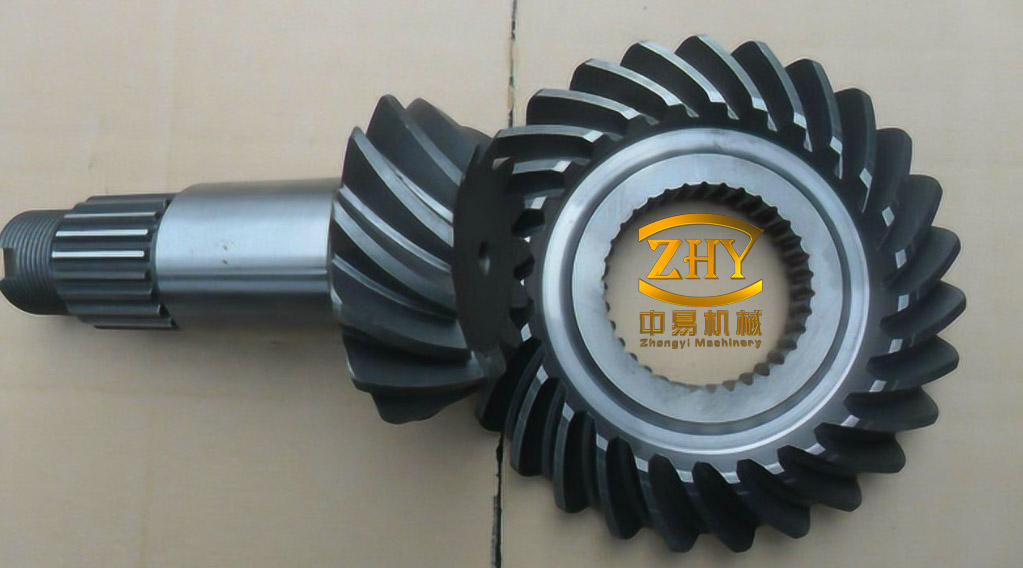
Carburizing–quenching is the standard route for such gears. A low-carbon alloy steel is held in a carbon-rich atmosphere so that carbon diffuses into the flank, then quenched to form a hard martensitic case over a tough, low-carbon core. The resulting hardness gradient — typically 58–64 HRC at the surface against roughly 35–40 HRC at the core — is what gives the gear its wear and fatigue resistance without embrittling the whole section. Distortion is the price. Because the flanks are normally cut to near-final size before heat treatment, any movement after hardening must be removed by grinding or the part is rejected, and hard finishing of a spiral bevel flank is both slow and expensive.
Why distortion is intrinsic to the process
Three strain sources act simultaneously and are not separable in practice:
- Thermal strain. The surface of a tooth loses heat to the oil far faster than the core. The resulting transient temperature difference generates a compressive surface stress during cooling that reverses into tension once the section equalizes.
- Transformation strain and transformation plasticity. Martensite occupies a larger specific volume than the austenite from which it forms. Because carbon lowers the martensite start temperature, the carbon-rich case transforms later and at a lower temperature than the core, so the two regions expand against each other while the yield strength is still low.
- Inherited stress. Machining and forging residuals are released as the material softens at the austenitizing temperature, adding a component that no heat-treatment parameter alone can control.
The carbon profile therefore couples chemistry to mechanics: the boost (strong carburizing) stage builds a steep surface carbon gradient, the diffusion stage flattens it, and both determine where the martensite start temperature sits and hence where transformation strain is generated. Reasonable process design does not attempt to eliminate distortion — the aim is to hold it inside a band that grinding can absorb while keeping surface hardness above specification.
The coupled field problem
A predictive model has to solve five interacting fields: temperature, carbon concentration, phase fractions, stress–strain, and hardness. The temperature field follows the transient conduction equation with a latent-heat source,
$$\rho c\,\frac{\partial T}{\partial t}=\lambda\left(\frac{\partial^{2}T}{\partial x^{2}}+\frac{\partial^{2}T}{\partial y^{2}}+\frac{\partial^{2}T}{\partial z^{2}}\right)+Q_{x}$$
where λ is conductivity, ρ density, c specific heat and Qx the latent heat released or absorbed by phase change. At the surface the gear exchanges heat with the quenchant through a convection boundary condition,
$$-\lambda\frac{\partial T}{\partial n}=H_{k}\,(T_{w}-T_{c})$$
with Hk the heat-transfer coefficient and Tc the bath temperature. Hk is the single most influential boundary input in quenching simulation because it passes through film boiling, nucleate boiling and convection regimes within a few seconds.
Carbon transport is described by Fick’s second law with a concentration- and temperature-dependent diffusivity,
$$\frac{\partial C}{\partial t}=D\,\frac{\partial^{2}C}{\partial x^{2}},\qquad D(T,C)=D_{0.4}\exp\!\left(-\frac{Q}{RT}\right)\exp\!\left[B\,(C-0.4)\right]$$
using D0.4 = 25.5 mm²/s, an activation energy Q = 141 kJ/mol and B = 0.8. The surface flux is set by the difference between the furnace potential and the actual surface carbon,
$$-D\frac{\partial C}{\partial x}=\beta\,(C_{e}-C_{s}),\qquad \beta=\beta_{0}\exp\!\left(-\frac{E}{RT}\right)$$
with β0 = 0.00347 mm/s and E = 34 kJ/mol. This boundary condition is what makes carbon potential a genuine process variable rather than a bookkeeping entry: it controls the surface concentration that the diffusion stage then redistributes.
Diffusional transformation of austenite to pearlite or bainite is handled by Johnson–Mehl–Avrami–Kolmogorov kinetics calibrated to the TTT diagram,
$$\xi=1-\exp\!\left(-kt^{n}\right)$$
while the diffusionless austenite-to-martensite reaction follows a Koistinen–Marburger form in which the martensite start temperature depends on local carbon content and the exponent carries a stress correction,
$$\xi_{M}=1-\exp\!\left[-\alpha\left(M_{s}(C)-T\right)\right]$$
Total strain is additively decomposed, and the hardness of the resulting multiphase aggregate is obtained from a rule of mixtures in which only the martensite term is carbon-dependent:
$$d\varepsilon=d\varepsilon^{e}+d\varepsilon^{p}+d\varepsilon^{th}+d\varepsilon^{tr},\qquad H=\sum_{i}\omega_{i}H_{i}$$
The phase hardnesses used for the aggregate are 30 HRC for pearlite, 42 HRC for bainite, 20 HRC for retained austenite and 25 HRC for ferrite, with martensite hardness given by a cubic polynomial in carbon content.
Building a defensible finite-element representation
The demonstrator part is a left-hand spiral bevel gear in 18Cr2Ni4WA, a nickel–chromium–tungsten carburizing steel with high hardenability and good core toughness (Table 1 and Table 2). The solid model is exported as an STL surface and meshed into 18,218 nodes and 77,031 elements. A displacement constraint is applied to the bottom face to represent flat loading in the furnace basket, and the carburizing atmosphere history, the convection boundary and the phase-transformation data are defined in a heat-treatment module coupled to the thermal, microstructural and mechanical solvers.
| Parameter | Value | Parameter | Value |
|---|---|---|---|
| Module | 3 mm | Number of teeth | 44 |
| Hand | Left | Face width | 20.2 mm |
| Addendum coefficient | 0.85 | Pressure angle | 20° |
| Mean spiral angle | 35° | Shaft angle | 90° |
| Pitch diameter | 132 mm | Outer cone distance | 69.73 mm |
| Tip cone angle | 73.39° | Mounting distance | 27 mm |
| C | Si | Mn | Cr | Ni | W | Ac1 | Ac3 | Ms | Mf |
|---|---|---|---|---|---|---|---|---|---|
| 0.18 | 0.27 | 0.45 | 1.65 | 4.0 | 1.0 | 695 °C | 800 °C | 310 °C | 250 °C |
Oil quenching is modelled with a temperature-dependent heat-transfer coefficient obtained by inverse analysis of cooling curves measured with a 1Cr18Ni9Ti probe (Table 3). The coefficient peaks near 470 °C, where the vapour blanket collapses and nucleate boiling begins; this peak, not the low-temperature convection value, governs the severity of the thermal shock at the flank.
| Temperature (°C) | 100 | 200 | 300 | 350 | 400 | 470 | 500 | 600 | 700 | 800 | 850 |
|---|---|---|---|---|---|---|---|---|---|---|---|
| h (W·m⁻²·°C⁻¹) | 140 | 210 | 495 | 1000 | 1875 | 3375 | 3200 | 1525 | 950 | 700 | 560 |
Stage 1: screening four parameters with a Box–Behnken design
Four variables were screened first — carburizing temperature, boost time, diffusion time and quenching temperature — using a 27-run Box–Behnken design with three centre points (Table 4). Across the whole design space the total distortion ranged from 0.121 to 0.151 mm, with the maximum on the run combining high boost and diffusion times with an 880 °C quench. Every run produced expansion rather than contraction, concentrated at the large-end and small-end tooth tips. Surface hardness ranged from 61.8 to 63.1 HRC.
| Factor | Symbol | Lower level | Upper level |
|---|---|---|---|
| Carburizing temperature | X1 | 900 °C | 930 °C |
| Boost time | X2 | 5.00 h | 8.00 h |
| Diffusion time | X3 | 1.00 h | 2.50 h |
| Quenching temperature | X4 | 820 °C | 880 °C |
Second-order regression models fitted by least squares reproduced the simulation data with high fidelity (Table 5). For the distortion model the coefficient of determination reached 99.65 % with an F value of 646.3; for hardness the corresponding figures were 98.72 % and 256.79. Normal probability plots of the residuals followed the diagonal, so the quadratic form is adequate over the tested window.
| Response | Model df | Regression SS | F | P | R² | Adj. R² |
|---|---|---|---|---|---|---|
| Distortion D | 8 | 0.001646 | 646.3 | <0.0001 | 99.65 % | 99.50 % |
| Surface hardness H | 6 | 4.50669 | 256.79 | <0.0001 | 98.72 % | 98.33 % |
Main-effect ranking differed between the two responses. Distortion was dominated by quenching temperature, followed by boost time, diffusion time and carburizing temperature. Hardness was dominated by diffusion time, followed by quenching temperature, boost time and carburizing temperature. The response surfaces explain the ordering. Raising the quench temperature from 820 to 880 °C increased distortion from about 0.121–0.132 mm to 0.140–0.151 mm, because a hotter austenite before quenching means a larger thermal gradient, more complete austenite homogenization and a larger volume fraction transforming to martensite. Extending diffusion from 1.0 to 2.5 h raised hardness by roughly 1.2 HRC by pushing carbon deeper and flattening the profile. Carburizing temperature acted weakly and negatively on both responses: a hotter furnace accelerates diffusion but lowers the flow stress of the part, so the net distortion change is small and slightly favourable.
A desirability search on the fitted models, weighted toward minimum distortion and maximum hardness, returned 915 °C carburizing, 5 h boost, 2.27 h diffusion (about 136 min) and an 820 °C quench, with a composite desirability of 0.8155. Re-running that combination gave 0.123 mm distortion and 62.7 HRC, confirming the model but also showing that the four-variable window still left substantial room for improvement.
Stage 2: entropy-weighted optimization of the carburizing schedule
The screening result pointed to two gaps. First, boost times of 5–8 h were unnecessarily long and pushed distortion upward with little hardness gain. Second, carbon potential had been held fixed even though it determines surface carbon and therefore the local martensite start temperature. The second design therefore moved to shorter boost times and introduced both potentials as factors: five factors at four levels in a 16-run orthogonal array (Table 6).
| Level | A: carburizing temperature (°C) | B: boost potential (%) | C: boost time (h) | E: diffusion potential (%) | F: diffusion time (h) |
|---|---|---|---|---|---|
| 1 | 900 | 0.75 | 2.50 | 0.80 | 1.00 |
| 2 | 910 | 0.80 | 3.00 | 0.85 | 1.50 |
| 3 | 920 | 0.85 | 3.50 | 0.90 | 2.00 |
| 4 | 930 | 0.90 | 4.00 | 0.95 | 2.50 |
Because the two responses have different units and opposite preferences, the experimental matrix was first normalized with a smaller-the-better membership function for distortion and a larger-the-better function for hardness, then weighted by an entropy scheme corrected with engineering judgement (Table 7). Objective entropy weighting alone gave distortion 0.604 and hardness 0.396; the combined weight of 0.717 for distortion reflects the fact that flank deviation, not hardness, drives scrap and hard-finishing cost.
| Indicator | Entropy Hi | Objective weight ωi | Subjective weight τi | Combined weight Wi |
|---|---|---|---|---|
| Distortion | 0.9447 | 0.6042 | 0.624 | 0.717 |
| Hardness | 0.9638 | 0.3958 | 0.376 | 0.283 |
Summing the weighted membership values level by level and applying the maximum-membership principle gives the significance ranking C > F > E > A > B: boost time, diffusion time, diffusion potential, carburizing temperature, boost potential. The ranking is level-dependent, which is informative in itself. At the first level, boost time dominates because a fast, high-carbon surface layer forms early; at the second level, diffusion time overtakes it as carbon transport into the matrix becomes rate-limiting; at the third level, diffusion potential becomes the controlling variable for maintaining a graded profile; at the fourth level, carburizing temperature takes over as thermal activation governs both diffusion and the flow stress of the part.
Pairwise interaction analysis by the same membership criterion identified boost time × diffusion time as the strongest interaction (membership 0.3045), followed by diffusion potential with boost time and diffusion time (0.2699), then carburizing temperature with the time variables (0.2603), with boost potential interacting weakly with everything (0.2575). The optimum combining all five factors was A = 920 °C, B = 0.80 %, C = 2.50 h, E = 0.90 %, F = 1.00 h. In effect the optimizer traded time for potential: the case chemistry is established by a high diffusion potential over one hour rather than by a long, distortion-generating boost.
Second-order regression models fitted to the 16 runs reproduced the data with R² = 99.97 % (F = 1888.02) for distortion and R² = 97.35 %, adjusted R² = 90.06 % (F = 13.36) for hardness, both significant at P < 0.0001. Five confirmation runs around the optimum are summarized in Table 8; the optimum simultaneously gave the lowest distortion and one of the highest hardness values in the set.
| Run | A (°C) | B (%) | C (h) | E (%) | F (h) | D (mm) | H (HRC) |
|---|---|---|---|---|---|---|---|
| Optimized | 920 | 0.80 | 2.5 | 0.90 | 1.0 | 0.0966 | 62.6 |
| Control 1 | 930 | 0.80 | 2.5 | 0.90 | 1.0 | 0.0972 | 62.1 |
| Control 2 | 920 | 0.85 | 2.5 | 0.90 | 1.0 | 0.0984 | 61.9 |
| Control 3 | 920 | 0.80 | 3.0 | 0.90 | 1.0 | 0.1020 | 62.2 |
| Control 4 | 920 | 0.80 | 2.5 | 0.85 | 1.0 | 0.0972 | 62.2 |
| Control 5 | 920 | 0.80 | 2.5 | 0.90 | 1.5 | 0.0998 | 62.8 |
Stage 3: grey relational optimization of oil quenching
With the carburizing schedule fixed, three quench variables remained: austenitizing temperature before the quench, holding time in the oil, and oil bath temperature, each at four levels in a second 16-run array. The measured responses ranged from 0.0966 to 0.124 mm distortion and 60.9 to 62.7 HRC hardness, with the worst distortion appearing at the highest austenitizing temperature combined with the highest oil temperature.
Grey relational analysis converts the two-response problem into a single index. Each response is normalized — smaller-the-better for distortion, larger-the-better for hardness — and the grey relational coefficient is computed against a unit reference sequence,
$$\gamma_{0i}(k)=\frac{\Delta_{\min}+\xi\,\Delta_{\max}}{\Delta_{0i}(k)+\xi\,\Delta_{\max}}$$
with distinguishing coefficient ξ = 0.5, after which the coefficients are averaged over the two responses to give a grade G,
$$G_{i}=\frac{1}{n}\sum_{k=1}^{n}\gamma_{0i}(k)$$
Averaging the grades by factor level and taking the range yields the significance order (Table 9): oil temperature first with a range of 0.3473, then austenitizing temperature at 0.118 and holding time at 0.104.
| Factor | Level 1 | Level 2 | Level 3 | Level 4 | Range |
|---|---|---|---|---|---|
| T1: austenitizing temperature (820/840/860/880 °C) | 0.6416 | 0.5820 | 0.5358 | 0.5236 | 0.118 |
| T2: holding time (1200/1500/1800/2100 s) | 0.6348 | 0.5882 | 0.5308 | 0.5293 | 0.104 |
| T3: oil temperature (20/40/60/80 °C) | 0.7843 | 0.6027 | 0.4592 | 0.4369 | 0.3473 |
The main-effect plots resolve an apparent inconsistency in that ranking. Quenching temperature produces the steepest slope against the normalized distortion coefficient, so it is the dominant control on geometric movement; oil temperature produces the steepest slope against the normalized hardness coefficient, so it dominates the composite grade. Raising the bath from 20 to 80 °C cut surface hardness from 62.6 to 60.5 HRC while increasing distortion only from 0.0966 to 0.1030 mm, whereas raising the austenitizing temperature from 820 to 880 °C increased distortion from 0.0966 to 0.1140 mm at constant hardness. Oil temperature therefore acts on both responses, while austenitizing temperature acts almost exclusively on distortion. The optimum by maximum grade is T1 = 820 °C, T2 = 1200 s, T3 = 20 °C, obtained both from the level averages and from a response-optimizer solution on the fitted grade model,
$$G = 36.14 – 0.00591\,T_{1} – 0.000031\,T_{2} – 0.0822\,T_{3} + 0.0001\,T_{3}^{2} + 0.000078\,T_{1}T_{3}$$
The grade model is significant at P < 0.0001 with F = 65.66, R² = 97.04 % and adjusted R² = 95.57 %, and its residuals are normally distributed. Confirmation runs (Table 10) show the optimum giving the smallest distortion in the set with hardness essentially unchanged, so the choice costs nothing in surface quality.
| Run | T1 (°C) | T2 (s) | T3 (°C) | D (mm) | H (HRC) |
|---|---|---|---|---|---|
| Optimized | 820 | 1200 | 20 | 0.0966 | 62.6 |
| Control 1 | 840 | 1200 | 20 | 0.1000 | 62.6 |
| Control 2 | 820 | 1500 | 20 | 0.0985 | 62.6 |
| Control 3 | 820 | 1200 | 40 | 0.0996 | 62.1 |
| Control 4 | 820 | 1200 | 80 | 0.1030 | 60.5 |
| Control 5 | 880 | 1200 | 20 | 0.1140 | 62.6 |
Microstructure and hardness after the optimized cycle
The predicted martensite fraction reaches 96.3 % at the core and falls toward the tooth tips, while retained austenite follows the opposite pattern: below 10 % over most of the part but up to 16.3 % at the large-end tip, where the carburized surface has the highest carbon content. The mechanism is straightforward. Carbon depresses the martensite start temperature, so the carbon-lean core transforms first and more completely during cooling, whereas the carbon-rich tip transforms last, at a temperature where the driving force is smaller and more austenite is stabilised. Core hardness in the same simulation falls to 34.5 HRC, with most of the core below 40 HRC. The resulting architecture — a 62.6 HRC surface over a soft, tough core — is exactly what the application requires, and the retained austenite level at the tip is the one microstructural feature worth monitoring, since excessive austenite there would depress local hardness and shift the contact pattern under load.
Shop-floor verification
The optimized cycle was run on production equipment: carburizing at 920 °C with a 0.35 % C start potential, boost at 0.8 % C, diffusion at 0.9 % C, pre-cooling to about 850 °C and quenching into oil at 820 °C with a bath temperature of 20 °C. Five tooth spaces of the treated gear were measured on a Gleason 650MS gear measuring machine, which compares the coordinates of the actual flank against the theoretical flank and reports the deviation as a distortion value (Table 11).
| Tooth space | Measured (mm) | Simulated (mm) | Relative error |
|---|---|---|---|
| 1 | 0.1170 | 0.0966 | 17.44 % |
| 2 | 0.1130 | 0.0966 | 14.51 % |
| 3 | 0.1150 | 0.0966 | 16.00 % |
| 4 | 0.1180 | 0.0966 | 18.14 % |
| 5 | 0.1230 | 0.0966 | 21.46 % |
Hardness was measured with a R(D)-150A1 Rockwell tester on the flat datum face opposite the mounting surface, taking several points to avoid a single indentation dominating the result (Table 12). Surface hardness on the flanks and tips is predicted to be higher than on the flat face, so the flat-face readings are a conservative proxy for the part as a whole.
| Point | Measured (HRC) | Simulated (HRC) | Relative error |
|---|---|---|---|
| 1 | 61.0 | 58.5 | 4.10 % |
| 2 | 60.0 | 58.5 | 2.50 % |
| 3 | 60.3 | 58.5 | 3.00 % |
| 4 | 60.8 | 58.5 | 3.78 % |
| 5 | 59.5 | 58.5 | 1.68 % |
Hardness agreement is good, within 4.1 % at every point, which is what would be expected when the carbon profile and phase kinetics are correct. Distortion agreement is weaker: the simulation underpredicts by 14.5–21.5 %, and the measured maximum of 0.123 mm occurs at the large-end tooth tip, the same location the simulation identifies. The systematic sign of the discrepancy is more informative than its magnitude. A uniform underprediction of this kind is typical of boundary-condition and geometry idealization rather than of a wrong mechanism: the heat-transfer coefficient is a one-dimensional probe measurement applied to a three-dimensional tooth, the finite-element mesh cannot resolve the sharp tip radius where stress concentrates, the bottom-face constraint is a simplification of basket loading, and the actual furnace potential scatters around its set point. Machining residual stress released during austenitizing adds a component the model does not carry. All of these push the real part toward more movement, and none changes the predicted location or the predicted ranking of parameters.
What the parameter hierarchy means in practice
Across 59 screening, orthogonal and confirmation simulations plus 10 physical comparison runs, the same picture emerges. Distortion in a carburized and quenched spiral bevel gear is governed primarily by the thermal severity of the quench and by the duration of the carbon cycle, with carbon potential acting as the variable that lets the cycle be shortened without losing case hardness. The saving is not marginal: the best combination reduced total distortion from a worst-case 0.151 mm to 0.0966 mm, roughly a 36 % reduction, while retaining 62.6 HRC surface hardness, and it did so with a shorter cycle than the original 5–8 h boost schedule.
Two conclusions are worth carrying into process development. First, quench temperature and oil temperature must be treated as separate levers with separate consequences: lowering the austenitizing temperature buys geometric accuracy with almost no hardness penalty, whereas lowering the bath temperature buys hardness at a modest distortion cost. Second, the interaction between boost time and diffusion time is the strongest in the carburizing stage, so specifying either one in isolation is unsafe — the pair, together with the two potentials, defines the carbon profile that sets local transformation strain.
The limits of the approach are equally clear. The material data, particularly the transformation plasticity parameters and the quenchant heat-transfer coefficients, come from literature and probe measurements rather than from the specific heat of the production furnace, so absolute distortion predictions carry the systematic bias seen in Table 11. Mesh refinement near the tooth tip and a genuinely three-dimensional quench boundary would reduce that bias. On the optimization side, response surface, entropy weighting and grey relational analysis are all well-established but essentially sequential; population-based methods such as particle swarm or simulated annealing could search the coupled five-factor space more efficiently and would allow distortion, hardness, case depth and cycle time to be traded simultaneously. Finally, the verification here rests on a single treated gear, so the scatter of the process itself — the quantity that actually determines whether a tolerance band is met — remains to be established over repeated batches.