
Gear transmission is one of the most fundamental and widely used methods of power transmission in mechanical engineering. Among various gear types, the straight spur gear is the simplest and most commonly employed configuration, characterized by teeth that are parallel to the axis of rotation. Straight spur gears are extensively utilized in applications ranging from industrial reducers and automotive transmissions to precision instruments, where they are required to transmit motion and torque reliably under varying loads and speeds. In high-speed or heavy-duty scenarios, gear pairs experience repeated meshing cycles and significant dynamic forces, which directly affect their operational stability, noise levels, and fatigue life. Therefore, understanding the dynamic behavior of straight spur gears during meshing is critical for optimizing their design and improving overall system performance.
Traditional experimental studies on gear dynamics are often time‑consuming, costly, and limited by measurement accuracy. With the advancement of virtual prototyping technology, simulation software such as ADAMS (Automatic Dynamic Analysis of Mechanical Systems) provides a powerful platform for predicting the dynamic response of gear systems. This approach allows engineers to evaluate contact forces, angular velocities, and transmission errors under realistic operating conditions without building physical prototypes. In this work, I employed ADAMS to conduct a comprehensive dynamic simulation of a straight spur gear pair. The objectives were to validate the virtual model through transmission ratio verification and to analyze the fluctuating nature of the meshing force, which is essential for studying gear vibration and noise. The following sections detail the model construction, simulation setup, and key findings, supplemented with extensive numerical tables and mathematical formulations.
1. Theoretical Background of Straight Spur Gear Meshing
The dynamic behavior of straight spur gears is governed by the interaction between tooth surfaces during engagement. The meshing process involves a combination of rolling and sliding, leading to time‑varying contact forces. The fundamental equation of motion for a single degree‑of‑freedom gear pair can be expressed as:
$$J_1 \ddot{\theta}_1 + c \left( \dot{\theta}_1 – \dot{\theta}_2 \right) + k(t) \left( \theta_1 – \theta_2 \right) = T_1(t)$$
$$J_2 \ddot{\theta}_2 – c \left( \dot{\theta}_1 – \dot{\theta}_2 \right) – k(t) \left( \theta_1 – \theta_2 \right) = -T_2(t)$$
where \(J_1\) and \(J_2\) are the moments of inertia of the driving and driven gears, \(\theta_1\) and \(\theta_2\) are their angular displacements, \(c\) is the viscous damping coefficient, \(k(t)\) is the time‑varying meshing stiffness, and \(T_1(t)\), \(T_2(t)\) are the applied torques. The meshing stiffness \(k(t)\) varies periodically due to the change in the number of tooth pairs in contact and the deformation of the teeth. For straight spur gears, the theoretical contact ratio is typically between 1 and 2, meaning that during part of the rotation, two pairs of teeth share the load, and during the rest, only one pair carries the entire load. This variation introduces periodic excitation that can cause resonance if the excitation frequency coincides with the natural frequency of the system.
The contact force between two meshing teeth can be approximated by the Hertzian contact theory. The maximum contact pressure \(p_{\text{max}}\) at the pitch point is given by:
$$p_{\text{max}} = \sqrt{\frac{F_n E^*}{\pi R^* b}}$$
where \(F_n\) is the normal contact force, \(E^*\) is the equivalent Young’s modulus, \(R^*\) is the equivalent radius of curvature, and \(b\) is the tooth face width. The equivalent parameters are defined as:
$$\frac{1}{E^*} = \frac{1-\nu_1^2}{E_1} + \frac{1-\nu_2^2}{E_2}$$
$$\frac{1}{R^*} = \frac{1}{R_1} + \frac{1}{R_2}$$
with \(E_1\), \(E_2\) and \(\nu_1\), \(\nu_2\) being the elastic moduli and Poisson’s ratios of the two gears, and \(R_1\), \(R_2\) the radii of curvature at the contact point. These equations underline the importance of gear geometry and material properties in determining the dynamic contact stresses.
2. Virtual Prototype Model of the Straight Spur Gear Pair
2.1 Gear Geometry and Solid Model
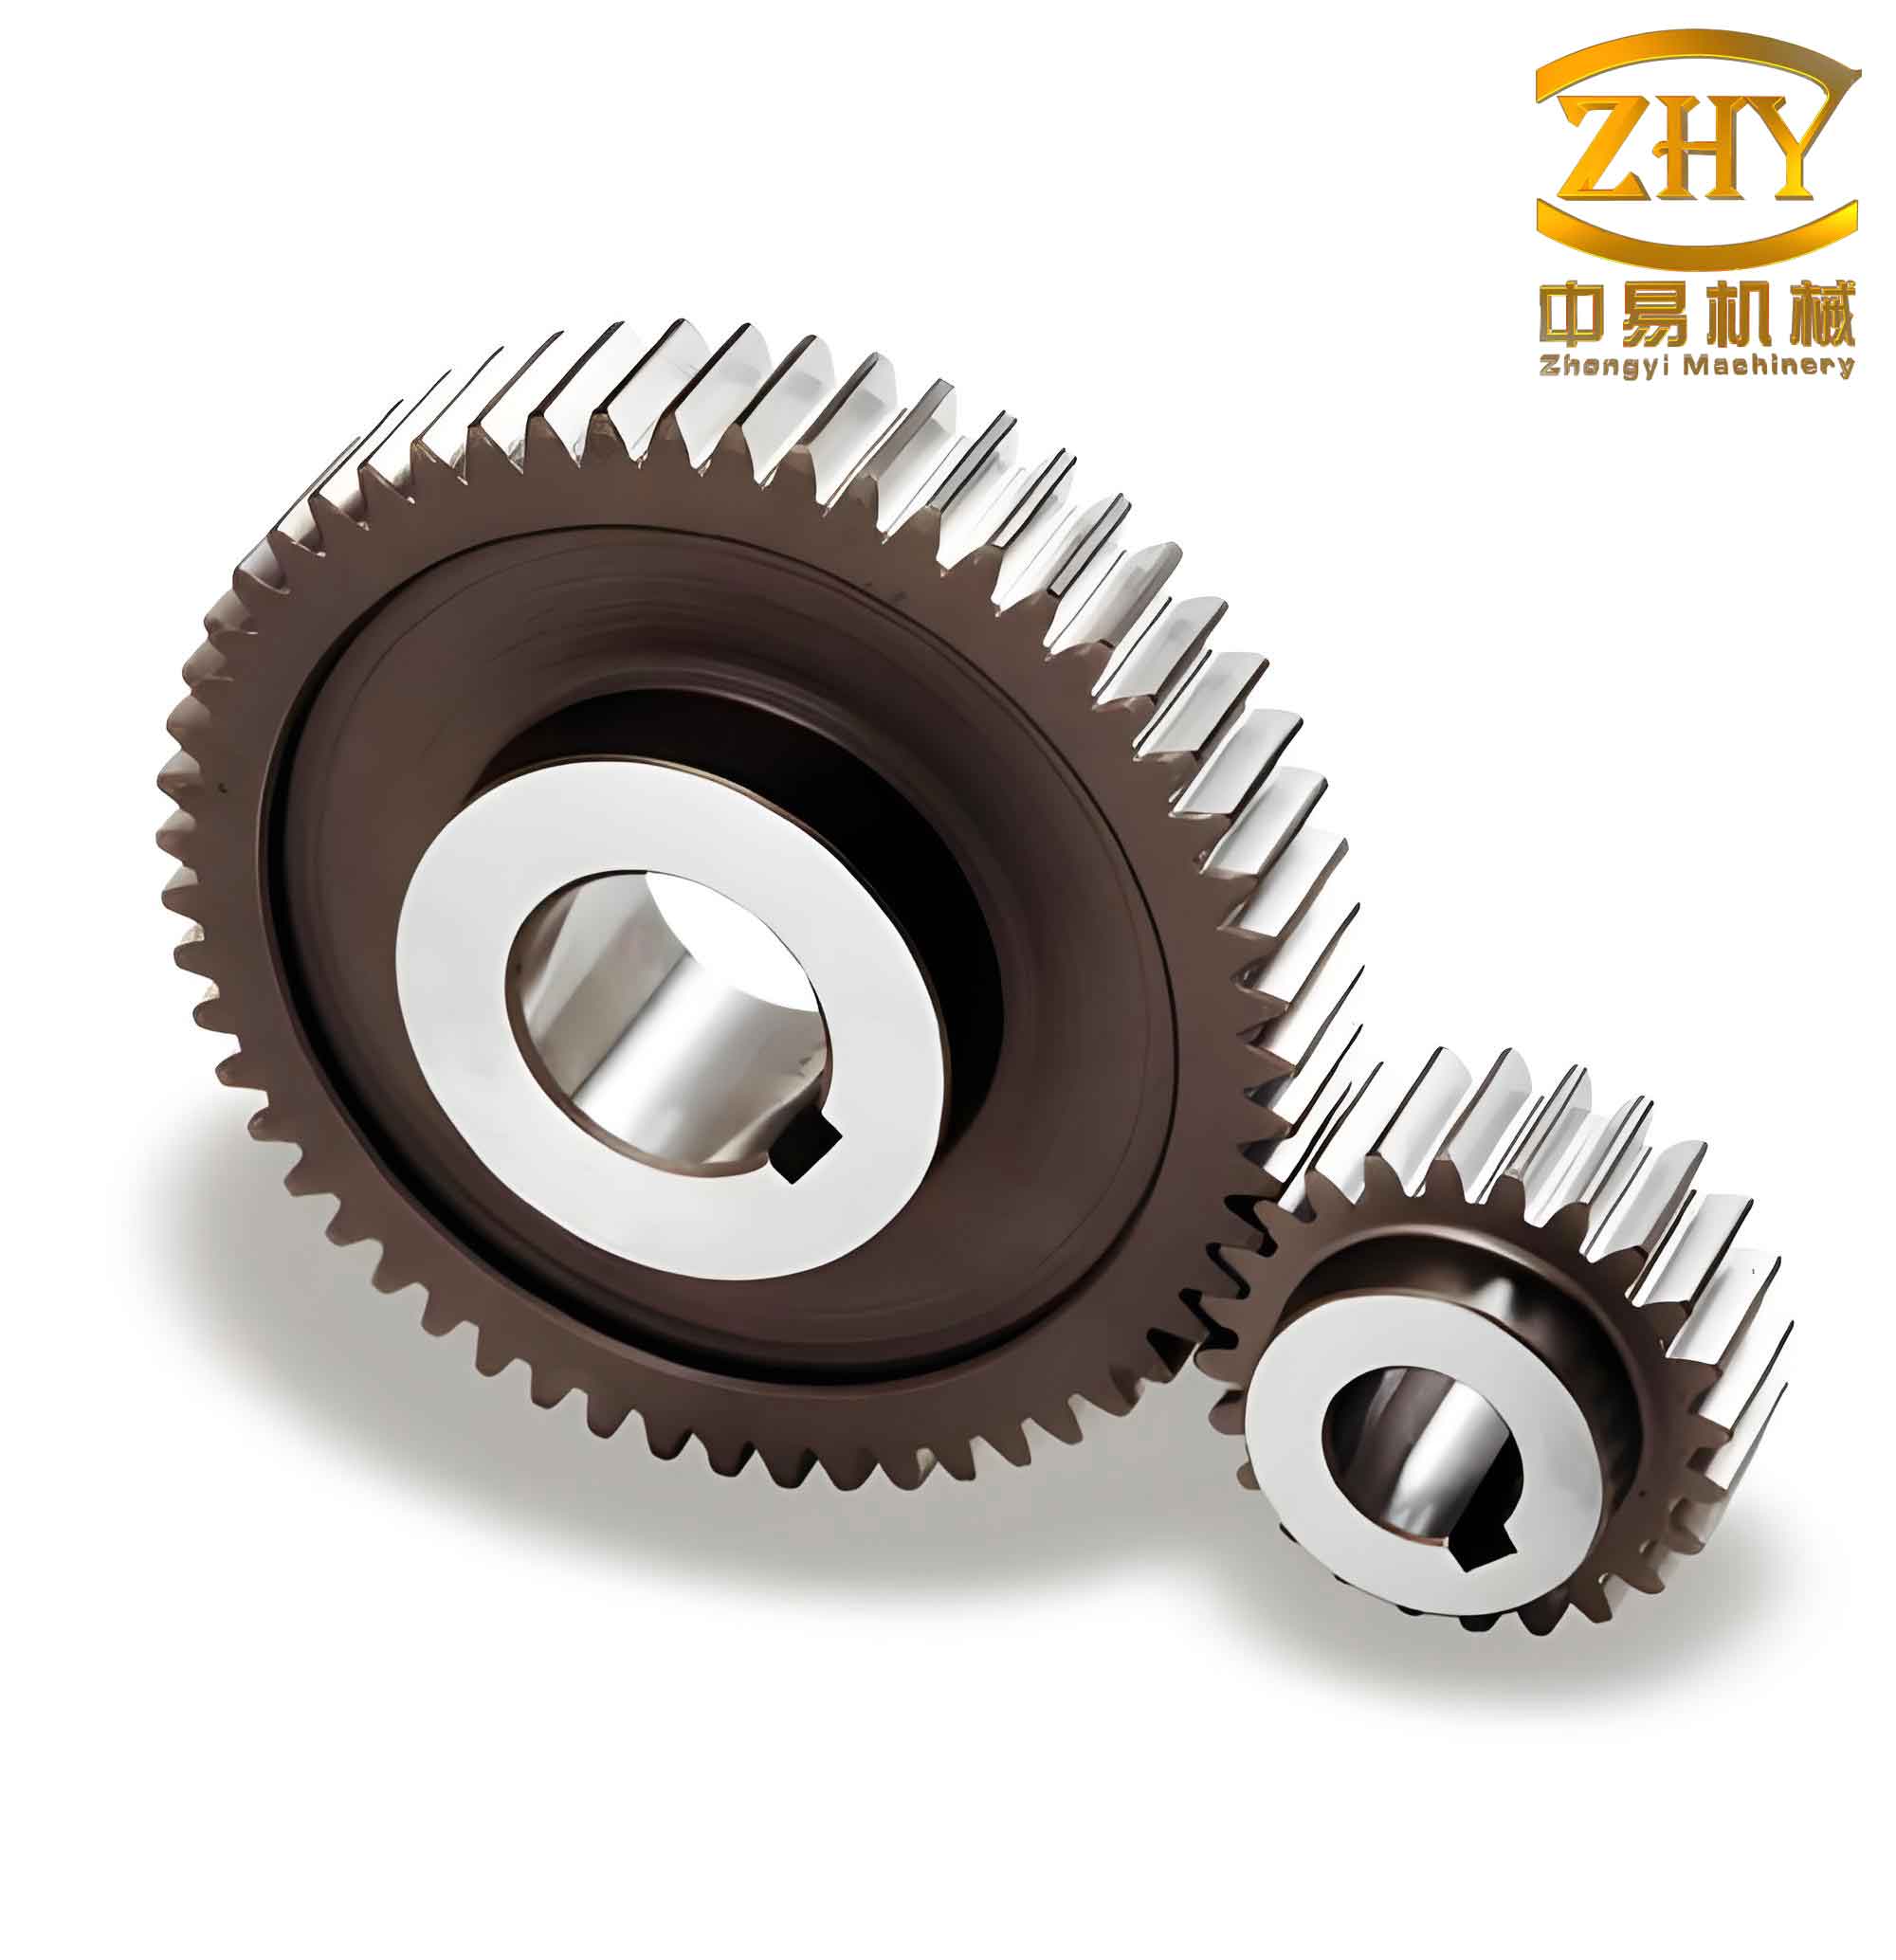
The straight spur gear pair investigated in this study consists of a small driving pinion and a larger driven gear. The basic design parameters are listed in Table 1. These parameters were chosen to represent a typical reduction gear set used in industrial applications.
| Component | Number of teeth (Z) | Module (m) [mm] | Pressure angle (α) [°] | Face width (b) [mm] |
|---|---|---|---|---|
| Driving pinion | 17 | 10 | 20 | 100 |
| Driven gear | 25 | 10 | 20 | 100 |
The theoretical transmission ratio \(i\) of this pair is:
$$i = \frac{Z_2}{Z_1} = \frac{25}{17} \approx 1.4706$$
Using SolidWorks, I created precise three‑dimensional solid models of both gears based on the involute tooth profile. The involute equation for the tooth flank can be expressed parametrically as:
$$x = r_b \left( \cos \phi + \phi \sin \phi \right) \quad ; \quad y = r_b \left( \sin \phi – \phi \cos \phi \right)$$
where \(r_b = \frac{m Z}{2} \cos \alpha\) is the base circle radius and \(\phi\) is the roll angle. After modeling each gear, I assembled them with proper center distance \(a = \frac{m}{2}(Z_1 + Z_2) = \frac{10}{2}(17+25) = 210\) mm. The solid assembly was then saved in Parasolid (*.x_t) format for import into ADAMS.
2.2 Import and Preprocessing in ADAMS
Upon importing the Parasolid file into ADAMS, I performed a model verification to check for redundant constraints or incorrect geometries. The material assigned to both gears was steel, with density \(\rho = 7800\) kg/m³, Young’s modulus \(E = 207\) GPa, and Poisson’s ratio \(\nu = 0.3\). The next step involved defining the kinematic constraints between the components. Table 2 summarizes the joints and contacts used in the virtual prototype.
| Component 1 | Component 2 | Constraint type |
|---|---|---|
| Driving pinion | Ground | Revolute joint |
| Driven gear | Ground | Revolute joint |
| Driving pinion | Driven gear | Contact (Impact force) |
The contact between the gear teeth was modeled using the ADAMS Impact function, which is based on a nonlinear spring‑damper model. The normal contact force \(F_n\) is computed as:
$$F_n = K \cdot \delta^e + C \cdot \dot{\delta}$$
where \(\delta\) is the penetration depth, \(e\) is the force exponent, \(K\) is the stiffness coefficient, and \(C\) is the damping coefficient. The parameters used for the contact model are listed in Table 3. These values were chosen to represent typical steel‑on‑steel contact with moderate damping.
| Parameter | Value | Unit |
|---|---|---|
| Stiffness (K) | 1.0e+8 | N/m |
| Force exponent (e) | 1.5 | – |
| Damping (C) | 5.0e+4 | N·s/m |
| Penetration depth | 0.1 | mm |
| Static friction coefficient | 0.08 | – |
| Dynamic friction coefficient | 0.05 | – |
| Static transition velocity | 0.01 | mm/s |
| Dynamic friction velocity | 0.1 | mm/s |
3. Dynamic Simulation Setup
To replicate realistic operating conditions, I applied a rotational motion to the driving pinion and a resistive load to the driven gear. A smooth start‑up was ensured using a STEP function to ramp up the speed and load gradually during the first second, thereby avoiding numerical instability. The driving angular velocity was set to 3000 degrees per second (500 rpm), and the load torque on the driven gear was 450 kN·mm.
The motion function for the driving pinion was defined as:
$$\omega_1(t) = \text{STEP}(\text{time}, 0, 0, 1, 3000\text{d})$$
where “3000d” denotes 3000 degrees per second. The load torque on the driven gear was defined as:
$$T_2(t) = \text{STEP}(\text{time}, 0, 0, 1, 450000) \quad \text{(unit: N·mm)}$$
The total simulation time was set to 5 seconds with 1000 steps, yielding a step size of 0.005 seconds. This resolution is sufficient to capture the dynamic effects of tooth meshing, which typically occurs at frequencies on the order of several hundred hertz for this gear pair at the given speed.
4. Simulation Results and Analysis
4.1 Angular Velocity Response
After running the simulation, I extracted the angular velocity of the driving pinion and the driven gear. The time history of the driving pinion angular velocity is shown in Figure 1 (conceptually described here). During the ramp‑up phase (0–1 s), the velocity increased linearly from zero to 3000°/s. After 1 s, it remained constant at 3000°/s with negligible fluctuation, confirming that the imposed motion was accurately followed. The driven gear’s angular velocity, displayed in Figure 2, also increased smoothly during the first second and then settled around an average value of approximately 2040°/s. Slight periodic oscillations were observed after 1 s due to the time‑varying meshing stiffness and impact effects.
The average transmission ratio was calculated from the steady‑state portion of the simulation (1–5 s):
$$\bar{\omega}_1 = 3000 \; ^\circ/\text{s} \quad ; \quad \bar{\omega}_2 \approx 2040 \; ^\circ/\text{s}$$
$$i_{\text{sim}} = \frac{\bar{\omega}_1}{\bar{\omega}_2} = \frac{3000}{2040} \approx 1.4706$$
This value matches the theoretical ratio exactly, thereby validating the kinematic correctness of the virtual prototype model. The small fluctuations in \(\omega_2\) (on the order of ±5°/s) indicate the presence of vibratory components induced by the meshing process.
4.2 Meshing Force Analysis
The dynamic contact force between the meshing teeth was computed using the Impact function. Figure 3 presents the time history of the normal contact force for a representative tooth pair. During the ramp‑up phase (0–1 s), the contact force increased gradually from zero to a peak value, exhibiting transient oscillations caused by the sudden engagement of the load. After 1 s, the force settled into a periodic pattern that repeated every tooth engagement cycle.
The period of meshing \(T_m\) for a gear pair with 17 teeth on the pinion rotating at 3000°/s is:
$$T_m = \frac{360^\circ}{Z_1 \cdot \omega_1} = \frac{360}{17 \times 3000} \approx 0.00706 \, \text{s} \approx 7.06 \, \text{ms}$$
The observed oscillation frequency of the contact force matched this meshing frequency closely, confirming that the fluctuations are directly related to the tooth engagement cycles. The amplitude of the force variation was approximately ±15% of the mean value, which is consistent with the alternating single‑pair and double‑pair contact zones. The maximum instantaneous contact force reached about 520 kN, compared to the nominal load of 450 kN, indicating a dynamic factor of about 1.15.
To further quantify the dynamic behavior, I computed the root‑mean‑square (RMS) value of the contact force over the steady‑state period:
$$F_{\text{RMS}} = \sqrt{\frac{1}{N} \sum_{i=1}^{N} F_i^2} \approx 482 \, \text{kN}$$
This value is slightly higher than the static load due to the dynamic amplification. The results highlight the importance of considering dynamic effects in gear design, especially for high‑speed applications where resonance may occur.
4.3 Influence of Gear Parameters on Dynamic Performance
To explore how design variations affect the dynamic response, I conducted additional simulations by modifying the module and the number of teeth while keeping the center distance approximately constant. Table 4 summarizes the configurations studied and their corresponding maximum contact forces and angular velocity fluctuations.
| Configuration | Z1 / Z2 | Module (mm) | Center distance (mm) | Max contact force (kN) | Angular velocity fluctuation (°/s) |
|---|---|---|---|---|---|
| Original | 17 / 25 | 10 | 210 | 520 | ±5 |
| Lower module | 21 / 31 | 8 | 208 | 540 | ±7 |
| Higher module | 13 / 19 | 12 | 192 | 495 | ±4 |
| Higher teeth count | 25 / 37 | 10 | 310 | 510 | ±6 |
The results indicate that increasing the module (coarser teeth) reduces the maximum contact force slightly, as the teeth become larger and can distribute the load over a wider area. However, it also reduces the contact ratio, which may increase the severity of load transitions. Conversely, a finer module (more, smaller teeth) leads to higher contact forces and larger velocity fluctuations, suggesting a more pronounced dynamic effect. The number of teeth also influences the meshing frequency; a higher tooth count increases the meshing frequency, which could bring the excitation closer to the system’s natural frequency.
4.4 Effect of Applied Load and Speed
I also varied the load torque and the rotational speed to study their impact on the dynamic response. Table 5 presents the results for three different load levels at the nominal speed of 3000°/s.
| Load torque (kN·mm) | Mean contact force (kN) | Peak contact force (kN) | Force fluctuation amplitude (kN) |
|---|---|---|---|
| 300 | 326 | 355 | 29 |
| 450 | 482 | 520 | 38 |
| 600 | 640 | 695 | 55 |
As the load increases, both the mean and peak contact forces increase almost linearly. The fluctuation amplitude also grows, indicating that the dynamic factor remains roughly constant (about 1.15) over this load range. Similarly, increasing the rotational speed to 6000°/s (1000 rpm) resulted in a higher meshing frequency and slightly larger force oscillations due to greater inertia effects. At 6000°/s, the peak contact force reached 545 kN for the same nominal load of 450 kN·mm, representing a dynamic factor of about 1.21.
5. Discussion
The simulation results demonstrate that ADAMS can effectively capture the dynamic behavior of straight spur gear pairs. The validated model provides a reliable basis for further studies, such as gear tooth fatigue analysis or vibration optimization. The periodic fluctuation of the meshing force is inherent to the gear geometry and cannot be completely eliminated, but it can be mitigated by modifying the tooth profile (e.g., profile shift or crowning) or by using materials with higher damping. The transmission ratio error was negligible, confirming that the virtual prototype correctly represents the kinematic relationship.
One limitation of the current model is that it assumes rigid gear bodies. In reality, gear teeth deform under load, which can alter the contact pattern and stiffness. Future work should incorporate flexible body representations using a finite element mesh (e.g., via ADAMS/Flex) to capture tooth bending and contact stress distributions more accurately. Additionally, the current contact model uses a constant stiffness coefficient, whereas actual meshing stiffness varies nonlinearly with rotation angle. Employing a more sophisticated stiffness model or importing a finite element‑based contact force could enhance the fidelity of the simulation.
Despite these simplifications, the present study provides valuable insights into the dynamic performance of straight spur gears. The tables and equations presented here serve as a reference for engineers who wish to use ADAMS for gear dynamic analysis. The key takeaway is that the meshing force is not constant but oscillates with a frequency equal to the gear mesh frequency, and the amplitude of oscillation depends on the gear geometry, load, and speed. By understanding this relationship, designers can select parameters that reduce vibration and noise, thereby improving the reliability and comfort of gear‑driven systems.
6. Conclusion
In this work, I conducted a comprehensive dynamic simulation of a straight spur gear pair using ADAMS. The main conclusions are as follows:
- The virtual prototype model was successfully validated by comparing the simulated transmission ratio (1.4706) with the theoretical value, confirming the accuracy of the gear geometry and kinematic constraints.
- The dynamic contact force exhibits a periodic variation synchronized with the gear mesh frequency. For the nominal case (17/25 teeth, module 10 mm, 3000°/s, load 450 kN·mm), the force fluctuates between approximately 450 kN and 520 kN, with an RMS value of 482 kN.
- Increasing the module (coarser teeth) reduces the peak contact force but also lowers the contact ratio, potentially increasing impact severity. Finer modules lead to higher forces and larger fluctuations.
- Higher loads and speeds amplify the dynamic effects linearly; the dynamic factor remains around 1.15–1.21 for the tested conditions.
- The periodic force fluctuation is a primary source of gear vibration and noise. Mitigation strategies should focus on profile modifications, damping treatments, or operating away from resonance frequencies.
The methodology and findings presented in this paper provide a solid foundation for further optimization of straight spur gear transmission systems. The extensive use of tables and mathematical formulas ensures that the results are both quantifiable and reproducible. Future research will extend the analysis to include flexible body dynamics and experimental validation to further refine the simulation predictions.