
As a transformative solution for future urban air mobility, flying cars demand exceptionally reliable powertrains. Gear transmission systems, serving as critical power transfer components, face unprecedented reliability challenges due to complex multi-axis loading, stringent weight constraints, and demanding mission profiles. Traditional reliability methods often neglect two crucial aspects: progressive material strength degradation under cyclic loading and intrinsic failure correlations between coupled automotive gear components. This omission introduces significant risk in predicting system lifespan. This work establishes a comprehensive dynamic reliability analysis framework integrating stress-strength interference theory, nonlinear fatigue damage accumulation, and Copula-based dependency modeling, specifically tailored for advanced flying car automotive gear transmissions.
1 System Architecture and Kinematics
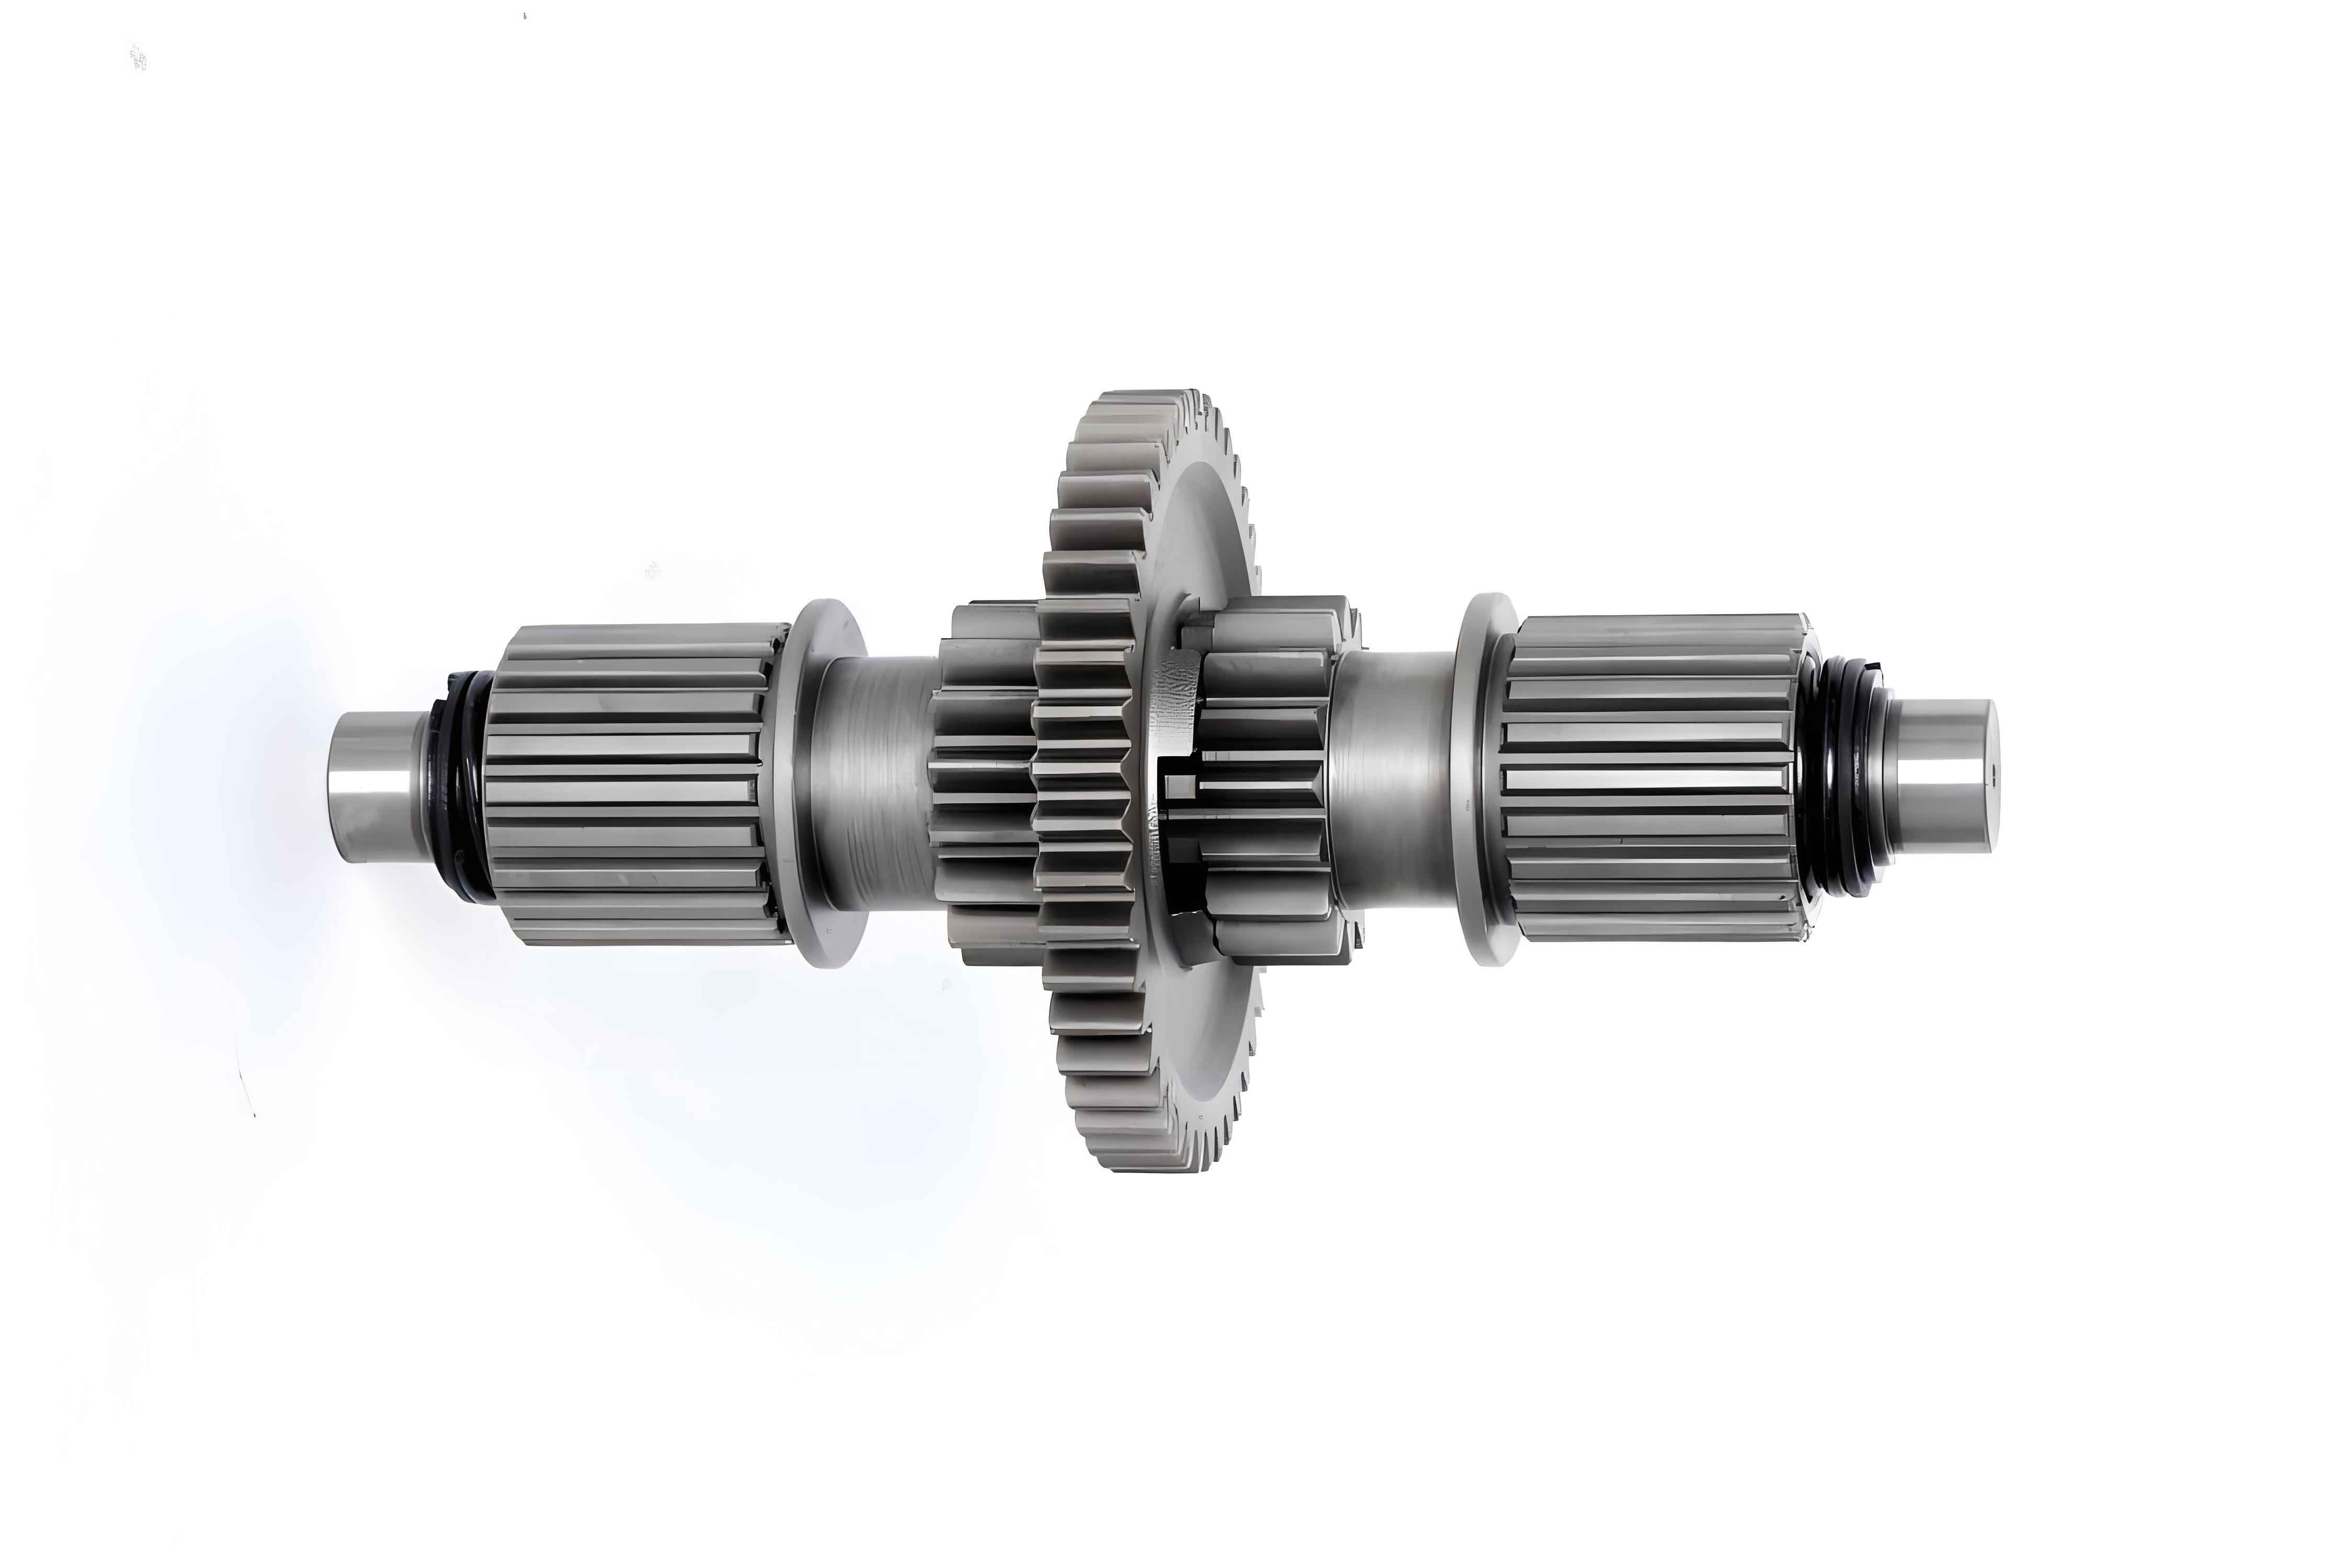
The analyzed flying car transmission comprises a compound DSI (Differential Speed Increase) planetary stage followed by two stages of spiral bevel automotive gears. Power flows from the engine into the sun gear (S), sequentially engaging idler gears (I), planet gears (P), and the ring gear (R). Output from the ring gear drives the primary bevel gear (B1), which meshes with B2. B2 is co-axially linked to B3, finally driving the output bevel gear (B4) connected to the propeller. Key parameters are listed below:
| Component | Symbol | Teeth (z) | Module (mm) | Face Width (mm) | Pressure Angle (°) | Helix Angle (°) |
|---|---|---|---|---|---|---|
| Sun Gear | S | 50 | 2.25 | 15 | 20 | – |
| Idler Gear | I | 19 | 2.25 | 15 | ||
| Planet Gear | P | 20 | 2.25 | 15 | ||
| Ring Gear | R (B1) | 101 | 2.25 | 15 | ||
| Bevel Gear 1 | B1 | 17 | 2.5 | 25 | 20 | 35 |
| Bevel Gear 2 | B2 (B3) | 43 | 2.5 | 25 | 20 | 35 |
| Bevel Gear 3 | B3 | 17 | 3.0 | 35 | 20 | 35 |
| Bevel Gear 4 | B4 | 53 | 3.0 | 35 | 20 | 35 |
Material: 9310 Steel. Kinematic relationships, considering absolute angular velocities (ω) and characteristic ratios (α1 = zR/zS, α2 = zB1/zB2, α3 = zB3/zB4, nc = number of planets), are governed by:
$$ \omega_S – (1 – \alpha_1)\omega_H – \alpha_1\omega_R = 0 $$
$$ \omega_{B1} = \omega_R, \quad \omega_{B2} = \alpha_2\omega_{B1} $$
$$ \omega_{B3} = \omega_{B2}, \quad \omega_{B4} = \alpha_3\omega_{B3} $$
This yields meshing cycles per unit time, crucial for damage accumulation calculations:
$$ N_{mesh,S} = n_c \omega_S t, \quad N_{mesh,I} = z_S \omega_S t / z_I, \quad N_{mesh,P} = z_S \omega_S t / z_P $$
$$ N_{mesh,R} = n_c \omega_S t / \alpha_1, \quad N_{mesh,B2} = \alpha_2 \omega_S t / \alpha_1, \quad N_{mesh,B4} = \alpha_2 \alpha_3 \omega_S t / \alpha_1 $$
2 Mission Profile, Load Spectrum, and Stress Analysis
Flight missions involve distinct phases: Vertical Takeoff, Climb, High-Altitude Cruise, Descent, and Vertical Landing. Each phase imposes unique torque demands on the automotive gear transmission. The resultant load spectrum defines the input torque history, forming the basis for stress calculations.
Critical failure modes are contact fatigue (pitting, spalling) and bending fatigue (root cracking). Stresses are calculated using standardized methodologies (AGMA/ISO adapted):
Planetary Gears (Contact & Bending):
$$ \sigma_H = Z_H Z_\varepsilon Z_E Z_\beta \sqrt{\frac{F_t}{b d} \frac{u + 1}{u} K_A K_V K_{H\beta} K_{H\alpha} $$
$$ \sigma_F = \frac{F_t}{b m} K_A K_V K_{F\beta} K_{F\alpha} Y_{Fa} Y_{Sa} Y_\varepsilon Y_\beta $$
Spiral Bevel Gears (Contact & Bending):
$$ \sigma_H = \frac{F_{mt}}{d_{ml} l_{bm}} \sqrt{\frac{u^2 + 1}{u}} Z_{M-B} Z_H Z_E Z_{LS} Z_\beta Z_K $$
$$ \sigma_F = \frac{F_{mt}}{b_m m_n} Y_{Fa} Y_{sa} Y_\varepsilon Y_K Y_{LS} $$
Gear loads generate pulsating stress cycles (0 to σmax). For compatibility with S-N curve-based fatigue analysis (typically defined for symmetric cycling, R = -1), the Goodman equivalent stress transformation is applied:
$$ S_i = \frac{\sigma_b S_{ai}}{\sigma_b – S_{mi}} $$
where Si is the equivalent fully reversed stress amplitude, σb is the ultimate tensile strength (1600 MPa for 9310 steel), Sai is the actual stress amplitude, and Smi is the actual mean stress. This conversion enables fatigue life prediction using standard material data.
3 Dynamic Reliability Modeling Framework
3.1 Component Reliability with Strength Degradation
Material strength degrades progressively under cyclic loading. The residual strength r(n) after n cycles is modeled using nonlinear cumulative damage theory:
$$ D = 1 – \left(1 – \frac{n}{N_f}\right)^{\frac{1}{1 – \alpha}} $$
$$ \alpha = 1 – \frac{1}{a \lg\left(\frac{\sigma_M}{\sigma_{-1}(\bar{\sigma})}\right)} $$
$$ r(n) = r(0) – [r(0) – \sigma_{\max}] D = r(0) – [r(0) – \sigma_{\max}] \left[1 – \left(1 – \frac{n}{N_f}\right)^{\frac{1}{1 – \alpha}}\right] $$
where D is the damage fraction (0 ≤ D ≤ 1), α is a material/load-dependent parameter, σM is the stress amplitude, σ̄ is the mean stress, σ-1(σ̄) is the fatigue limit for the mean stress, r(0) is the initial static fatigue strength (a random variable), σmax is the peak stress in the cycle, and Nf is the fatigue life at the applied stress level derived from the S-N curve:
$$ \sigma^m N_f = \sigma_{-1}^m N_0 = C $$
(m ≈ 13, N0 = 107 for medium steel components). Initial strengths are normally distributed: Contact – N(1500 MPa, 150 MPa), Bending – N(500 MPa, 50 MPa). Degradation maintains the distribution type and standard deviation while reducing the mean.
The time-dependent reliability R(t) for a component under multi-level stress (levels σi occurring with probability pi, Σpi=1) is given by the Stress-Strength Interference model:
$$ R(t) = \sum_{i=1}^{k} p_i \int_{\sigma_i}^{+\infty} f(r, n) dr $$
where f(r, n) is the probability density function of the residual strength after n equivalent cycles corresponding to time t.
3.2 System Reliability with Failure Correlation (Copula)
Independent failure assumption underestimates system reliability for highly coupled automotive gear systems. Within a gear pair, contact and bending failures are statistically dependent due to shared load history. Across the transmission, common cause loads induce correlation between components. Gumbel Copula, suitable for long-life systems, models this dependency.
For a single automotive gear with two dependent failure modes (Contact: X > t, Bending: Y > t):
$$ R_{\text{gear}}(t) = P(X > t, Y > t) = 1 – F_X(t) – F_Y(t) + C(F_X(t), F_Y(t); \theta) $$
$$ C(u, v; \theta) = \exp\left\{ -\left[ (-\ln u)^{1/\theta} + (-\ln v)^{1/\theta} \right]^\theta \right\} $$
where u = FX(t), v = FY(t) are the marginal failure probabilities, C is the Gumbel Copula, and θ (θ ≥ 1) is the correlation parameter (estimated via kernel density methods). Lower θ indicates stronger correlation.
For the hierarchical transmission system (Subsystems: C1-DSI Planetary, C2-First Bevel Stage, C3-Second Bevel Stage), a multi-level approach is used:
- Compute subsystem reliability considering internal dependencies (e.g., gear pairs within C1 using Copula).
- Model dependencies BETWEEN subsystems (C1, C2, C3) using another Copula function based on their joint failure behavior.
The overall system reliability Rsys(t) is computed by coupling the subsystem reliabilities via their estimated Copula parameters.
4 Results and Discussion
Analysis focused on a 3000-hour service life target. Component reliability trends (considering combined contact/bending failure correlation) are shown below. Strength degradation causes non-linear reliability decay, characterized by a slow initial decline followed by rapid reduction near end-of-life (“sudden death” behavior).
| Rank | Gear Component | Reliability (%) | Failure Rate (x10-6/hr) |
|---|---|---|---|
| 1 | Ring Gear (R/B1) | 99.82 | 0.60 |
| 2 | Bevel Gear (B2/B3) | 99.75 | 0.83 |
| 3 | Output Bevel Gear (B4) | 99.68 | 1.07 |
| 4 | Input Bevel Gear (B1) | 99.51 | 1.63 |
| 5 | Bevel Gear (B3) | 99.42 | 1.93 |
| 6 | Sun Gear (S) | 97.85 | 7.17 |
| 7 | Planet Gear (P) | 94.37 | 18.77 |
| 8 | Idler Gear (I) | 89.43 | 35.23 |
Idler (I) and Planet (P) gears exhibit the steepest reliability drop and highest failure rates due to higher stresses and meshing frequency. The Ring gear (R) shows the highest reliability. This disparity highlights non-optimal load distribution and identifies critical components for redesign. Failure rates increase monotonically over time, fitting the “wear-out” phase of the bathtub curve.
Subsystem Copula correlation parameters (θ) were: C1 (Planetary): 66.88, C2 (First Bevel): 39.39, C3 (Second Bevel): 9.26. Lower θ for downstream stages (C3) indicates stronger failure correlation induced by torque amplification and load path concentration.
| System Level | Reliability (%) | Correlation Parameter (θ) | Weakest Component Rel. (%) |
|---|---|---|---|
| Subsystem C1 (DSI Planetary) | 88.90 | 66.88 | 89.43 (Idler I) |
| Subsystem C2 (1st Bevel Stage) | 96.77 | 39.39 | 99.51 (B1) |
| Subsystem C3 (2nd Bevel Stage) | 93.81 | 9.26 | 99.42 (B3) |
| Full Transmission System (w/ Correlation) | 84.01 | – | 89.43 (Idler I) |
| Full System (Independent Assumption) | 89.43 | – | 89.43 (Idler I) |
The full system reliability (84.01%) is significantly lower than the reliability of the weakest component (89.43%) when considering failure correlation. The independent model overestimates reliability by 5.42%. The DSI Planetary stage (C1) is the system bottleneck (R=88.9% < 90%), failing to meet typical aviation automotive gear reliability targets and necessitating urgent design optimization focusing on the Idler and Planet gears.
5 Conclusions
This study developed a robust dynamic reliability framework for flying car automotive gear transmissions, integrating strength degradation and failure correlation:
- A hierarchical, Copula-based modeling strategy effectively captures the strong failure dependencies within gear pairs and across transmission subsystems driven by shared loads. Neglecting correlation (common in traditional methods) overestimates 3000-hour system reliability by 5.42%, representing a substantial risk.
- Nonlinear strength degradation models, based on cumulative fatigue damage, reveal the “sudden death” characteristic of gear reliability. Components under high stress and high meshing frequency (Idler I, Planet P) degrade fastest, becoming system bottlenecks. The DSI Planetary stage (R=88.9%) is the critical subsystem.
- The methodology provides precise component and subsystem ranking (Ring R > Bevel B2 > Bevel B4 > Bevel B1 > Bevel B3 > Sun S > Planet P > Idler I), offering clear targets for weight reduction, material enhancement, geometry optimization, or load redistribution to achieve balanced, reliable automotive gear performance.
- Future work involves integrating this reliability model into design optimization loops and validating predictions against accelerated life testing of flying car transmission prototypes. Extending the Copula approach to include lubrication degradation and misalignment effects will further enhance predictive accuracy for these safety-critical automotive gear systems.