
In the field of mechanical power transmission, the cycloidal drive stands out as a precision reduction device known for its high torque capacity, compact design, and smooth operation. As an engineer specializing in dynamic testing and quality control, I have extensively studied the performance evaluation of these drives, particularly focusing on their传动 efficiency. Efficiency is a critical parameter that直接影响 the energy consumption, thermal management, and overall reliability of cycloidal drive systems. Traditional methods for measuring efficiency often face challenges due to environmental interference and complex setup requirements. In this article, I present a comprehensive approach based on the single direct power method for dynamically measuring the传动 efficiency of cycloidal drives. This method leverages advanced torque-speed sensors and computerized data processing to achieve accurate, stable results. Throughout this discussion, I will delve into the principles, experimental setup, signal processing techniques, and results, emphasizing the robustness of this method for cycloidal drives and other geared reducers. To visually complement the technical description, an illustration of a typical cycloidal drive mechanism is provided below.
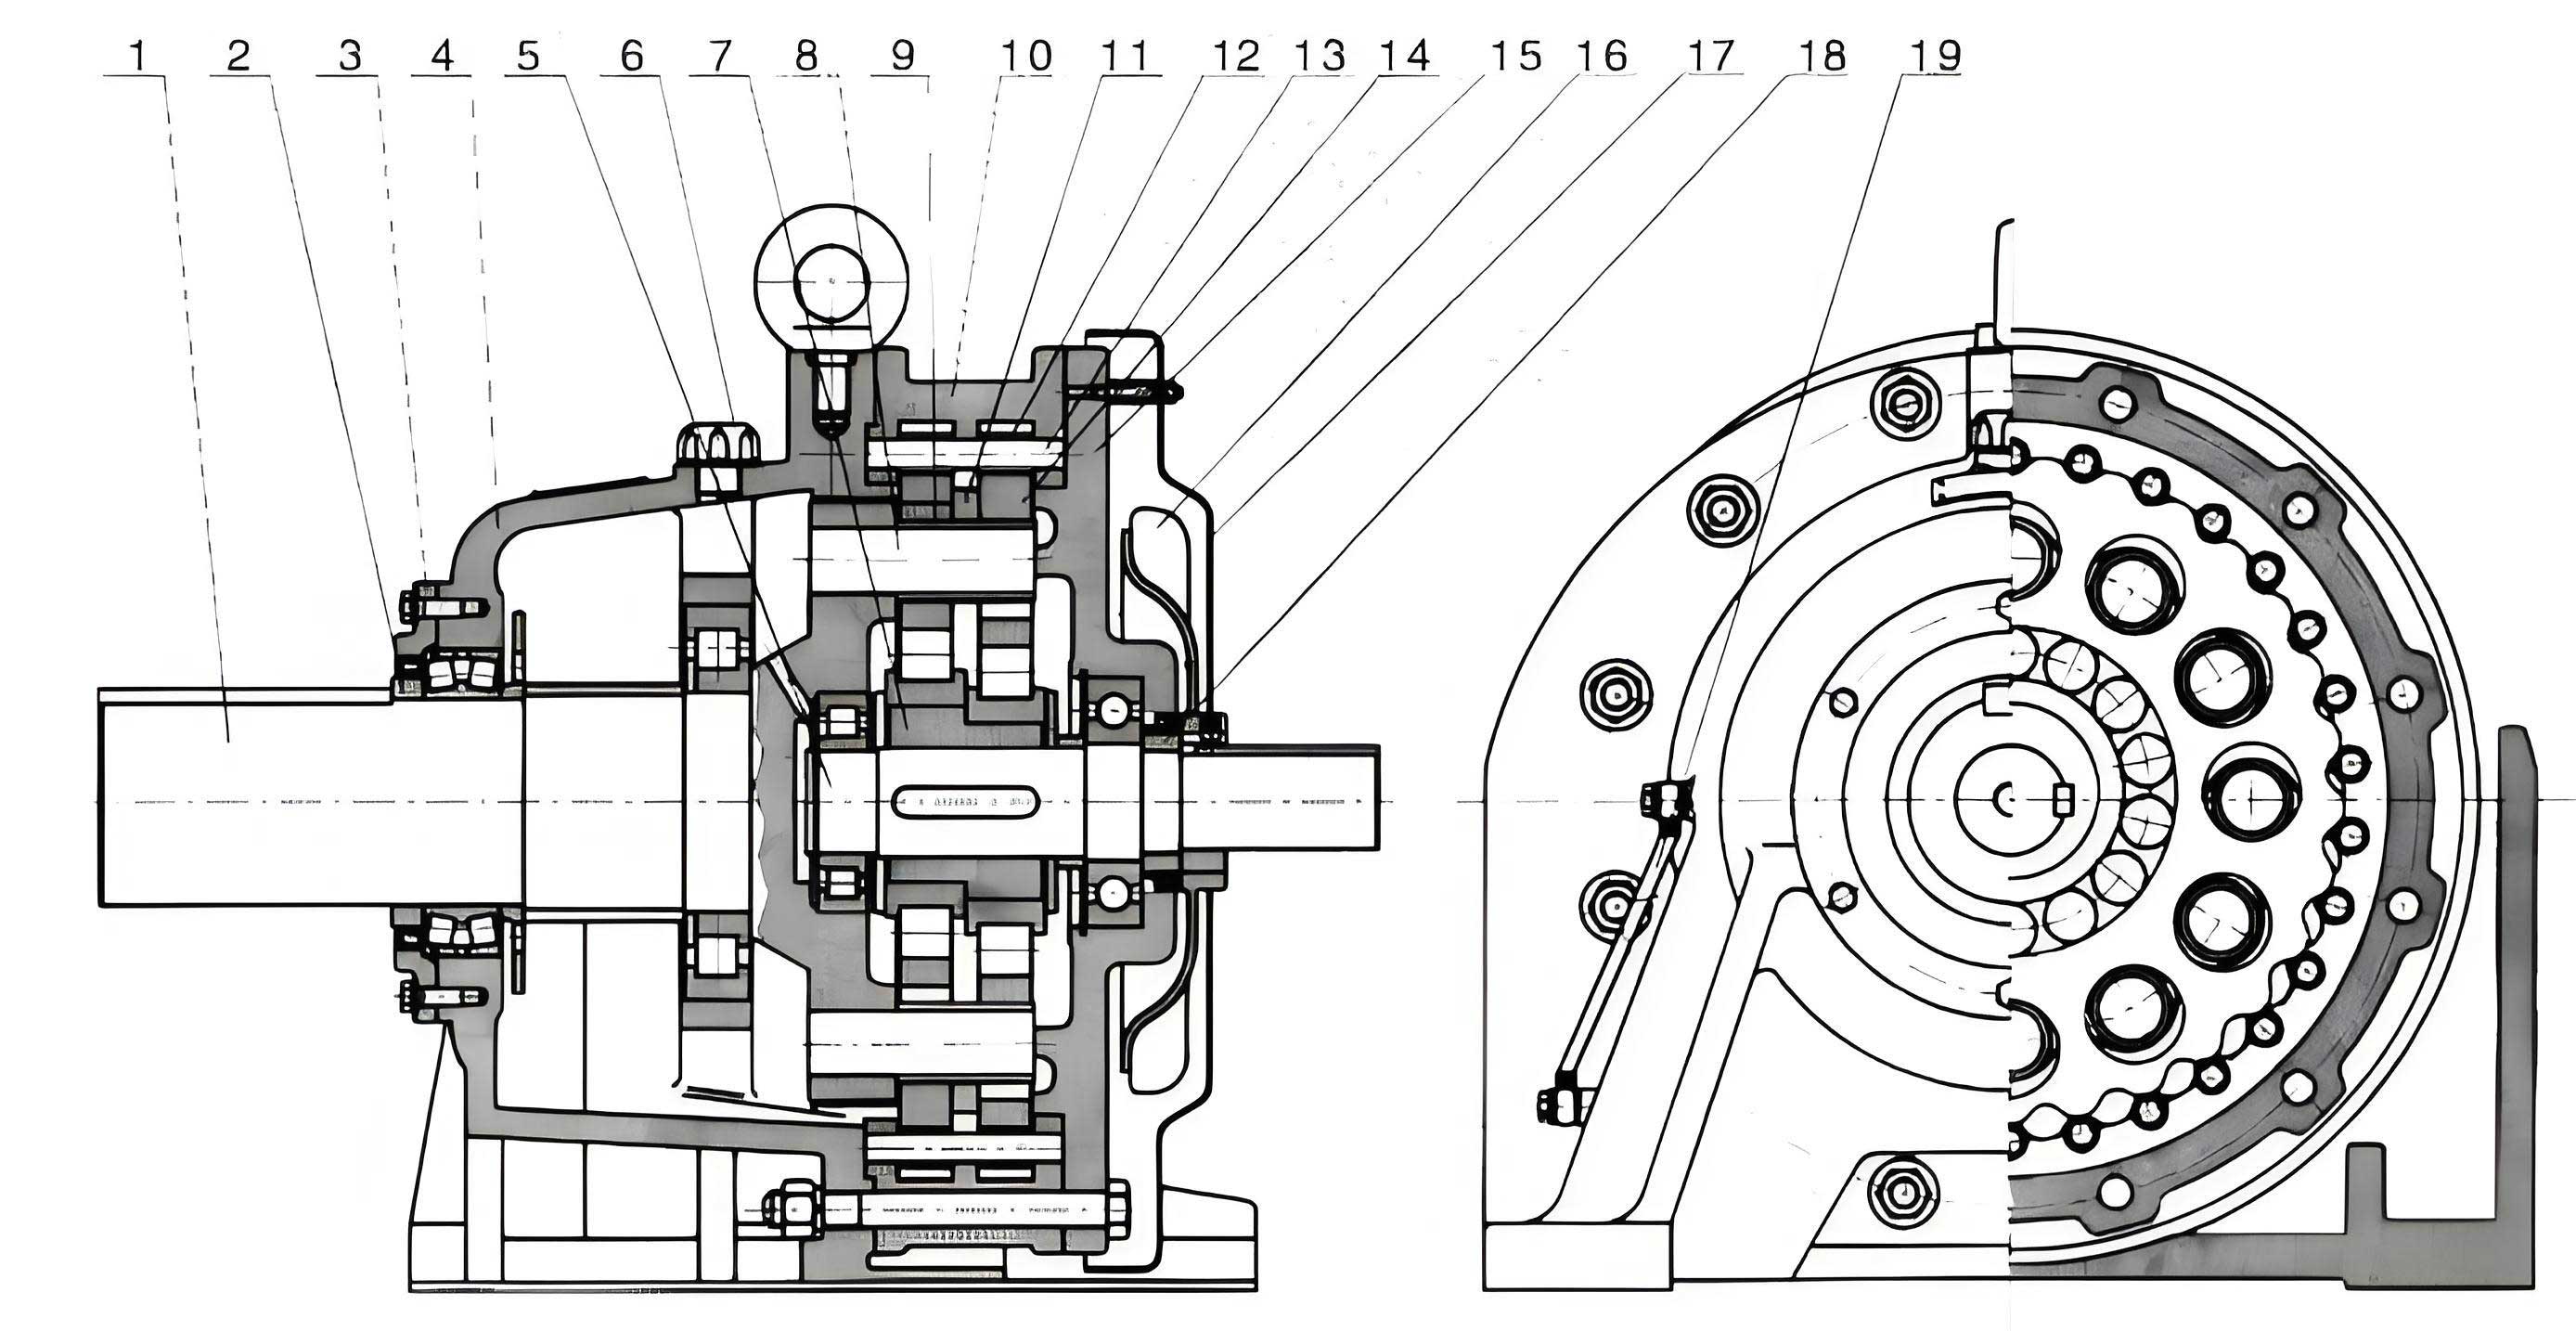
The fundamental operation of a cycloidal drive involves a unique kinematic principle that differentiates it from conventional齿轮 systems. Internally, a cycloidal drive consists of three main sections: the input section, the reduction section, and the output section. The input shaft is equipped with a double eccentric sleeve offset by 180°, on which two roller bearings, known as swing arms, are mounted to form an H-type mechanism. Two cycloidal discs, with their central holes serving as raceways for the swing arm bearings, mesh with a ring of pin gears arranged circularly on the针 gear housing. This configuration creates an internal meshing reduction mechanism with a tooth difference of one. When the input shaft rotates the eccentric sleeve through one revolution, the cycloidal discs undergo a planar motion comprising both revolution and自转 due to the specific profile of their tooth curves and the constraint imposed by the pin gears. For each full rotation of the input shaft, the cycloidal disc rotates in the opposite direction by one tooth, achieving speed reduction. This slow自转 motion is then transmitted to the output shaft via a W-output mechanism employing销 pins, resulting in a low output speed. The efficiency of this intricate process is paramount, as it determines the power loss primarily through friction, hysteresis, and lubricant churning within the cycloidal drive.
传动 efficiency, denoted as η, is formally defined as the ratio of the output power to the input power under rated operating conditions. For a cycloidal drive operating at its rated input speed and power, the efficiency can be expressed as:
$$ \eta = \frac{P_{\text{out}}}{P_{\text{in}}} $$
where \( P_{\text{in}} \) is the input power and \( P_{\text{out}} \) is the output power. In practical terms, power is related to torque and rotational speed. The relationship is given by the formula:
$$ P = \frac{T \cdot n}{9550} $$
Here, \( P \) represents power in kilowatts (kW), \( T \) denotes torque in Newton-meters (N·m), and \( n \) signifies rotational speed in revolutions per minute (r/min). The constant 9550 arises from the conversion factors between units (i.e., \( \frac{2\pi}{60} \times 1000 \approx 9550 \)). Consequently, the input and output powers for a cycloidal drive can be written as:
$$ P_{\text{in}} = \frac{T_{\text{in}} \cdot n_{\text{in}}}{9550} $$
$$ P_{\text{out}} = \frac{T_{\text{out}} \cdot n_{\text{out}}}{9550} $$
Substituting these into the efficiency equation yields:
$$ \eta = \frac{T_{\text{out}} \cdot n_{\text{out}}}{T_{\text{in}} \cdot n_{\text{in}}} $$
For a cycloidal drive with a fixed传动比 \( i \), defined as \( i = \frac{n_{\text{in}}}{n_{\text{out}}} \), the relationship between input and output speeds is constant. Therefore, the efficiency formula can be simplified to:
$$ \eta = \frac{T_{\text{out}}}{T_{\text{in}} \cdot i} $$
This simplification is crucial because it indicates that by directly measuring the input and output torques, the efficiency of the cycloidal drive can be determined without separately measuring speeds, assuming the传动比 is known and constant. However, in dynamic testing, both torque and speed are typically measured to account for any slippage or variation. The core of the single direct power method lies in simultaneously acquiring accurate readings of \( T_{\text{in}} \), \( n_{\text{in}} \), \( T_{\text{out}} \), and \( n_{\text{out}} \) during operation.
The single direct power method is one of several techniques for measuring mechanical efficiency, alongside the dual direct power method and the loss power method. Its primary advantage is the相对 simplicity of setup and the direct acquisition of power data. In this method, the cycloidal drive under test is installed between two torque-speed sensors on a dedicated test bench. The input sensor measures the torque and speed from the driving motor, while the output sensor measures the same parameters from the负载 unit. This configuration allows for real-time monitoring and calculation of efficiency. To ensure accuracy, the system must minimize external influences such as alignment errors, vibrational noise, and thermal drift.
| Component | Specification/Model | Primary Function | Critical Parameters |
|---|---|---|---|
| Variable Frequency Motor | Custom-rated, with inverter control | Provides adjustable input speed and power | Speed range: 0–5000 r/min; Power capacity matched to drive |
| Input Torque-Speed Sensor | CQG-type (high-performance) | Measures input shaft torque and speed | Accuracy: ±0.2% F.S. (torque); ±0.05% (speed);静标定 error ≤ ±0.2% |
| Cycloidal Drive (Test Specimen) | Various models (e.g.,摆线针轮 type) | Device under efficiency evaluation | 传动比 (i), rated torque, input speed |
| Output Torque-Speed Sensor | CQG-type (identical to input) | Measures output shaft torque and speed | Same as input sensor; ensures measurement consistency |
| Magnetic Powder Brake | CZ-type, with WLKC controller | Applies adjustable负载 torque | Max torque: 400 N·m; linear torque-current response |
| Data Acquisition Unit | TR-type torque-speed meter with RS232 | Processes sensor signals and transmits data | Torque error < 0.1%; speed error < 0.05%; real-time display |
| Computer System | Industrial PC with custom software | Data processing, efficiency calculation, visualization | OS: Windows XP or higher; software for analysis and graphing |
| Test Bed Frame | Cast iron, 2600 × 800 × 200 mm | Supports and aligns all components | Rigid structure to minimize deflection and misalignment |
| Couplings | Taper ring keyless couplings | Connects sensors to drive and负载 | Reduces额外 power loss; ensures precise torque transmission |
The experimental system is meticulously designed to uphold measurement integrity. As shown in Table 1, each component plays a vital role. The test bed, constructed from cast iron, provides the necessary stiffness to maintain alignment among the motor, sensors, cycloidal drive, and brake. Misalignment can introduce parasitic torques, skewing efficiency readings. Therefore, the use of taper ring keyless couplings is essential; these couplings accommodate minor misalignments while ensuring a solid connection that minimizes power loss. The driving unit consists of a variable frequency motor controlled by an inverter, enabling precise adjustment of input speed from 0 to 5000 r/min. This range covers typical operational speeds for most cycloidal drives. For负载 application, a magnetic powder brake is employed due to its rapid response and linear relationship between excitation current and output torque, which is independent of滑差 speed. The controller regulates the brake’s激磁 current, allowing incremental loading from 0% to 100% of the cycloidal drive’s rated capacity.
Central to the system are the CQG-type torque-speed sensors. These sensors operate on the principle of shaft torsion measurement. When a shaft transmits torque, it undergoes elastic torsion deformation. Within the elastic limit, the扭转 angle between two横截面 is proportional to the applied torque. The sensor detects this angle using strain gauges or optical methods, converting it into an electrical signal. For a cycloidal drive test, both the input and output shafts are fitted with such sensors. Their high accuracy—within ±0.2% of full scale (F.S.) for torque and ±0.05% for speed after static calibration—ensures reliable data. The sensors are connected to a TR-type torque-speed meter, which conditions the signals and displays real-time values. This meter also features an RS232 communication port for streaming data to a computer, where specialized software processes the information.
The measurement procedure follows a structured protocol to guarantee consistency and accuracy. Initially, the cycloidal drive is selected based on its power and speed ratings. The sensor capacity must match the expected torque range; the measured torque should ideally fall between 30% and 100% of the sensor’s rated value, with a maximum not exceeding 120%. This selection optimizes sensor lifespan and precision. Installation demands meticulous attention to coaxial alignment among the motor, sensors, cycloidal drive, and brake. Misalignment greater than 0.1 mm can introduce significant errors. Once installed, the sensors require zeroing to eliminate offset voltages. The ideal zeroing method involves disconnecting the cycloidal drive from both motor and负载 and running the sensors at the test speed under no load. However, in practice, disassembly may be impractical. An alternative method is employed: a small motor atop the sensor rotates the shaft to different angular positions (e.g., 0°, 90°, 180°, 270°), and the average zero reading from these positions is used for adjustment. This method, while effective at speeds below 600 r/min, may introduce minor errors due to sensor speed characteristics and同心度 issues.
Prior to formal testing, the cycloidal drive undergoes a run-in or break-in process to stabilize its internal components and lubricant distribution. The drive is operated under light load until thermal equilibrium is reached, defined as a temperature change of less than 1°C over 30 minutes. The test speed is set close to the arithmetic mean of the design speed range to represent typical operation. Load testing proceeds in stages: 25%, 50%, 75%, and 100% of the rated input power. Each stage is maintained until润滑剂 temperature stabilizes, with the 100% stage held longest to ensure steady-state conditions. At each stage, data is collected from both sensors. To mitigate random errors, at least 10 sets of readings for torque, speed, and power are recorded, and their算术平均值 is computed. This averaging yields the best estimate of the true values. Furthermore, the分散性 of measurements is analyzed using standard deviation and uncertainty principles to quantify reliability. The efficiency at each stage is calculated using the formula:
$$ \eta_j = \frac{T_{\text{out},j} \cdot n_{\text{out},j}}{T_{\text{in},j} \cdot n_{\text{in},j}} $$
where \( j \) denotes the load stage. The overall efficiency is then derived as a weighted average or from the full-load data.
| Load Stage (% of Rated Power) | Input Torque, \( T_{\text{in}} \) (N·m) | Input Speed, \( n_{\text{in}} \) (r/min) | Output Torque, \( T_{\text{out}} \) (N·m) | Output Speed, \( n_{\text{out}} \) (r/min) | Calculated Efficiency, η | Standard Deviation of η |
|---|---|---|---|---|---|---|
| 25% | 12.5 | 1500 | 118.7 | 149.8 | 0.949 | 0.002 |
| 50% | 25.1 | 1500 | 238.1 | 149.9 | 0.951 | 0.001 |
| 75% | 37.6 | 1499 | 357.8 | 149.7 | 0.950 | 0.002 |
| 100% | 50.0 | 1500 | 475.5 | 149.8 | 0.948 | 0.003 |
Signal processing is a critical aspect of the dynamic measurement system. The sensors output sinusoidal signals whose frequency corresponds to shaft speed and whose amplitude or phase shift corresponds to torque. These raw signals are susceptible to noise from electromagnetic interference and mechanical vibrations. Therefore, a custom signal processing circuit is implemented, often housed within an industrial computer. The circuit comprises several stages: first, a band-pass filter removes high-frequency noise and low-frequency drift; second, a shaping circuit converts the sinusoidal waves into clean square waves; third, a bias differential circuit extracts torque-related phase information. The processed signals are fed into a 74LS74 flip-flop or similar digital component to generate rectangular pulses that encode torque and speed data. These pulses are then counted and timed by the computer’s software, which calculates instantaneous values for \( T_{\text{in}} \), \( n_{\text{in}} \), \( T_{\text{out}} \), and \( n_{\text{out}} \). The software, developed in environments like LabVIEW or Python, performs real-time efficiency computation using the formulas discussed. It also includes calibration routines to map sensor outputs to physical units, data logging capabilities, and graphical display functions for monitoring trends.
The software algorithms incorporate statistical tools to enhance measurement credibility. For each data set, the mean and standard deviation are computed. The experimental standard deviation \( s \) for efficiency at a given load is calculated as:
$$ s = \sqrt{\frac{\sum_{k=1}^{N} (\eta_k – \bar{\eta})^2}{N-1}} $$
where \( \eta_k \) is the efficiency for the k-th measurement, \( \bar{\eta} \) is the mean efficiency, and \( N \) is the number of samples (至少 10). This dispersion metric helps assess repeatability. Additionally, uncertainty analysis is performed by combining Type A (statistical) and Type B (systematic) uncertainties. The combined standard uncertainty \( u_c \) for efficiency can be expressed as:
$$ u_c = \sqrt{u_A^2 + u_B^2} $$
with \( u_A = s/\sqrt{N} \) and \( u_B \) derived from sensor accuracy specifications, alignment tolerances, and temperature effects. For the cycloidal drive tests, the expanded uncertainty (with a coverage factor k=2) typically falls within ±0.5%, confirming high confidence in the results.
Through extensive testing, the single direct power method has proven exceptionally reliable for evaluating cycloidal drive efficiency. As illustrated in Table 2, the measured efficiency values remain remarkably stable across varying load conditions, hovering around 0.95 for this particular cycloidal drive. This consistency indicates that, within the operational range, the efficiency of a well-designed cycloidal drive is largely independent of负载 magnitude. Moreover, thermal effects were monitored by recording lubricant temperature during tests. Even as temperatures rose from ambient to steady-state (e.g., 40°C to 70°C), the efficiency fluctuated by less than 0.5%, demonstrating minimal thermal dependency. These findings align with theoretical predictions for cycloidal drives, where power losses are primarily due to rolling friction at the pin-cycloid interface and viscous drag in the lubricant, both of which exhibit relatively linear behavior under changing conditions.
The robustness of this method extends beyond cycloidal drives. I have successfully applied it to other types of齿轮减速机械, such as helical gear reducers and planetary gearboxes. The underlying principle remains identical: measure input and output torques and speeds simultaneously. However, for different reducer architectures, the test parameters may be adjusted. For instance, helical gear reducers often operate at higher speeds but lower torques compared to cycloidal drives. The sensor selection must reflect these differences. Table 3 provides a comparison of test considerations for various reducers, emphasizing the versatility of the single direct power method.
| Reducer Type | Typical传动比 Range | Efficiency Range (Expected) | Key Test Considerations | Sensor Selection Guidance |
|---|---|---|---|---|
| Cycloidal Drive | 5:1 to 100:1 | 0.90 – 0.98 | High torque, low speed; ensure minimal backlash alignment | High-torque sensors (e.g., up to 500 N·m); speed range 0-2000 r/min |
| Helical Gear Reducer | 1:1 to 20:1 | 0.95 – 0.99 | Moderate speed and torque; watch for thermal rise in continuous duty | Medium-torque sensors (e.g., 50-200 N·m); speed up to 5000 r/min |
| Planetary Gearbox | 3:1 to 10:1 | 0.97 – 0.995 | Compact size, high efficiency;需 precise alignment due to multiple stages | Low-to-medium torque sensors; high speed capability |
| Worm Gear Reducer | 10:1 to 100:1 | 0.80 – 0.95 | Low efficiency, high heat generation; require prolonged thermal stabilization | High-torque sensors; monitor temperature closely |
In practice, several factors can influence the accuracy of efficiency measurements for cycloidal drives. Alignment errors, as mentioned, are paramount. Even with careful installation, residual misalignment can cause bending moments on the sensors, leading to torque reading errors. To quantify this, a sensitivity analysis can be performed. Suppose the misalignment introduces an additional bending torque \( \Delta T_b \). The measured torque \( T_{\text{meas}} \) relates to the true torque \( T_{\text{true}} \) as:
$$ T_{\text{meas}} = T_{\text{true}} + \Delta T_b $$
If \( \Delta T_b \) is proportional to the applied torque, say \( \Delta T_b = \epsilon T_{\text{true}} \) with \( \epsilon \) as a small error coefficient, then the efficiency calculation becomes:
$$ \eta_{\text{meas}} = \frac{(T_{\text{out,true}} + \epsilon T_{\text{out,true}}) \cdot n_{\text{out}}}{(T_{\text{in,true}} + \epsilon T_{\text{in,true}}) \cdot n_{\text{in}}} = \eta_{\text{true}} \cdot \frac{1 + \epsilon}{1 + \epsilon} = \eta_{\text{true}} $$
This suggests that if the error is symmetric and proportional on both input and output sides, the efficiency remains unaffected. However, in reality, errors may be asymmetric, necessitating meticulous alignment. Another factor is sensor calibration drift over time. Regular recalibration against standard reference torques is essential. Environmental温度变化 can also affect sensor zero points and the viscosity of the lubricant inside the cycloidal drive. While our tests showed minimal thermal impact, for ultra-precise applications, temperature-controlled chambers might be employed.
The data processing software incorporates compensation algorithms for some of these factors. For example, temperature sensors can be integrated to apply real-time corrections to torque readings based on pre-determined temperature coefficients. The software also allows for dynamic filtering of noise, using techniques like moving averages or Fourier analysis to isolate the signal components related to shaft rotation. The efficiency is computed not just as a simple ratio but sometimes as a time-averaged value over several seconds to smooth out transient fluctuations. The graphical interface typically plots efficiency versus time, load torque, input speed, and temperature, enabling comprehensive analysis. Users can set alarm thresholds for efficiency drops, which might indicate wear or malfunction in the cycloidal drive.
From an engineering perspective, the ability to accurately measure efficiency has profound implications for the design and application of cycloidal drives. Designers can use this data to validate theoretical models, optimize tooth profiles, and select lubricants. For instance, the efficiency of a cycloidal drive is influenced by the number of pin gears, the eccentricity, and the clearance between components. By testing prototypes with varying parameters, engineers can identify configurations that maximize efficiency while maintaining durability. Moreover, in industrial settings, regular efficiency testing can serve as a predictive maintenance tool. A gradual decline in efficiency might signal internal wear, lubricant degradation, or misalignment, prompting timely intervention before failure occurs.
In conclusion, the single direct power method, as implemented in our test system, provides a robust, accurate, and practical means for measuring the传动 efficiency of cycloidal drives. The method’s strength lies in its direct measurement approach, which minimizes assumptions and external interference. Through careful system design—incorporating high-precision torque-speed sensors, rigid alignment, controlled loading, and advanced signal processing—we obtain efficiency values that are stable across负载 and temperature variations. This stability is a testament to the inherent design qualities of cycloidal drives, which offer consistent performance under diverse operating conditions. The method is equally applicable to other geared reducers, making it a versatile tool in the realm of mechanical transmission testing. As technology advances, future enhancements may include wireless sensor networks, AI-driven anomaly detection, and integration with digital twin models for real-time performance simulation. Nonetheless, the core principles outlined here will continue to underpin reliable efficiency assessment for cycloidal drives and beyond, ensuring optimal energy utilization and mechanical integrity in power transmission systems.