
When the friction coefficient is 0.3 and 0.7 respectively, the energy consumption curves of iterative steps under different initial forging temperatures are shown in Fig. 1 and Fig. 2.
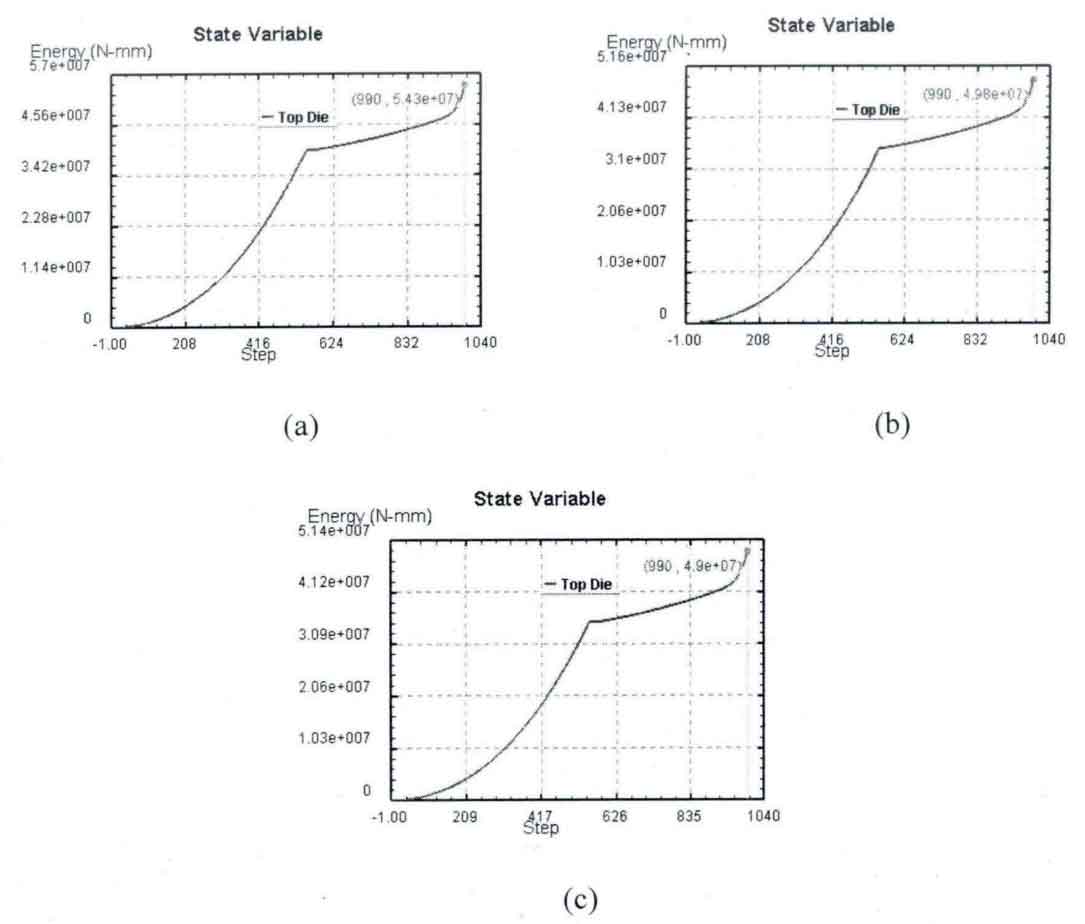
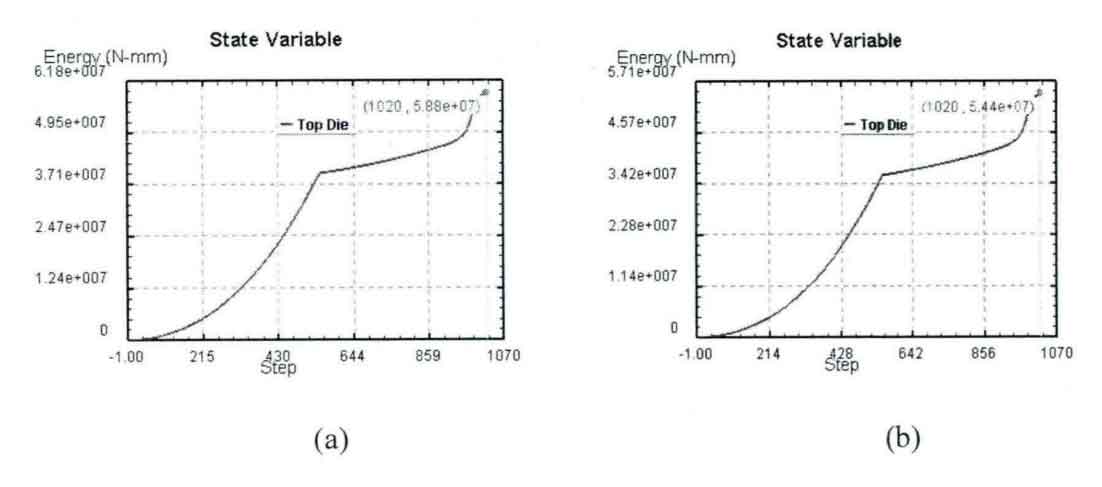
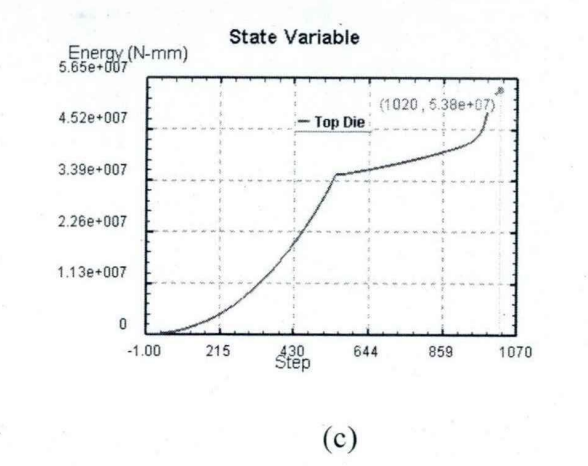
The numerical simulation results are shown in the table.
| Scheme | 1 | 2 | 3 | 4 | 5 | 6 |
| Temperature (° C) | 1000 | 1000 | 1050 | 1050 | 1100 | 1100 |
| Friction coefficient | 0.3 | 0.7 | 0.3 | 0.7 | 0.3 | 0.7 |
| Forging energy consumption (kJ) | 54.3 | 58.8 | 49.8 | 54.4 | 49 | 53.8 |
It can be seen from the above chart that in the range of 1000-1100 ° C, when the friction coefficient is the same, the lower the initial forging temperature, the greater the forging energy consumption. Moreover, the lower the temperature within 1000-1050 ° C, the faster the increase of forging energy consumption is than that within 1050-1100 ° C. When the initial forging temperature is the same, the greater the friction coefficient, the greater the forging energy consumption of spiral bevel gear.