
The pursuit of high-precision, functional components via additive manufacturing (AM) has become a central focus in modern manufacturing. Among various AM techniques, Fused Deposition Modeling (FDM) stands out due to its cost-effectiveness, material versatility, and suitability for prototyping and small-batch production. However, achieving consistent dimensional accuracy, especially for complex geometrical components like spur gears, remains a significant challenge inherent to the FDM process.
Spur gears are fundamental power transmission elements, and their geometric accuracy directly dictates the performance, efficiency, and noise characteristics of mechanical systems. The transition from traditional metal spur gears to polymer-based ones offers numerous advantages, including weight reduction, inherent lubrication, noise dampening, and corrosion resistance. FDM presents an ideal route for the rapid, customized fabrication of such polymer spur gears. Yet, the very nature of FDM—involving the thermal cycling of thermoplastic filaments—introduces distortions. Residual stresses from uneven cooling and material shrinkage lead to deviations such as warping, curling, and dimensional inaccuracies, which are critically detrimental to the functional geometry of spur gears, affecting tooth profile and meshing characteristics.
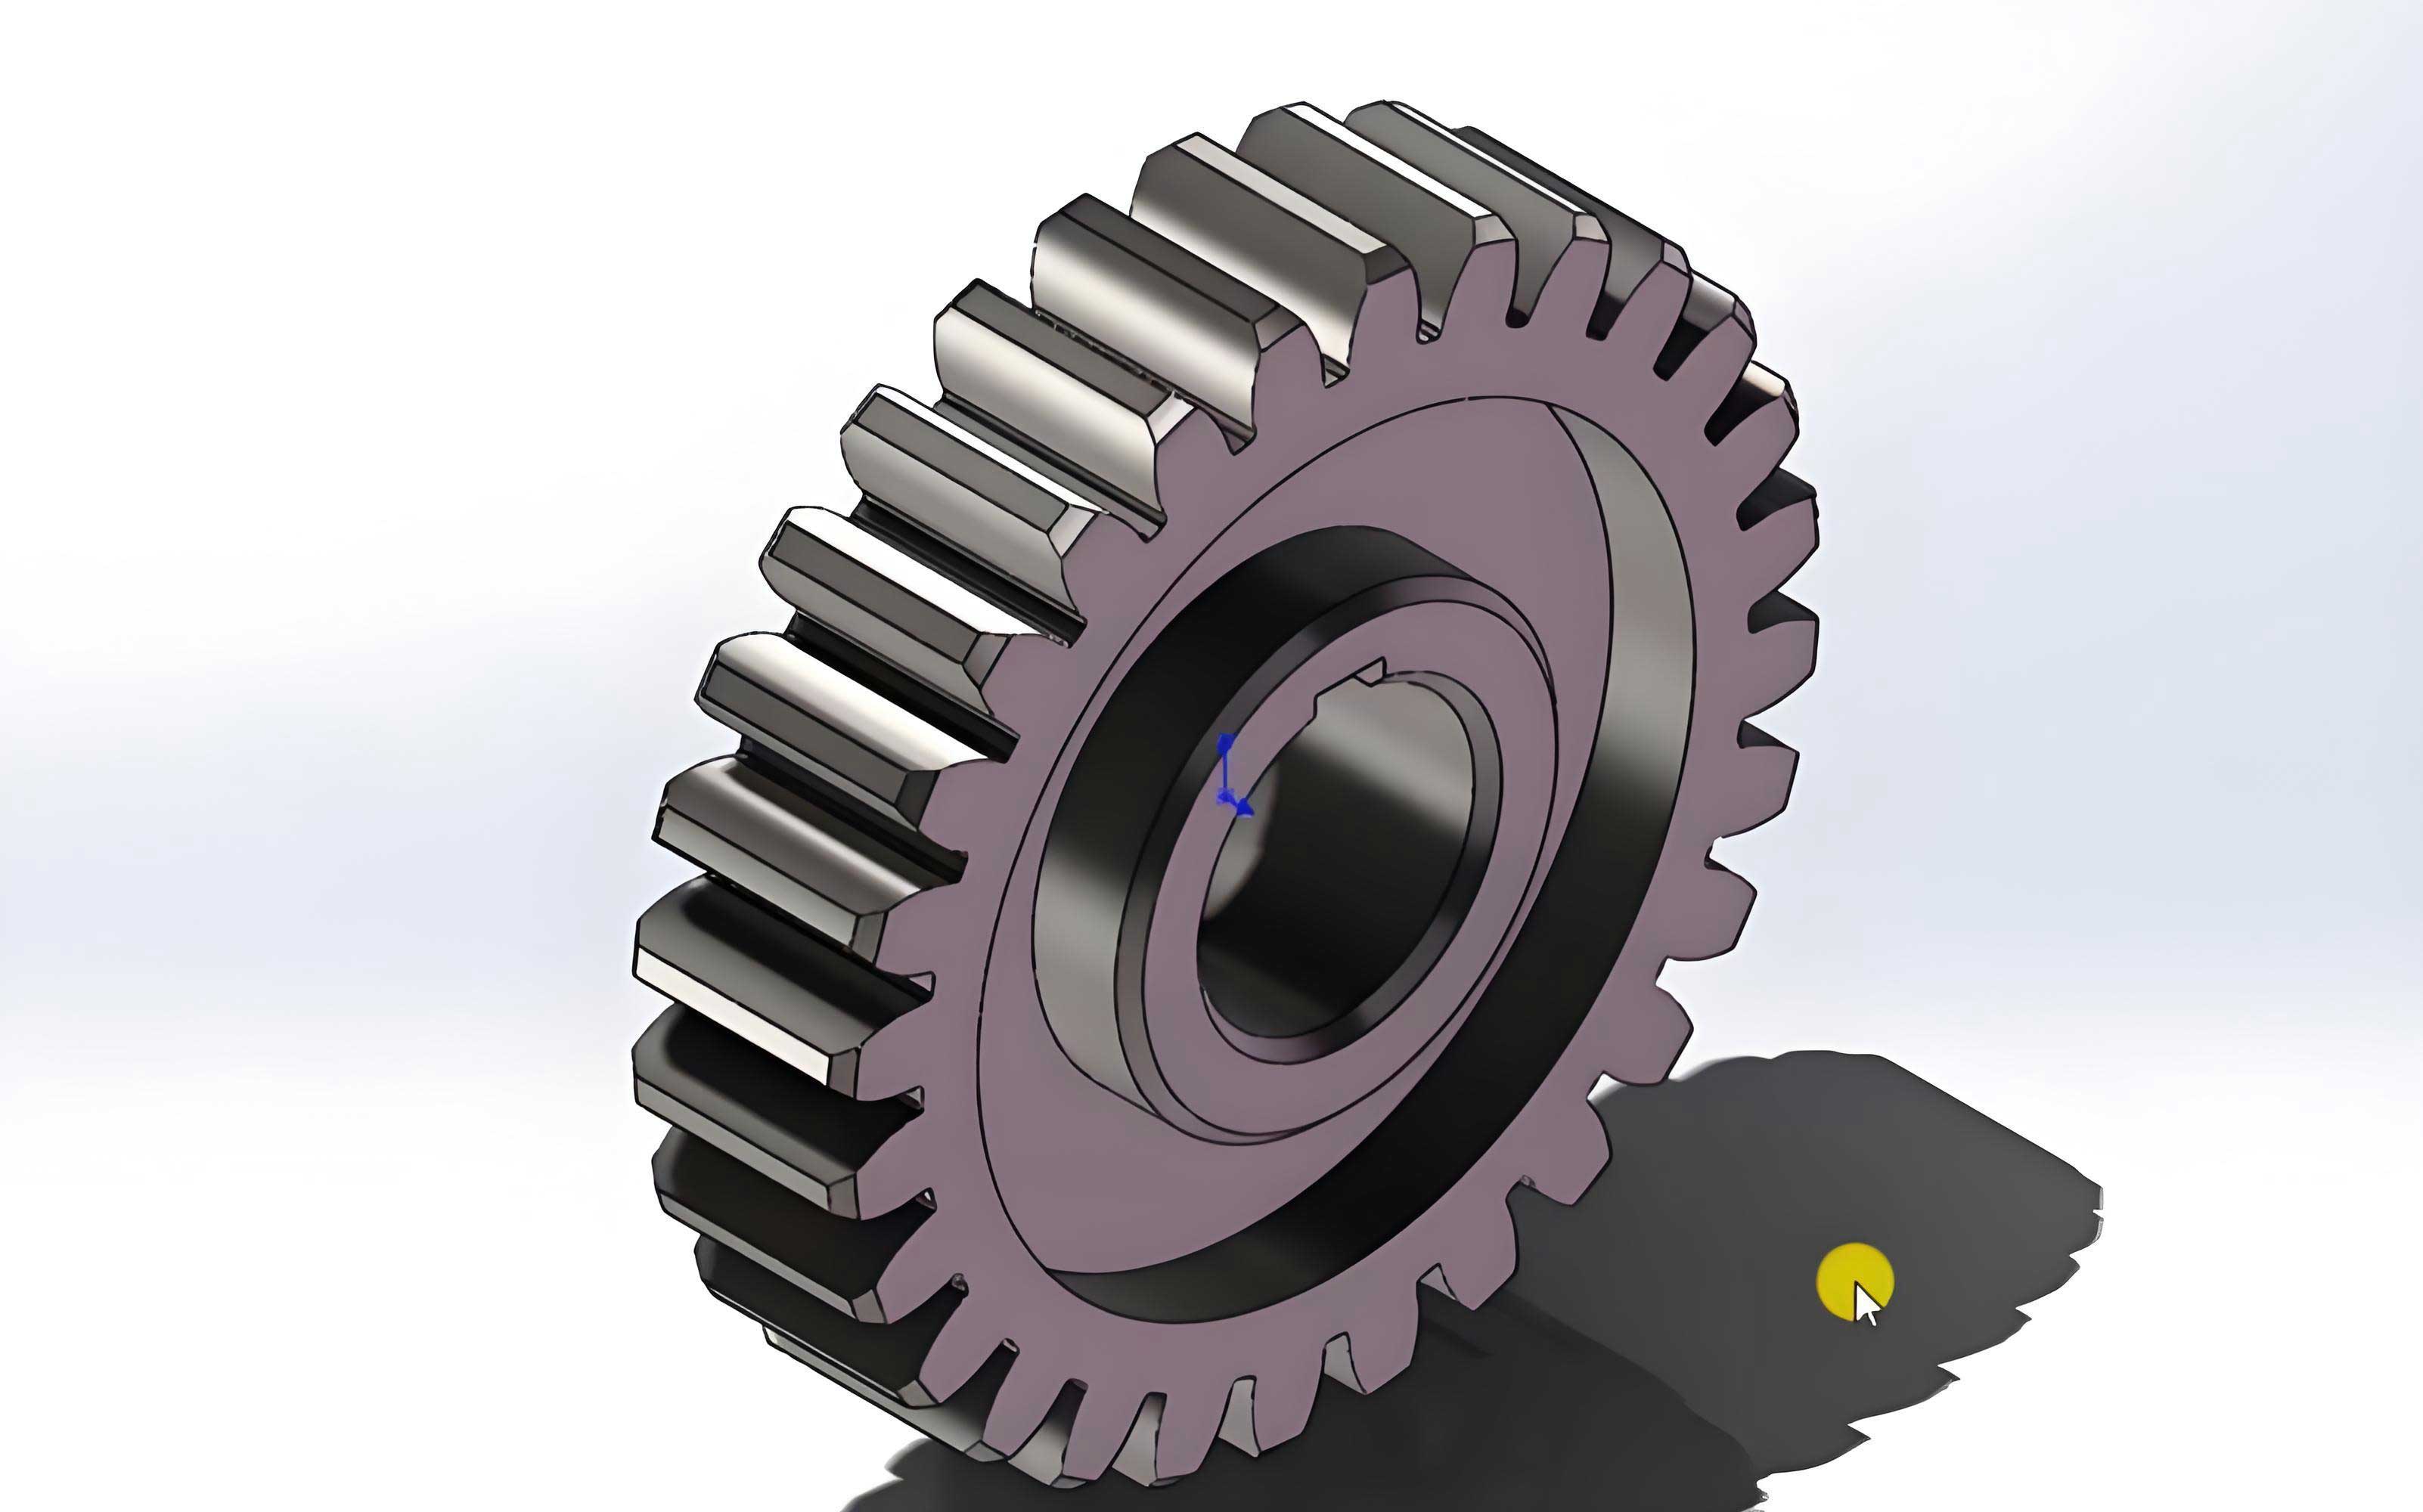
While substantial research has been conducted on optimizing FDM parameters for simple geometries like cubes and cylinders, a systematic investigation targeting the nuanced dimensional fidelity of intricate components like spur gears is less common. This study aims to bridge this gap. We present a comprehensive experimental analysis focused on quantifying the dimensional deviations of FDM-fabricated ABS spur gears and establishing optimal process parameters to minimize these deviations. The core of this investigation utilizes a Design of Experiments (DoE) approach, specifically orthogonal arrays, to efficiently analyze the effects of key printing parameters. Furthermore, advanced metrology techniques, including 3D scanning and dedicated gear measurement instruments, are employed to accurately capture both global and feature-specific deviations on the printed spur gears.
1. Methodology: Gear Design, Fabrication, and Measurement
1.1 Gear Model and Material
The test specimen was a standard involute spur gear designed with the following key parameters:
- Number of Teeth (z): 18
- Module (m): 2 mm
- Pitch Diameter (d): 36 mm
- Addendum Diameter (d_a): 40 mm
- Face Width (b): 8 mm
- Bore Diameter: 24 mm with a keyway
The material selected for this study was Acrylonitrile Butadiene Styrene (ABS) filament with a diameter of 1.75 mm. ABS was chosen for its common use in FDM, good mechanical properties, and pronounced thermal deformation characteristics, making it a suitable candidate for studying process-induced deviations.
1.2 Selection of Process Parameters and Orthogonal Experimental Design
Based on a review of literature and preliminary tests, four critical FDM process parameters were identified as control variables: Nozzle Temperature (A), Bed Temperature (B), Printing Speed (C), and Layer Thickness (D). Each parameter was investigated at three levels. A standard L9(3^4) orthogonal array was employed, which requires only 9 experimental runs to study the effects of four 3-level factors, providing a highly efficient screening methodology. The parameter levels and the experimental layout are detailed in the tables below.
| Factor Code | Process Parameter | Level 1 | Level 2 | Level 3 |
|---|---|---|---|---|
| A | Nozzle Temperature | 225 °C | 230 °C | 235 °C |
| B | Bed Temperature | 87 °C | 90 °C | 93 °C |
| C | Printing Speed | 40 mm/s | 50 mm/s | 60 mm/s |
| D | Layer Thickness | 0.1 mm | 0.2 mm | 0.3 mm |
| Experiment No. | Nozzle Temp. (A) | Bed Temp. (B) | Print Speed (C) | Layer Thickness (D) |
|---|---|---|---|---|
| 1 | 225 °C (1) | 87 °C (1) | 40 mm/s (1) | 0.1 mm (1) |
| 2 | 225 °C (1) | 90 °C (2) | 50 mm/s (2) | 0.2 mm (2) |
| 3 | 225 °C (1) | 93 °C (3) | 60 mm/s (3) | 0.3 mm (3) |
| 4 | 230 °C (2) | 87 °C (1) | 50 mm/s (2) | 0.3 mm (3) |
| 5 | 230 °C (2) | 90 °C (2) | 60 mm/s (3) | 0.1 mm (1) |
| 6 | 230 °C (2) | 93 °C (3) | 40 mm/s (1) | 0.2 mm (2) |
| 7 | 235 °C (3) | 87 °C (1) | 60 mm/s (3) | 0.2 mm (2) |
| 8 | 235 °C (3) | 90 °C (2) | 40 mm/s (1) | 0.3 mm (3) |
| 9 | 235 °C (3) | 93 °C (3) | 50 mm/s (2) | 0.1 mm (1) |
All other printing parameters (e.g., infill density 100%, rectilinear pattern, no cooling fan) were kept constant across all experiments to isolate the effects of the four chosen variables. Nine ABS spur gears were fabricated according to the above design matrix.
1.3 Dimensional Deviation Measurement Techniques
Accurate quantification of deviations on the complex geometry of spur gears necessitates advanced metrology. Two complementary techniques were used:
1.3.1 3D Scanning for Comprehensive Geometric Analysis: A structured-light 3D scanner was used to digitize each printed spur gear. Both the front and back faces were scanned separately, and the resulting point clouds were aligned and merged to create a complete 3D model of the physical part. This digital model was then imported into metrology software and aligned with the original CAD design model using a best-fit algorithm. This comparison generates a full-field deviation map, visually and quantitatively showing where the printed gear is larger (positive deviation) or smaller (negative deviation) than the nominal design. This method is crucial for analyzing complex deviations like warpage and overall tooth profile errors.
1.3.2 Specialized Gear Metrology: To obtain standardized, quantitative measures of gear accuracy, two key indices were measured using dedicated instruments:
- Total Profile Deviation (Fα): This is a critical index for spur gears, representing the maximum range of deviation of the actual tooth flank from the theoretical involute profile over the evaluation range. From the 3D scan comparison data, the tooth with the largest visual deviation on each gear was identified. Profile deviation values were extracted at multiple equidistant points along the left and right flanks of this tooth at the mid-face width location. The total profile deviation for each flank was calculated as:
$$F_{\alpha} = \max(\Delta_{profile}) – \min(\Delta_{profile})$$
where $\Delta_{profile}$ represents the set of deviation values at the measured points. The average of the left and right flank $F_α$ values was taken as the representative total profile deviation for that gear specimen. - Pitch Deviation (fpt): This measures the positional accuracy of adjacent teeth. A manual pitch measuring instrument was used. An arbitrary pitch was set as the datum (zero). The instrument was then used to measure the deviation of other pitches relative to this datum. Multiple pitches were measured around the gear’s circumference, and the average absolute value of these deviations was calculated as the representative single pitch deviation for the gear.
2. Results and Analysis of Dimensional Deviations
2.1 Global Deformation Characteristics of Printed Spur Gears
The 3D scan comparison revealed consistent global deformation patterns across all printed spur gears, albeit with varying magnitudes depending on the process parameters. The primary deformation modes observed were:
- Internal Feature Shrinkage: The bore (center hole) and the keyway consistently exhibited negative deviations, meaning they were printed smaller than designed. This is a classic manifestation of polymer shrinkage upon cooling, where internal features constrained by surrounding material tend to contract inwards.
- Tooth Flank Expansion and Tip Shrinkage: A distinctive pattern was observed on the tooth profiles. The region near the tooth root (the flank closer to the base circle) typically showed positive deviation (material addition). In contrast, the region near the tooth tip consistently showed negative deviation (material loss or shrinkage). This creates a characteristic “U-shaped” deviation curve across the tooth profile height.
- Face Warpage: Significant negative deviation (warpage) was observed on the bottom face of the gear (the face in contact with the build platform), particularly at the outer edges and tooth tips. This is caused by residual thermal stresses; as the bottom layers cool and contract, they are constrained by adhesion to the build plate, leading to upward curling at the edges.
These deformation patterns highlight the complex interplay of thermal stress, material solidification, and path planning inherent in FDM, which directly compromises the critical functional surfaces of the spur gears.
2.2 Quantitative Measurement Results
The measured values for Total Profile Deviation ($F_α$) and Average Pitch Deviation ($f_{pt}$) for all nine experimental runs are summarized in the tables below. These quantitative results form the basis for the subsequent statistical analysis and optimization.
| Experiment No. | Left Flank Fα (mm) | Right Flank Fα (mm) | Average Fα (mm) |
|---|---|---|---|
| 1 | 0.198 | 0.166 | 0.182 |
| 2 | 0.226 | 0.277 | 0.252 |
| 3 | 0.355 | 0.364 | 0.360 |
| 4 | 0.249 | 0.304 | 0.277 |
| 5 | 0.281 | 0.198 | 0.240 |
| 6 | 0.228 | 0.275 | 0.252 |
| 7 | 0.358 | 0.222 | 0.290 |
| 8 | 0.186 | 0.213 | 0.200 |
| 9 | 0.166 | 0.151 | 0.159 |
| Experiment No. | fpt Measurement 1 (mm) | fpt Measurement 2 (mm) | fpt Measurement 3 (mm) | fpt Measurement 4 (mm) | fpt Measurement 5 (mm) | Average fpt (mm) |
|---|---|---|---|---|---|---|
| 1 | 0.026 | 0.024 | 0.022 | 0.030 | 0.025 | 0.025 |
| 2 | 0.025 | 0.036 | 0.025 | 0.034 | 0.032 | 0.030 |
| 3 | 0.028 | 0.035 | 0.042 | 0.038 | 0.030 | 0.035 |
| 4 | 0.025 | 0.024 | 0.035 | 0.032 | 0.026 | 0.028 |
| 5 | 0.030 | 0.020 | 0.025 | 0.021 | 0.029 | 0.025 |
| 6 | 0.025 | 0.029 | 0.028 | 0.033 | 0.025 | 0.028 |
| 7 | 0.032 | 0.028 | 0.029 | 0.038 | 0.028 | 0.031 |
| 8 | 0.045 | 0.035 | 0.038 | 0.030 | 0.036 | 0.037 |
| 9 | 0.026 | 0.032 | 0.022 | 0.026 | 0.030 | 0.027 |
3. Multi-Objective Optimization of Process Parameters
The goal is to find a single set of FDM parameters (A, B, C, D) that simultaneously minimizes both the Total Profile Deviation ($F_α$) and the Pitch Deviation ($f_{pt}$) for the printed spur gears. We employ Range Analysis (also known as the Taguchi method’s signal-to-noise ratio analog for “smaller-is-better”) followed by a Comprehensive Balancing Method to reconcile the potentially conflicting optimal conditions for each individual response.
3.1 Range Analysis for Individual Responses
For each response ($F_α$ and $f_{pt}$), a range analysis is performed. For each factor at each level, the sum ($K_i$) and mean ($k_i$) of the response values are calculated. The range ($R$) for a factor is the difference between its maximum and minimum $k_i$ values. A larger $R$ indicates the factor has a stronger influence on that particular response. The optimal level for a factor for a given response is the one with the smallest $k_i$ value (since the objective is minimization).
The calculations for Total Profile Deviation ($F_α$) are as follows, where $K_{Aj}$ represents the sum of $F_α$ for all experiments where factor A is at level j:
$$K_{A1} = F_{α1} + F_{α2} + F_{α3} = 0.182 + 0.252 + 0.360 = 0.794$$
$$K_{A2} = F_{α4} + F_{α5} + F_{α6} = 0.277 + 0.240 + 0.252 = 0.769$$
$$K_{A3} = F_{α7} + F_{α8} + F_{α9} = 0.290 + 0.200 + 0.159 = 0.649$$
$$k_{A1} = K_{A1} / 3 = 0.265, \quad k_{A2} = 0.256, \quad k_{A3} = 0.216$$
$$R_A = \max(k_{Ai}) – \min(k_{Ai}) = 0.265 – 0.216 = 0.049$$
Similar calculations are performed for all factors and for both responses. The consolidated results of the range analysis are presented below.
| Factor | Level 1 (k1) | Level 2 (k2) | Level 3 (k3) | Range (R) | Optimal Level | Rank of Influence |
|---|---|---|---|---|---|---|
| Nozzle Temp. (A) | 0.265 | 0.256 | 0.216 | 0.049 | A3 (235°C) | 3 |
| Bed Temp. (B) | 0.250 | 0.231 | 0.257 | 0.026 | B2 (90°C) | 4 |
| Print Speed (C) | 0.211 | 0.229 | 0.297 | 0.086 | C1 (40 mm/s) | 1 |
| Layer Thickness (D) | 0.194 | 0.265 | 0.279 | 0.085 | D1 (0.1 mm) | 2 |
Interpretation for Fα: Printing Speed (C) has the greatest influence on the tooth profile accuracy of spur gears, followed closely by Layer Thickness (D). The optimal single-response parameter set for minimizing profile deviation is A3B2C1D1 (Nozzle: 235°C, Bed: 90°C, Speed: 40 mm/s, Layer: 0.1 mm).
| Factor | Level 1 (k1) | Level 2 (k2) | Level 3 (k3) | Range (R) | Optimal Level | Rank of Influence |
|---|---|---|---|---|---|---|
| Nozzle Temp. (A) | 0.030 | 0.027 | 0.032 | 0.005 | A2 (230°C) | 2 |
| Bed Temp. (B) | 0.028 | 0.031 | 0.030 | 0.003 | B1 (87°C) | 3 |
| Print Speed (C) | 0.030 | 0.028 | 0.030 | 0.002 | C2 (50 mm/s) | 4 |
| Layer Thickness (D) | 0.026 | 0.030 | 0.033 | 0.007 | D1 (0.1 mm) | 1 |
Interpretation for fpt: Layer Thickness (D) is the most influential factor for pitch accuracy in spur gears, followed by Nozzle Temperature (A). The optimal single-response parameter set for minimizing pitch deviation is A2B1C2D1 (Nozzle: 230°C, Bed: 87°C, Speed: 50 mm/s, Layer: 0.1 mm).
3.2 Comprehensive Balancing for Multi-Objective Optimization
The single-response optima are conflicting: they disagree on the optimal levels for Nozzle Temperature (A), Bed Temperature (B), and Printing Speed (C). Only Layer Thickness (D) unanimously favors level 1 (0.1 mm). To resolve this, we apply a comprehensive balancing method, analyzing the main effect plots and considering the relative influence (rank) of each factor on both responses.
- Nozzle Temperature (A): For $F_α$, A3 is best; for $f_{pt}$, A2 is best. $R_A$ is larger for $F_α$ (0.049) than for $f_{pt}$ (0.005), indicating A has a much stronger influence on profile deviation. However, within the $f_{pt}$ analysis, A is ranked second in importance. A balanced choice is the level that gives good performance for both: A2 (230°C) offers the lowest $f_{pt}$ and a nearly as good $F_α$ as A3, making it the robust choice.
- Bed Temperature (B): For $F_α$, B2 is best; for $f_{pt}$, B1 is best. The influence of B is relatively low for both responses (rank 4 for $F_α$, rank 3 for $f_{pt}$). The $f_{pt}$ value is minimized at B1, while $F_α$ at B1 is only slightly higher than at B2. Therefore, B1 (87°C) is selected.
- Printing Speed (C): For $F_α$, C1 is best; for $f_{pt}$, C2 is best. This is a critical factor as it has the strongest influence on $F_α$ (rank 1) but the weakest on $f_{pt}$ (rank 4). Therefore, the priority should be given to minimizing $F_α$, which is crucial for the functional meshing of spur gears. Thus, C1 (40 mm/s) is selected.
- Layer Thickness (D): Unanimously D1 (0.1 mm) is optimal for minimizing both deviations in spur gears.
Through this comprehensive analysis, the final multi-objective optimal parameter combination for fabricating accurate ABS spur gears via FDM is determined to be: A2B1C1D1, which corresponds to:
- Nozzle Temperature: 230 °C
- Bed Temperature: 87 °C
- Printing Speed: 40 mm/s
- Layer Thickness: 0.1 mm
4. Conclusion
This study systematically investigated the relationship between key FDM process parameters and the dimensional accuracy of fabricated polymer spur gears, using ABS material as a case study. Through a structured orthogonal experimental design and advanced metrology techniques, several key conclusions were drawn:
- The FDM process induces characteristic deformation patterns in spur gears. Internal features like the bore and keyway shrink, while the tooth profiles exhibit a non-uniform deviation: material tends to accumulate near the root (positive deviation) and shrink near the tip (negative deviation), with significant warpage occurring on the bottom face.
- The quantitative accuracy of the spur gears, measured by Total Profile Deviation ($F_α$) and Pitch Deviation ($f_{pt}$), is significantly and differentially affected by the printing parameters. The influence hierarchy on profile error is: Printing Speed > Layer Thickness > Nozzle Temperature > Bed Temperature. For pitch error, the hierarchy is: Layer Thickness > Nozzle Temperature > Bed Temperature > Printing Speed.
- A multi-objective optimization using the comprehensive balancing method yielded an optimal parameter set for minimizing both types of deviations simultaneously in FDM-fabricated spur gears: a Nozzle Temperature of 230°C, a Bed Temperature of 87°C, a Printing Speed of 40 mm/s, and a Layer Thickness of 0.1 mm.
This research provides a practical framework and specific parameter guidelines for engineers and makers aiming to produce functional, dimensionally accurate polymer spur gears using desktop FDM technology. The methodology combining DoE, 3D scanning, and gear-specific metrology can be extended to other complex geometries and materials, contributing to the broader goal of employing AM for precise end-use components. Future work could explore the effects of other parameters like infill pattern, cooling settings, and the application of iterative compensation algorithms based on the deviation patterns identified here to further enhance the precision of additively manufactured spur gears.