
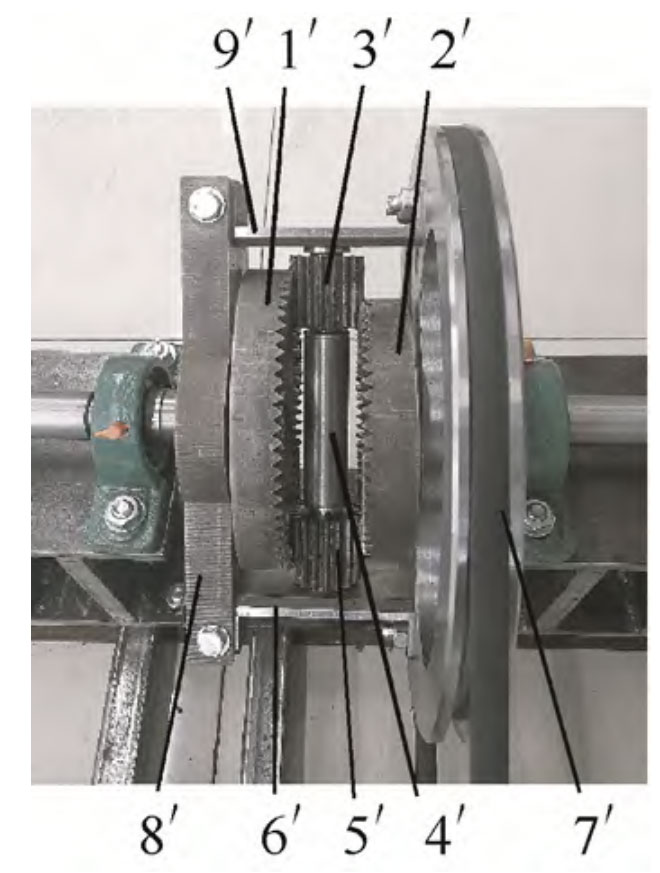
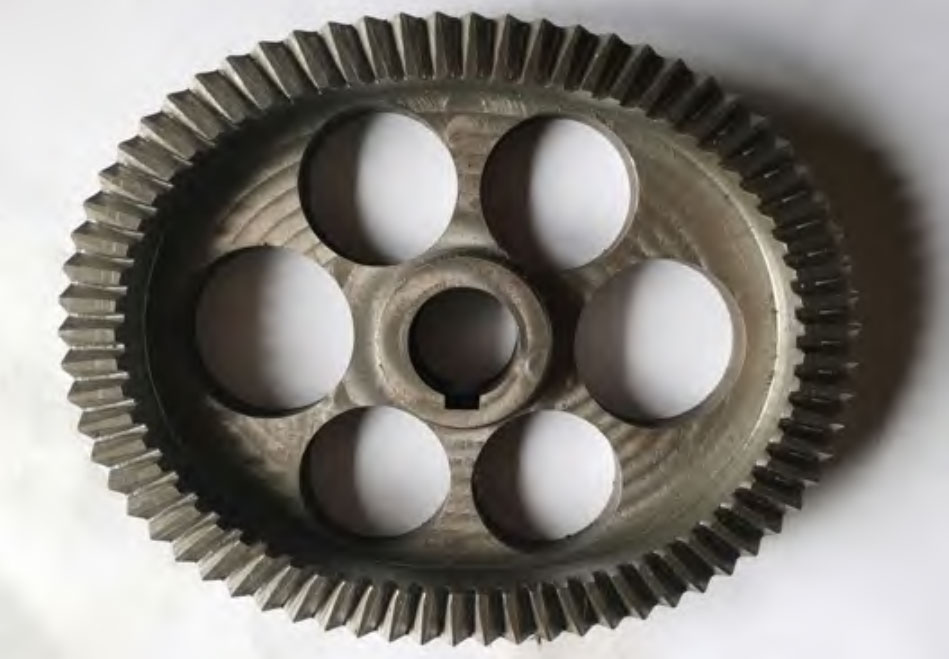
The prototype of a second-order non circular gear differential is shown in Figure 1, mainly composed of non circular gears 1 ‘and 2’, small cylindrical spur gears 3 ‘and 5’, planetary shaft 4 ‘, connecting arms 6’ and 9 ‘, right housing 7’, and left housing 8 ‘. The right housing 7’ has grooves on it, and the bevel gear 7 in Figure 2 is replaced by belt transmission. Figure 2 shows the processed second-order non circular gear, and the phase angle difference between the two non circular gears at the initial installation position is 90 °, The major axis and minor axis of two non circular gears are opposite each other. Two small cylindrical spur gears 3 ‘and 5’ are symmetrically installed on both ends of the planetary shaft 4 ‘through self-lubricating bearings. The left housing 8’, connecting arms 6 ‘, 9’, and right housing 7 ‘together form the planetary carrier.
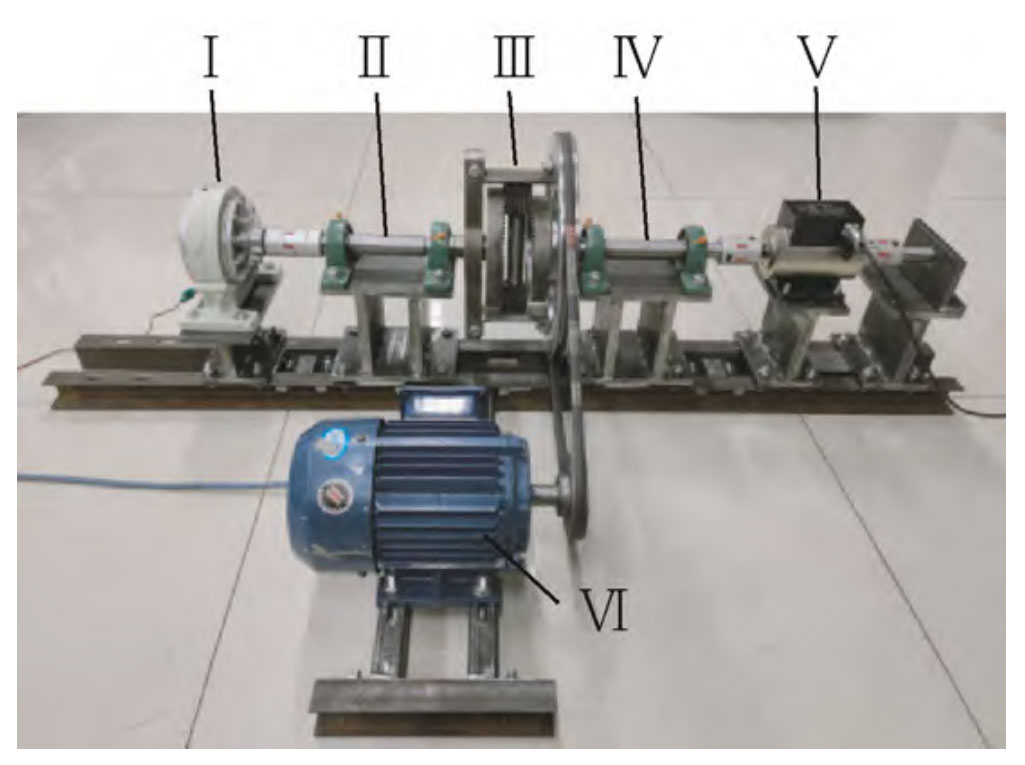
Build a non circular gear differential test device as shown in Figure 3. The three-phase asynchronous motor drives the planetary carrier directly through belt transmission, and the left half shaft of the differential is connected to the magnetic particle brake through a coupling to adjust the braking torque of the magnetic particle brake, which can simulate the adhesion of different road surfaces to the slipping wheel. The torque sensor is installed between the right half shaft and the frame to measure the output torque of the differential to the right non slipping wheel.
The purpose of the experiment is to verify the correctness of the traction analysis method generated by the differential when one side of the wheel slips. The parameters of the test device are shown in Table 1. In the experiment, the wheels were omitted, so the rolling friction couple MG on a single wheel was taken as zero, and the input speed of the differential was nH (corresponding to ω H has the same meaning but different units), the sliding friction coefficient between the wheel and the road surface μ 1. The experiment was conducted in two groups, testing different nH and μ The maximum traction force generated by the differential.
| Parameters | Numerical value |
| Eccentricity of non-circular gear ε | 0.18 |
| Module of non circular gear m | 2 |
| Number of non circular gears n1 | 2 |
| Inertia of non circular gear I1/(kg · m ^ 2) | 6.82×10^−3 |
| Inertia of planetary gear rotation around the axis I3/(kg · m ^ 2) | 4.8×10^−5 |
| Planetary wheel radius r ^ 3/m | 0.03 |
| Number of planetary gears n ^ 2 | 2 |
| Dynamic friction coefficient of wheels with water ice surface μ1 | 0.1 |
| Dynamic friction coefficient of wheels with snow and ice surfaces μ | 0.2 |
| Dynamic friction coefficient of snow road on wheels μ | 0.3 |
| Dynamic friction coefficient of wheels on muddy roads μ | 0.4 |
| Dynamic friction coefficient of wheels on gravel road surface μ1 | 0.5 |
| Torque sensor model | HCNJ-101 |
| Torque sensor range/(N · m) | 0~±50 |
In the first group of tests, set the sliding friction coefficient between the driving wheel on the sliding side and the road surface μ 1=0.1, the resistance torque generated by sliding friction is equivalent to the output torque of the magnetic powder brake as 2 N · m, adjust the input speed of the three-phase asynchronous motor, use the torque sensor to measure the dynamic output torque on the right half shaft, and substitute its maximum value into the formula to calculate the maximum traction force generated by the differential in the test. The test data is shown in Table 2.
| Serial number | Planetary carrier input speed nH/(r/min) | Measured maximum value of torque sensor (N.m) | Maximum traction force Fdmax/N |
| 1 | 30 | 2.81 | 60.125 |
| 2 | 90 | 3.08 | 63.5 |
| 3 | 150 | 4.27 | 78.375 |
| 4 | 210 | 5.57 | 94.625 |
| 5 | 270 | 7.01 | 112.625 |
| 6 | 300 | 7.63 | 120.375 |
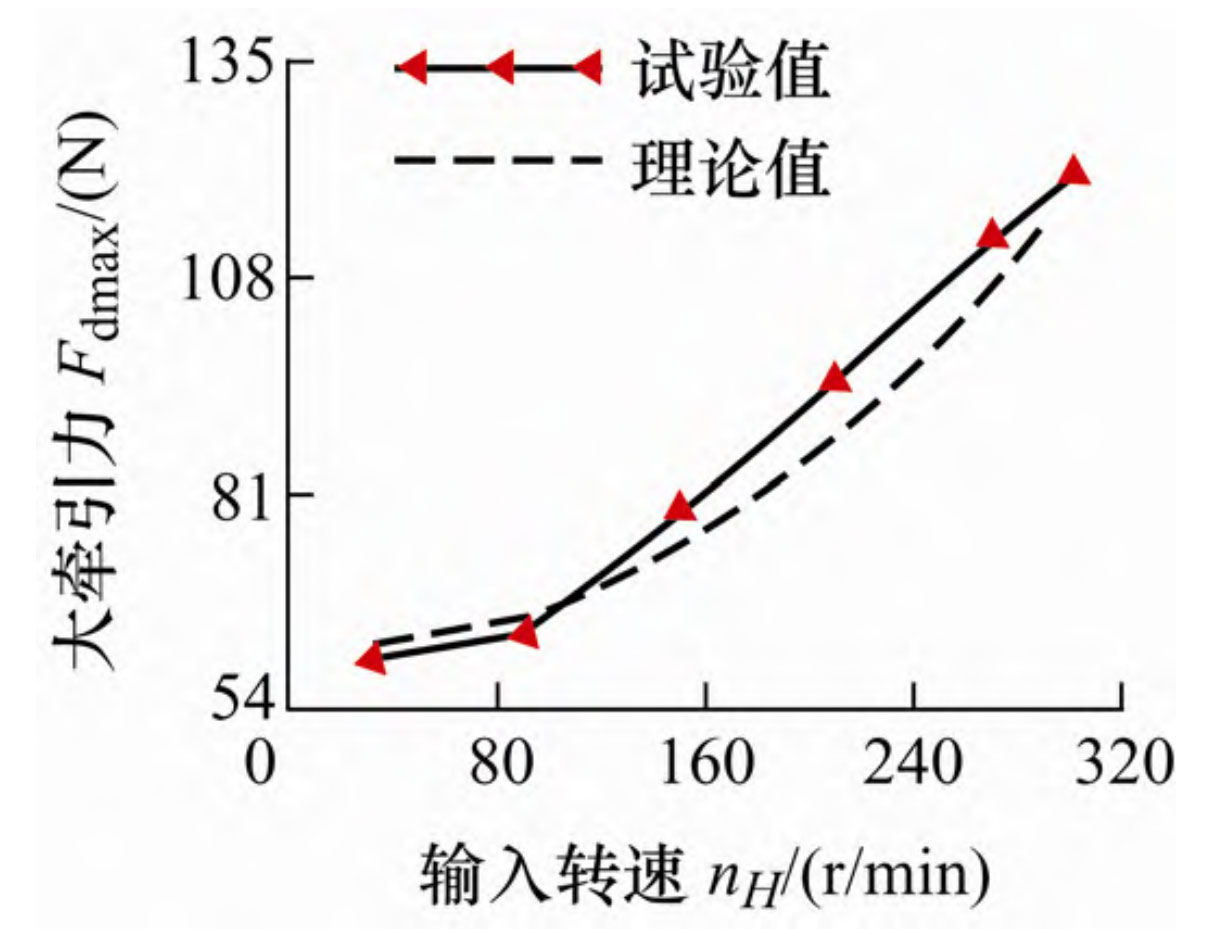
According to the formula, the theoretical traction force of the test device at different nH can be calculated, and the theoretical value can be compared with the experimental value in Table 2, as shown in Figure 4. The solid line represents the experimental value, and the dashed line represents the theoretical value. From the figure, it can be seen that the theoretical curve matches the experimental curve well. As the input speed nH increases, the traction force generated by the differential is effectively improved. This indicates that when the vehicle cannot move when one side of the wheel is stuck in a slipping state, increasing the throttle to increase the input speed of the differential can increase the traction force of the vehicle, thereby overcoming wheel slip and helping the vehicle out of difficulties. This is a dynamic anti slip phenomenon, Unlike any current differential, the anti slip principle is different, and research on variable transmission ratio differentials has not reported this phenomenon.
In the second set of tests, the input speed nH=150 r/min of the non circular gear differential planetary carrier was set, and the output torque of the magnetic particle brake was calculated for the five slippery road conditions in Table 1. Adjust the control current of the magnetic particle brake in turn, simulate the sliding friction resistance torque of the slipping wheel under different road conditions, test the output torque of the wheel on the non slipping side through the torque sensor, and then obtain the maximum traction force generated by the differential in the test according to the formula, as shown in Table 3.
| Serial number | Traffic | Magnetic powder brake input torque/(N · m) | Measured maximum value of torque sensor/(N · m) | Maximum traction force Fdmax/N |
| 1 | Ice surface with water | 2 | 4.37 | 79.625 |
| 2 | Snow covered ice surface | 4 | 7.53 | 144.125 |
| 3 | Snow road | 6 | 10.65 | 208.125 |
| 4 | Muddy road | 8 | 13.81 | 272.625 |
| 5 | Gravel road | 10 | 14.09 | 301.125 |
Similarly, calculate the theoretical traction force of the test device under different road conditions according to the formula and compare it with the experimental values, as shown in Figure 5. The solid line represents the experimental value, while the dashed line shows the theoretical value. The theoretical curve matches the experimental curve well. As the ground friction coefficient increases, the traction force generated by the non circular gear differential increases linearly, which is consistent with that of ordinary anti slip differential.
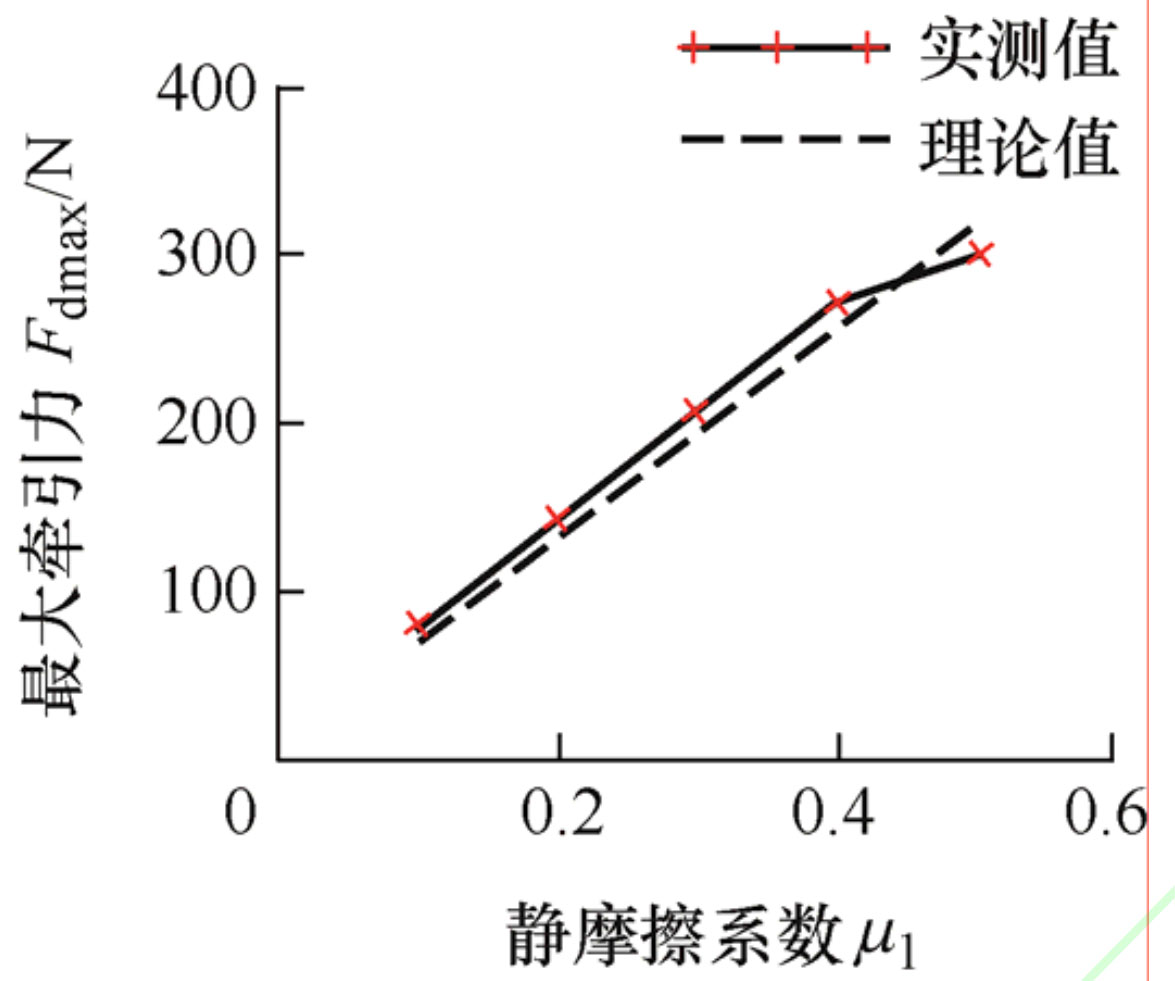
There is a certain error between the theoretical and experimental values in Figures 4 and 5, mainly due to the control error of variable frequency motors and magnetic particle brakes, as well as the manufacturing error of non circular gear differential. The maximum error between the theoretical and experimental values does not exceed 8%, proving that the traction analysis method for non circular gear differentials established in the article is correct. In order to further reveal the theoretical mechanism of dynamic anti-skid phenomenon in Test 1 and the vehicle’s disengagement characteristics under the drive of non-circular gear differential, the following is to study the dynamic characteristics of the vehicle during the disengagement process based on the traction model and through the vehicle dynamics simulation.