
In my research, I focus on the meshing behavior of a hypoid bevel gear set manufactured by the face-hobbed method. The hypoid bevel gear is widely used in automotive axles, helicopter transmissions, and other crossed-axis drives because it offers high contact ratio, strong misalignment tolerance, stable meshing, and large offset capability. However, the face-hobbed process introduces a continuous indexing motion and a full-profile cutting action, which makes the tooth surface geometry extremely complex. As a result, tooth surface design, machine setting calculation, and contact pattern control become difficult. My work aims to establish an accurate mathematical model, evaluate tool errors and installation misalignments, and validate the model through cutting, measurement, and rolling tests.
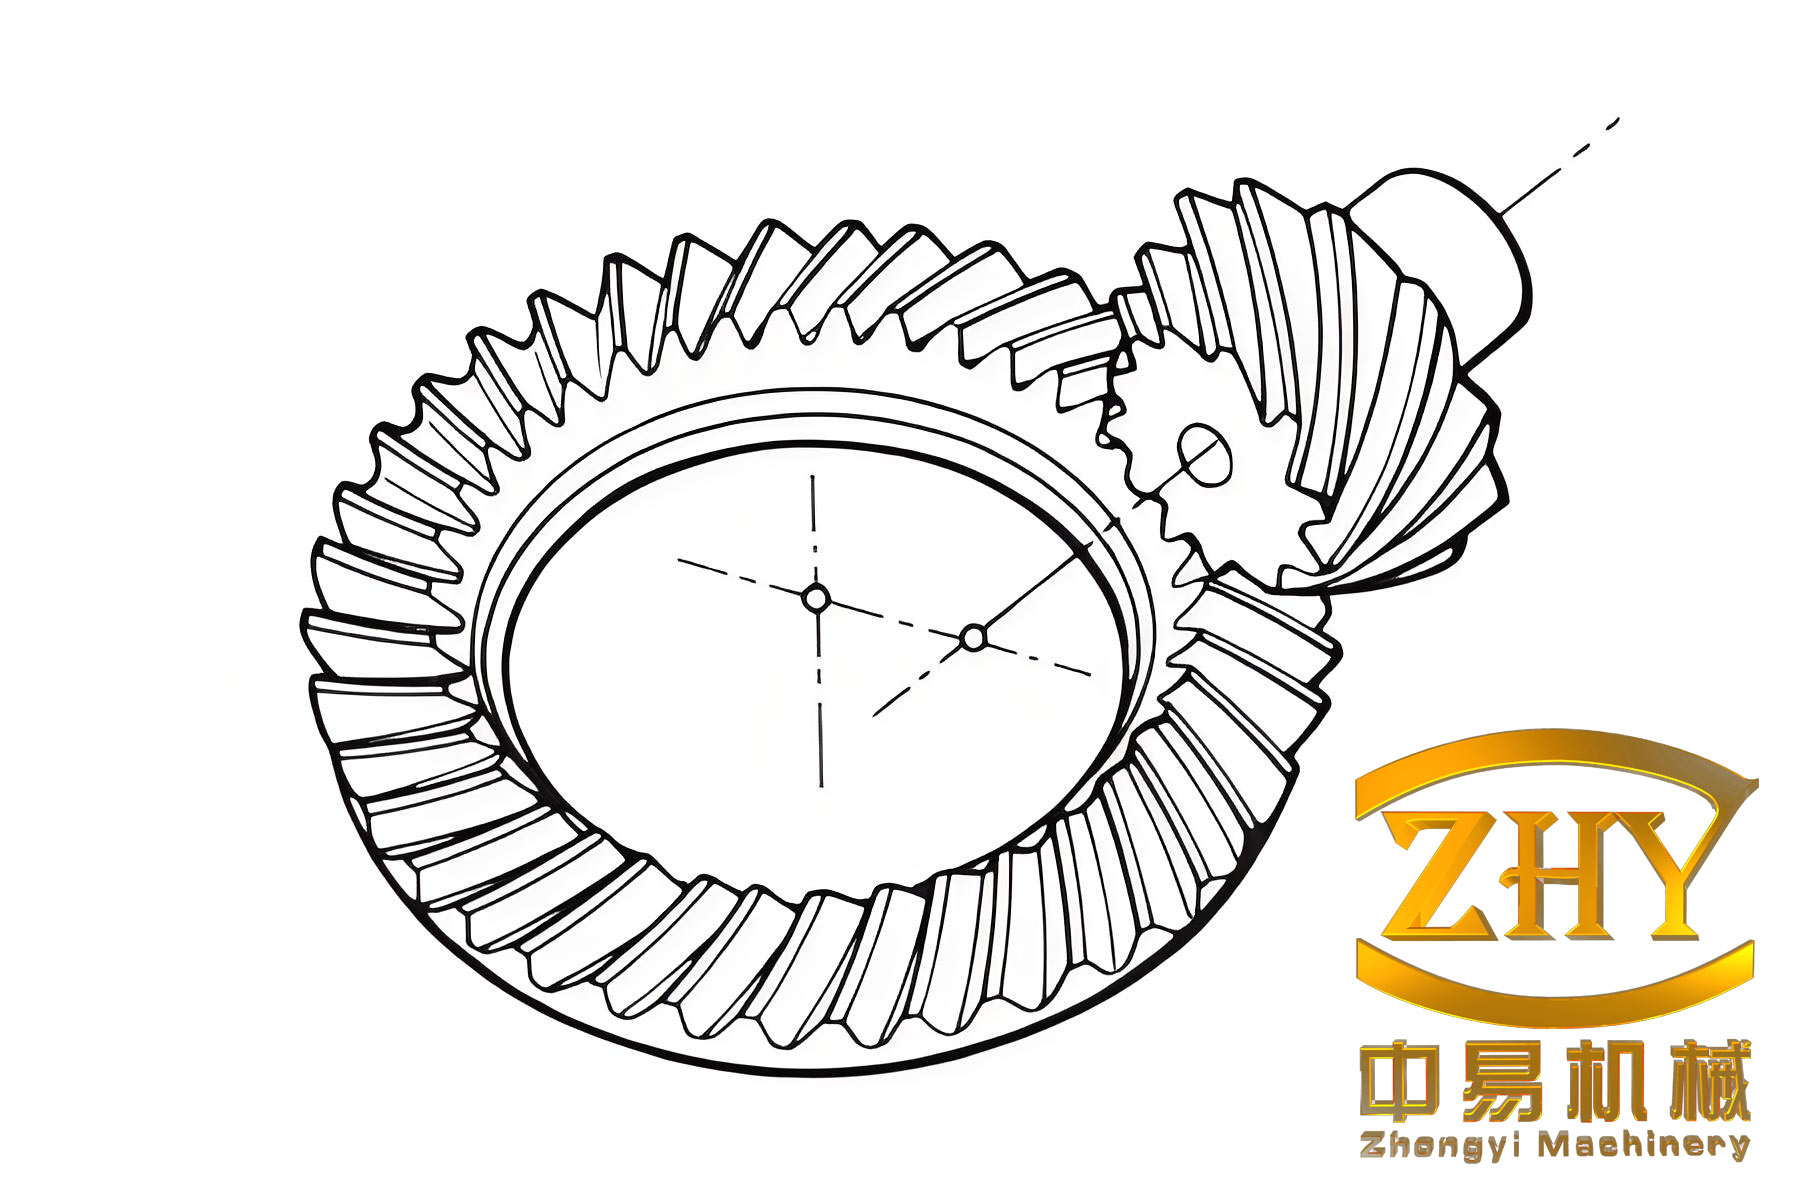
The hypoid bevel gear set studied here is produced by a face-hobbed process. Unlike face-milled tapered-depth gears, face-hobbed gears usually have uniform depth. The gear teeth are generated by a cutter head that rotates about its own axis while also orbiting around the machine cradle axis. This motion produces an extended epicycloid tooth trace. The cutter head contains several groups of blades. Each group has at least one inner blade and one outer blade, which cut the convex and concave flanks simultaneously. During cutting, the cutter head and the workpiece rotate according to a fixed ratio. When the cutter head passes one blade group, the workpiece rotates exactly one tooth. Thus, both sides of one tooth slot are finished in one continuous indexing cycle.
1. Geometric Modeling of the Face-Hobbed Hypoid Bevel Gear
I begin with the cutting principle. The face-hobbed hypoid bevel gear is generated by a virtual generating gear that represents the cradle motion. The blade geometry, cutter head position, and machine kinematics determine the final tooth surface. In my model, I use a three-face blade with a neutral data (ND) normal datum. This blade has a front face, a main cutting edge, a Tip arc, a side relief face, and a blade body. The main cutting edge generates the working tooth profile, while the tip arc generates the root fillet. The main cutting edge can be straight, circular, or polynomial. In this work, I adopt a circular main cutting edge because it is common in actual production.
The blade section in the front face is described by two coordinate systems. The first system is attached to the reference point on the blade pitch line. The second system is attached to the center of the tip arc. The transformation from the tip arc system to the reference point system is written as:
$$
\mathbf{r}_{tip}(u,\theta) =
\begin{bmatrix}
x_{tip}(u,\theta) \\
y_{tip}(u,\theta) \\
z_{tip}(u,\theta)
\end{bmatrix}
=
\mathbf{M}_{ref \to tip}
\begin{bmatrix}
r_{tip} \cos\theta \\
r_{tip} \sin\theta \\
0
\end{bmatrix}
+
\mathbf{T}_{ref \to tip}
$$
where \(r_{tip}\) is the tip arc radius, \(\theta\) is the angular parameter along the tip arc, and \(\mathbf{M}_{ref \to tip}\), \(\mathbf{T}_{ref \to tip}\) are the rotation and translation matrices from the reference point system to the tip arc system. For the main cutting edge, the circular profile is expressed as:
$$
\mathbf{r}_{main}(u) =
\begin{bmatrix}
x_{main}(u) \\
y_{main}(u) \\
z_{main}(u)
\end{bmatrix}
=
\begin{bmatrix}
R_{c} \sin\left(\frac{u}{R_{c}}\right) \\
R_{c} \left(1 – \cos\left(\frac{u}{R_{c}}\right)\right) \\
0
\end{bmatrix}
$$
Here \(R_{c}\) is the main cutting edge radius and \(u\) is the arc length from the reference point. The blade errors are defined based on this ND normal datum. I consider five error variables: main cutting edge radius error \(\Delta R_{c}\), reference point pressure angle error \(\Delta \alpha_{0}\), rake angle error \(\Delta \gamma\), regrind angle error \(\Delta \varepsilon\), and cutting side relief angle error \(\Delta \beta\). These errors directly change the blade profile and therefore change the generated hypoid bevel gear tooth surface.
Next, I build the cutter head coordinate system. The cutter head rotates about its own axis. The blades are mounted in the cutter head at a certain radius and angular position. The transformation from the blade coordinate system to the cutter head coordinate system is:
$$
\mathbf{r}_{cutter} =
\mathbf{M}_{head}
\begin{bmatrix}
x_{blade} \\
y_{blade} \\
z_{blade}
\end{bmatrix}
+ \mathbf{T}_{head}
$$
Then, I introduce the machine tool coordinate system. The machine settings include radial distance \(S_{R}\), cutter tilt angle \(i\), cutter swivel angle \(j\), initial cradle angle \(q\), vertical offset \(E\), machine root angle \(\Gamma\), sliding base \(B\), and horizontal offset \(A\). The transformation from the cutter head coordinate system to the workpiece coordinate system is written as a chain of homogeneous transformations:
$$
\mathbf{r}_{workpiece} =
\mathbf{M}_{workpiece \leftarrow cradle}
\mathbf{M}_{cradle \leftarrow cutter}
\mathbf{r}_{cutter}
$$
For the gear member, the tooth surface is formed directly by the blade sweeping motion because the gear is usually cut by the formate method. For the pinion, the tooth surface is the envelope of the blade family generated by the generating motion. The meshing equation is used to solve the envelope condition:
$$
\mathbf{n} \cdot \mathbf{v}^{(12)} = 0
$$
where \(\mathbf{n}\) is the unit normal vector of the cutter surface and \(\mathbf{v}^{(12)}\) is the relative velocity between the cutter and the workpiece. In my model, the relative velocity is computed from the machine settings and the roll ratio \(i_{gp}\). The unit normal is obtained from the partial derivatives of the cutter surface:
$$
\mathbf{n} =
\frac{
\frac{\partial \mathbf{r}}{\partial u} \times \frac{\partial \mathbf{r}}{\partial \theta}
}{
\left|
\frac{\partial \mathbf{r}}{\partial u} \times \frac{\partial \mathbf{r}}{\partial \theta}
\right|
}
$$
The relative velocity is:
$$
\mathbf{v}^{(12)} =
\mathbf{v}^{(1)} – \mathbf{v}^{(2)}
$$
where \(\mathbf{v}^{(1)}\) and \(\mathbf{v}^{(2)}\) are the velocities of the cutter and workpiece points in the same coordinate system. Substituting the normal and relative velocity into the meshing equation gives the generating parameter as a function of the blade parameters. Then, I substitute this parameter back into the cutter surface equation to obtain the final pinion tooth surface. By repeating this procedure for many discrete points, I obtain the complete tooth surface point set.
I use MATLAB to program the above equations and obtain the point sets for the pinion and gear. The gear and cutter parameters are listed in Table 1. The machine settings are listed in Table 2. These parameters are typical for a face-hobbed hypoid bevel gear with a small crossed shaft angle and a large offset.
| Parameter | Pinion concave | Pinion convex | Gear concave | Gear convex |
|---|---|---|---|---|
| Number of teeth \(z\) | 11 | 11 | 47 | 47 |
| Hand of spiral | Left | Left | Right | Right |
| Offset \(E\) (mm) | 38.1 | 38.1 | 38.1 | 38.1 |
| Shaft angle \(\Sigma\) (deg) | 90 | 90 | 90 | 90 |
| Reference radius (mm) | 76 | 76 | 76 | 76 |
| Main cutting edge radius (mm) | 1093.65 | 1062.73 | 1360.74 | 1276.45 |
| Pressure angle (deg) | 22.3059 | 20.1933 | 18.9931 | 23.5060 |
| Regrind angle (deg) | 4.3674 | 4.7856 | 5.0309 | 4.1101 |
| Cutting side relief angle (deg) | 13.3885 | 12.6729 | 13.3823 | 12.6781 |
| Rake angle (deg) | 9.5870 | 10.3059 | 12.6781 | 9.6107 |
| Machine setting | Symbol | Pinion | Gear |
|---|---|---|---|
| Cutter tilt angle (deg) | \(i\) | 3.3325 | 0 |
| Cutter swivel angle (deg) | \(j\) | 146.9405 | 0 |
| Radial distance (mm) | \(S_{R}\) | 121.9391 | 122.009 |
| Initial cradle angle (deg) | \(q\) | 52.6673 | -29.7048 |
| Vertical offset (mm) | \(E\) | 39.8352 | 0 |
| Sliding base (mm) | \(B\) | -12.2486 | 0 |
| Horizontal offset (mm) | \(A\) | 3.1158 | 13.9199 |
| Machine root angle (deg) | \(\Gamma\) | 23.4453 | 64.7995 |
| Roll ratio | \(i_{gp}\) | 4.722168 | 0 |
After obtaining the point sets, I import them into a three-dimensional CAD environment to build the solid model. The flow is as follows: first, I generate the cutting profile for each tooth slot; second, I create the blank geometry; third, I perform a Boolean subtraction to obtain the tooth geometry; fourth, I assemble the pinion and gear according to the mounting parameters. The assembly model shows no interference at the toe or heel, which confirms that the mathematical model and the modeling flow are correct.
2. Influence of Tool Errors on Tooth Surface Geometry
Tool errors are unavoidable in production. They directly affect the tooth surface geometry and therefore affect the meshing behavior of the hypoid bevel gear. I define tooth surface deviation as the normal distance between the actual tooth surface and the standard tooth surface. A positive value means the actual surface lies outside the standard surface, and a negative value means the actual surface lies inside the standard surface. In my analysis, the pinion concave surface is the error surface, and the pinion convex surface is the standard surface.
I study five tool error cases. The main cutting edge radius error cases are listed in Table 3. The blade angle error cases are listed in Table 4.
| Case | Main cutting edge radius (mm) | Error (mm) |
|---|---|---|
| Base | 1062.73 | 0 |
| A | 962.73 | -100 |
| B | 1012.73 | -50 |
| C | 1112.73 | +50 |
| D | 1162.73 | +100 |
| Case | Pressure angle (deg) | Regrind angle (deg) | Rake angle (deg) | Cutting side relief angle (deg) |
|---|---|---|---|---|
| Base | 20.1933 | 4.7856 | 10.3059 | 12.6729 |
| A | -1 | -1 | -1 | -1 |
| B | -0.5 | -0.5 | -0.5 | -0.5 |
| C | +0.5 | +0.5 | +0.5 | +0.5 |
| D | +1 | +1 | +1 | +1 |
For the main cutting edge radius error, the tooth surface deviation is negative when the radius error is negative, and positive when the radius error is positive. The deviation at the heel is larger than that at the toe. The deviation at the top and root is larger than that at the middle. The maximum deviation occurs near the heel and top, while the minimum deviation occurs near the toe and middle. The comparison shows that a negative radius error produces a larger geometric deviation than a positive radius error.
For the reference point pressure angle error, the deviation pattern is similar to the radius error case, but the magnitude is much larger. A positive pressure angle error gives a negative tooth surface deviation, and a negative pressure angle error gives a positive tooth surface deviation. When the pressure angle error changes by \(\pm 1^\circ\), the maximum deviation is about \(0.2303\) mm and \(0.0025\) mm. The maximum point is near the heel and top, and the minimum point is near the toe and middle. The deviation increases with the pressure angle error, and the positive error has a stronger effect than the negative error.
For the regrind angle error, the deviation pattern is also similar. A negative regrind angle error gives a positive deviation, and a positive regrind angle error gives a negative deviation. The maximum deviation is about \(0.0312\) mm when the error is \(\pm 1^\circ\). The deviation increases with the absolute error value, and the increment is almost uniform.
For the rake angle error, the deviation pattern remains similar, but the magnitude is very small. The maximum deviation is on the order of \(10^{-6}\) mm. Thus, the rake angle error has almost no influence on the tooth surface geometry, although it may affect the surface roughness.
For the cutting side relief angle error, the deviation pattern is again similar. A negative error gives a positive deviation, and a positive error gives a negative deviation. The maximum deviation is about \(0.0056\) mm when the error is \(\pm 1^\circ\). The deviation increases with the absolute error value, and the increment is almost uniform.
Table 5 summarizes the maximum deviation for each tool error type. The ranking from strongest to weakest is: reference point pressure angle, main cutting edge radius, cutting side relief angle, regrind angle, and rake angle. Among the blade angle errors, the pressure angle has the strongest influence, while the rake angle has the weakest influence.
| Tool error type | Maximum deviation (mm) | Location of maximum | Location of minimum |
|---|---|---|---|
| Main cutting edge radius \(\pm 100\) mm | 0.0010 | Heel, top | Toe, middle |
| Pressure angle \(\pm 1^\circ\) | 0.2303 | Heel, top | Toe, middle |
| Regrind angle \(\pm 1^\circ\) | 0.0312 | Heel, top | Toe, middle |
| Rake angle \(\pm 1^\circ\) | \(1.8 \times 10^{-6}\) | Heel, top | Toe, middle |
| Cutting side relief angle \(\pm 1^\circ\) | 0.0056 | Heel, top | Toe, middle |
3. Vehicle Axle System and Misalignment Analysis
To evaluate the actual meshing behavior of the hypoid bevel gear, I build a whole vehicle axle model. The model includes the housing, input pinion shaft, gear, differential assembly, left and right output half shafts, output shaft housings, hubs, bearings, and other auxiliary parts. The power flow is: input pinion shaft, gear, differential housing, differential sun gear, left and right output half shafts, and hubs.
The input pinion shaft is supported by two tapered roller bearings in a back-to-back arrangement. This arrangement can handle the axial force generated by the hypoid bevel gear in both forward and reverse rotation. The differential housing is connected to the gear by bolts. The differential gear set includes two sun gears and two planet gears. The output half shafts are supported by tapered roller bearings. I use a commercial software package to build the axle model. The gear model is imported from a gear design tool that uses the same mathematical model described above. The shafts, bearings, differential, and housing are modeled as beam elements, rigid elements, and finite elements.
I define four misalignment components for the hypoid bevel gear: offset error \(E\), axial displacement along the pinion axis \(XP\), axial displacement along the gear axis \(XW\), and shaft angle error \(\Sigma\). The positive direction of \(E\) means the offset is reduced. The positive direction of \(XP\) means the pinion moves from toe to heel. The positive direction of \(XW\) means the gear moves from toe to heel. The positive direction of \(\Sigma\) means the shaft angle increases.
I consider three load cases, as listed in Table 6. These cases represent high-speed low-torque, medium-speed medium-torque, and low-speed high-torque conditions.
| Load case | Input speed (r/min) | Input torque (N·m) | Operating time (hr) |
|---|---|---|---|
| Case 1 | 6000 | 50 | 100 |
| Case 2 | 680 | 450 | 100 |
| Case 3 | 330 | 900 | 100 |
For the theoretical installation condition, I calculate the misalignments of the gear, pinion, and total system. The results are listed in Table 7. The misalignment increases with load in all four directions. The pinion misalignment is the main contributor to the total misalignment, especially for the offset error \(E\). The growth of misalignment with load is approximately exponential.
| Component | Misalignment type | Case 1 | Case 2 | Case 3 |
|---|---|---|---|---|
| Gear | \(E\) (mm) | 0.6469 | 2.6167 | 4.1776 |
| \(XP\) (mm) | -4.238 | -22.4117 | -38.981 | |
| \(XW\) (mm) | 7.6618 | 32.5358 | 52.1534 | |
| \(\Sigma\) (deg) | 0.02224 | 0.1053 | 0.1759 | |
| Pinion | \(E\) (mm) | 12.7469 | 71.9841 | 128.2177 |
| \(XP\) (mm) | -8.1972 | -42.5919 | -74.0569 | |
| \(XW\) (mm) | 13.4506 | 81.1147 | 146.95 | |
| \(\Sigma\) (deg) | -0.08085 | -0.5288 | -0.9765 | |
| Total | \(E\) (mm) | 13.3938 | 74.6008 | 132.3953 |
| \(XP\) (mm) | -12.4352 | -65.0036 | -113.0379 | |
| \(XW\) (mm) | 21.1124 | 113.6506 | 199.1034 | |
| \(\Sigma\) (deg) | -0.0586 | -0.4235 | -0.8006 |
I also analyze a preset eccentricity condition. In this condition, the housing is intentionally offset to compensate for the loaded misalignment. The left output half shaft is shifted upward by 1.12 mm, and the right output half shaft is shifted forward by 1 mm. The results are listed in Table 8. Compared with the theoretical installation, the preset eccentricity reduces the offset error \(E\) and the pinion axial misalignment \(XP\). The gear axial misalignment \(XW\) increases slightly under high load, but the hypoid bevel gear is less sensitive to \(XW\). Therefore, the preset eccentricity is beneficial for reducing the misalignment and improving the meshing quality.
| Component | Misalignment type | Case 1 | Case 2 | Case 3 |
|---|---|---|---|---|
| Gear | \(E\) (mm) | 0.5946 | 2.1223 | 3.183 |
| \(XP\) (mm) | -3.8788 | -19.0303 | -32.1943 | |
| \(XW\) (mm) | 7.6099 | 32.0996 | 51.288 | |
| \(\Sigma\) (deg) | 0.02261 | 0.1085 | 0.1821 | |
| Pinion | \(E\) (mm) | 12.1634 | 66.8763 | 118.0536 |
| \(XP\) (mm) | -7.3678 | -35.495 | -60.1514 | |
| \(XW\) (mm) | 13.7522 | 83.9604 | 152.5045 | |
| \(\Sigma\) (deg) | -0.08237 | -0.5437 | -1.0056 | |
| Total | \(E\) (mm) | 12.758 | 68.9985 | 121.2366 |
| \(XP\) (mm) | -11.2466 | -54.5253 | -92.3457 | |
| \(XW\) (mm) | 21.3621 | 116.06 | 203.7924 | |
| \(\Sigma\) (deg) | -0.05977 | -0.4352 | -0.8236 |
4. Loaded Contact Analysis Model
I build a finite element contact model for the hypoid bevel gear pair. The pinion uses a full-tooth model, and the gear uses a partial-tooth model with 11 teeth. The pinion and gear are coupled to reference points at their rotational axes. The pinion concave surface is the driving surface, and the gear convex surface is the driven surface. The contact pairs are frictionless and use hard contact. The material is isotropic steel with a Young’s modulus of 210 GPa and a Poisson’s ratio of 0.3. The mesh uses tetrahedral elements for the pinion and hexahedral elements for the gear. The pinion has about 17,600 elements, and the gear has about 89,400 elements.
The analysis has three steps. In the first step, the pinion rotates a small angle while the gear is fixed, so that the teeth come into contact. In the second step, the gear rotational degree of freedom is released, and a torque is applied to the gear. In the third step, the pinion rotates further and drives the gear. This procedure simulates the loaded meshing process of the hypoid bevel gear.
5. Meshing Characteristics under Standard Installation
I first analyze the standard installation condition. The contact patterns for three load cases are shown in Table 9. At 50 N·m, the contact is almost a point contact. As the load increases, the contact pattern becomes elliptical, and its area increases. At 50 N·m, the maximum contact stress is 403 MPa, and the contact area ratio is 11.78%. At 450 N·m, the maximum contact stress is 950 MPa, and the area ratio is 30.7%. At 900 N·m, the maximum contact stress is 1294 MPa, and the area ratio is 40.5%.
| Load case | Maximum contact stress (MPa) | Contact area ratio (%) | Contact pattern shape |
|---|---|---|---|
| 50 N·m | 403 | 11.78 | Nearly point contact |
| 450 N·m | 950 | 30.7 | Elliptical |
| 900 N·m | 1294 | 40.5 | Large ellipse |
The transmission error also increases with load. The peak-to-peak value of the transmission error grows from case 1 to case 3. Table 10 lists the mean value and peak-to-peak value of the transmission error for the three load cases.
| Load case | Mean transmission error (arcsec) | Peak-to-peak transmission error (arcsec) |
|---|---|---|
| 50 N·m | 8.5 | 0.12 |
| 450 N·m | 11.3 | 0.188 |
| 900 N·m | 13.7 | 0.265 |
The root bending stress also increases with load. At 50 N·m, the maximum root bending stress is 29.61 MPa. At 450 N·m, it is 202.7 MPa. At 900 N·m, it is 321.67 MPa. The location of the maximum root stress shifts as the load increases, and the meshing time also increases, which indicates that the contact ratio increases.
6. Influence of Misalignment on Meshing Characteristics
When misalignment exists, the hypoid bevel gear tooth top shows edge contact. As the load increases, the edge contact becomes more obvious. Compared with the standard installation, the maximum contact stress increases slightly, and the contact area decreases slightly. The transmission error peak-to-peak value is larger than that of the standard installation. Table 11 compares the contact stress and area ratio for the theoretical misalignment condition.
| Load case | Maximum contact stress (MPa) | Contact area ratio (%) | Edge contact |
|---|---|---|---|
| 50 N·m | 365 | 14.11 | Slight |
| 450 N·m | 975 | 29.15 | Moderate |
| 900 N·m | 1516 | 44.79 | Severe |
Under the preset eccentricity condition, the contact pattern is similar to that of the theoretical misalignment condition. The edge contact still appears at the tooth top, and it becomes more obvious with load. The maximum contact stress is almost the same as that of the theoretical misalignment condition. The influence of preset eccentricity on the contact pattern is not obvious. However, the transmission error peak-to-peak value is slightly reduced. Table 12 compares the transmission error for the three installation conditions.
| Load case | Standard peak-to-peak (arcsec) | Theoretical misalignment peak-to-peak (arcsec) | Preset eccentricity peak-to-peak (arcsec) |
|---|---|---|---|
| 50 N·m | 0.12 | 0.145 | 0.138 |
| 450 N·m | 0.188 | 0.215 | 0.204 |
| 900 N·m | 0.265 | 0.298 | 0.285 |
7. Influence of Tool Errors on Meshing Characteristics
I also study how tool errors affect the meshing behavior of the hypoid bevel gear under the 450 N·m load case. For the standard tool parameters, the contact pattern is located near the heel and top, the contact area ratio is 30.7%, the mean transmission error is about 11.3 arcsec, the peak-to-peak transmission error is 0.188 arcsec, and the maximum root bending stress is 227.85 MPa.
For the main cutting edge radius error, the contact pattern size and position are not sensitive. The transmission error mean value increases slightly as the radius decreases. The peak-to-peak transmission error varies between 0.18 and 0.225 arcsec. The root bending stress position remains almost unchanged. Therefore, reducing the radius can reduce the mean transmission error if the contact area is acceptable.
For the reference point pressure angle error, the contact pattern moves from the heel and root toward the toe and top as the pressure angle increases. The contact area first increases and then decreases. The pressure angle error has a strong influence on the transmission error. As the pressure angle increases, the peak-to-peak transmission error increases. A change of \(\pm 1^\circ\) can increase the peak-to-peak value by 276% or decrease it by 56%. The maximum root bending stress first decreases and then increases, with a minimum value of 152.86 MPa at a certain pressure angle error.
For the rake angle error, the contact pattern position and size are almost unchanged. The contact area ratio remains near 31%. The mean transmission error increases slightly from 11.28 to 11.33 arcsec. The peak-to-peak transmission error increases by about 9.8% at most. The root bending stress is almost unaffected.
For the regrind angle error, the contact pattern moves toward the top as the regrind angle increases. The contact area decreases from 33.4% to 28.8%. When the regrind angle error is \(+1^\circ\), edge contact begins at the top. The peak-to-peak transmission error increases when the regrind angle increases. Reducing the regrind angle can increase the contact area and reduce the transmission error.
For the cutting side relief angle error, the contact pattern position and size are almost unchanged. The contact area ratio remains between 30% and 32%. The mean transmission error increases obviously as the relief angle increases. The peak-to-peak transmission error increases by about 9.54% at most. The root bending stress decreases slightly when the relief angle is reduced. This behavior is similar to that of the rake angle error, but the relief angle has a stronger influence on the transmission error mean value.
Table 13 summarizes the influence of tool errors on the meshing characteristics of the hypoid bevel gear.
| Tool error | Contact pattern position | Contact area | Transmission error mean | Transmission error peak-to-peak | Root bending stress |
|---|---|---|---|---|---|
| Main cutting edge radius | Slightly sensitive | Increases with radius | Increases as radius decreases | 0.18–0.225 arcsec | Position unchanged |
| Pressure angle | Strongly sensitive | First increases then decreases | Decreases | Increases with positive error | Minimum at some error |
| Rake angle | Insensitive | Almost unchanged | Slightly increases | Increases by up to 9.8% | Almost unaffected |
| Regrind angle | Moves to top | Decreases | Increases | Increases | Increases |
| Cutting side relief angle | Insensitive | Almost unchanged | Increases | Increases by up to 9.54% | Decreases with smaller angle |
8. Experimental Validation
I perform a set of experiments to validate the mathematical model and the meshing analysis. The hypoid bevel gear set is cut on a CNC hypoid generator using the parameters in Tables 1 and 2. The gear and pinion are then measured on a gear measuring machine. The measured point set is compared with the theoretical point set generated by the mathematical model. The results are listed in Table 14.
| Surface | Maximum error (mm) | Location of maximum error | Minimum error (mm) | Location of minimum error |
|---|---|---|---|---|
| Pinion concave | 0.0075 | Toe, top | -0.0015 | Heel, root |
| Gear convex | 0.0023 | Toe, top | -0.0005 | Heel, root |
The small errors confirm that the mathematical model of the hypoid bevel gear is accurate. The theoretical tooth surface and the measured tooth surface basically coincide.
After heat treatment and lapping, I perform a rolling test on a gear rolling tester. The contact pattern from the rolling test is compared with the theoretical contact pattern calculated by a commercial gear design tool and the finite element method. The contact pattern from the finite element analysis is located at the same position and has a similar size as the theoretical contact pattern. The transmission error from the finite element analysis is closer to the measured transmission error than the theoretical TCA result. This further verifies the correctness of the tooth surface model and the loaded contact analysis model.
Table 15 compares the contact pattern and transmission error from different methods. The measured rolling test, theoretical TCA, and finite element method are all considered.
| Method | Contact pattern position | Contact pattern size | Transmission error trend |
|---|---|---|---|
| Measured rolling test | Middle of tooth, slightly toe | Medium | Reference |
| Theoretical TCA | Heel and top | Medium | Different from measured |
| Finite element method | Same as TCA, close to measured | Similar to TCA | Closer to measured |
9. Conclusions
In my work, I established a complete mathematical model for a face-hobbed hypoid bevel gear. The model is based on the ND normal datum, the three-face blade, the cutter head kinematics, and the machine tool coordinate transformations. I derived the blade equations, the meshing equation, and the tooth surface equations. Using the model, I generated the tooth surface point sets and built the solid model.
I studied the influence of tool errors on tooth surface geometry. The reference point pressure angle has the strongest influence, followed by the cutting side relief angle, the regrind angle, and the rake angle. The main cutting edge radius has a small influence. The maximum tooth surface deviation occurs near the heel and top, and the minimum deviation occurs near the toe and middle.
I built a whole vehicle axle model and computed the misalignment of the hypoid bevel gear under three load cases. The misalignment increases with load, and the pinion misalignment is the main contributor. A preset housing eccentricity reduces the offset error and the pinion axial misalignment, which improves the meshing quality.
I established a finite element contact model and analyzed the meshing characteristics under standard installation, theoretical misalignment, and preset eccentricity. Misalignment causes edge contact at the tooth top, increases the maximum contact stress slightly, decreases the contact area slightly, and increases the transmission error peak-to-peak value. Preset eccentricity reduces the transmission error peak-to-peak value.
I also studied the influence of tool errors on the meshing characteristics. The main cutting edge radius has little effect on the contact pattern. The pressure angle and regrind angle move the contact pattern from root to top. The rake angle and cutting side relief angle have little effect on the contact pattern but affect the transmission error. The cutting side relief angle has a stronger effect on the transmission error mean value than the rake angle.
Finally, I validated the model through cutting, tooth surface measurement, and rolling tests. The measured tooth surface agrees well with the theoretical tooth surface. The contact pattern from the finite element method agrees with the theoretical contact pattern, and the transmission error is closer to the measured value. These results confirm that my mathematical model and loaded contact analysis model are correct and can be used for the design and optimization of face-hobbed hypoid bevel gears.