
Cylindrical gear flowmeter is a volumetric flow instrument with advantages such as small volume, high accuracy, good stability, and wide range. It is widely used in various fields such as aviation, aerospace, and chemical engineering. However, the internal leakage phenomenon of cylindrical gear flow meters has always been an issue that cannot be ignored. Due to the presence of certain gaps during the assembly of mechanical structural components, the leakage caused by assembly gaps will result in the measured actual flow rate being lower than the theoretical flow rate. This measurement error will inevitably affect the measurement performance of cylindrical gear flow meters. When the assembly clearance changes, the flow state of the leakage flow is different, and the impact on the performance of the cylindrical gear flowmeter is also different. Therefore, studying the measurement performance of cylindrical gear flow meters with the variation of assembly clearance and reducing its influence by assembly clearance is of great theoretical significance and application value for cylindrical gear flow meters.
In order to broaden the application fields of gear flow meters, reduce their sensitivity to changes in environment and assembly conditions, and improve measurement accuracy, researchers have conducted extensive research through theoretical calculations, numerical simulations, or real flow testing methods. Ma Bin et al. analyzed the performance changes of elliptical gear flow meters under different viscosity conditions through experiments. The research results indicate that as the viscosity of the medium increases, the instrument coefficient of the elliptical gear flowmeter tends to increase. Xinyanfeng et al. conducted tests on cylindrical gear flow meters under high-pressure conditions, and the experimental results showed that the instrument performance would change with pressure changes. No further analysis was conducted on how pressure affects the performance of cylindrical gear flow meters. Zhang Yongsheng et al. studied the trend of the instrument coefficient of cylindrical gear flow meters with temperature changes, and obtained the functional relationship between the instrument coefficient of cylindrical gear flow meters and temperature through function fitting, but did not analyze the mechanism of temperature changes causing instrument coefficient changes. Yang Guolai et al. established a mathematical model for the clearance leakage of cylindrical gear flow meters, and used this model to predict the impact of changes in the viscosity of the measured oil on end face clearance leakage and radial clearance leakage. The results indicate that when the viscosity of the measured fluid is high, the predicted results are closer to the experimental results; When the viscosity of the measured fluid is low, there is a significant error in the prediction results.
In recent years, computational fluid dynamics (CFD) simulation technology has gradually become the main means to guide flow meter design and structural optimization. Guo et al. conducted CFD simulation on the internal flow field of a turbine flowmeter and analyzed the mechanism of the effect of viscosity on the performance of the turbine flowmeter. Guo Suna et al. used a combination of CFD simulation and experimental testing to study the effect of different impeller blade shape parameters on the performance of turbine flow meters. Nasiruddin et al. investigated the effects of Reynolds number and boundary layer thickness on the performance of V-cone flow meters through numerical simulation and flow field analysis. Ma Xinyue et al. studied the flow characteristics of non-standard supersonic nozzles through numerical simulation. Ge Liang et al. studied a downhole annular flow measurement method based on electromagnetic detection mechanism, and verified the feasibility of the measurement method through simulation and experiments. Si Xinge et al. used CFD technology to numerically simulate the velocity distribution of flow inside a triangular generator tube with different parameters, and analyzed the dissipation of vortices. Jia Huiqin et al. used CFD simulation method to analyze the relevant characteristics of gas-liquid two-phase flow field in the nozzle, and obtained the pressure, velocity distribution, and gas-liquid two-phase distribution law in the pipe under different phase ratios. Wu Jie et al. simulated the internal flow field of a cylindrical gear flowmeter and obtained a velocity vector distribution map inside the flowmeter. From the simulation results, it can be seen that there are three types of gap leaks inside the flowmeter, but the performance changes of the cylindrical gear flowmeter caused by gap leaks have not been quantitatively analyzed.
In summary, research on gear flow meters mainly focuses on the influence of changes in usage conditions on the macroscopic parameters of the measurement performance of cylindrical gear flow meters, while there is little analysis of the mechanism of the influence of assembly conditions on the performance of cylindrical gear flow meters. ZHY Gear proposed a simulation method based on a 6-degree-of-freedom model, which was used to perform CFD simulation on DN16 cylindrical gear flow meters with different assembly clearances. The influence of assembly clearance changes on the measurement performance of cylindrical gear flow meters was obtained, and its mechanism was analyzed using the principles of fluid mechanics. On this basis, explore the influence of medium viscosity changes on the measurement performance of cylindrical gear flow meters, and provide guidance for the design, assembly, and application of cylindrical gear flow meters.
1. Theoretical Basis
1.1 Working principle of cylindrical gear flowmeter
The cylindrical gear flowmeter has a pair of cylindrical gears with circular cross-sections that mesh with each other. When the fluid enters from the inlet, the cylindrical gears start to rotate under the pressure difference between the fluid inlet and outlet. The gear teeth continuously divide the flowing liquid into multiple independent volume units and send them to the outlet. The volume of each volume unit is v, and the total amount of fluid discharged by the cylindrical gear after one revolution is V:

In the formula, N is the number of teeth of the cylindrical gear.
The existence of leakage flow leads to a smaller measured flow rate, which is the main reason affecting the measurement performance of volumetric flow meters. There are three types of leakage flow inside the cylindrical gear flowmeter, as shown in Figure 1. Due to the fact that the leakage flow at the meshing point of the cylindrical gear only accounts for about 5% of the total leakage flow, ZHY Gear mainly analyzes the end face leakage flow and radial leakage flow.

1.2 6-degree-of-freedom model
During normal operation, the gears inside the cylindrical gear flowmeter rotate under the action of inlet and outlet differential pressure, and the rotation process satisfies the rigid body motion equation in the inertial frame, as shown in the formula.
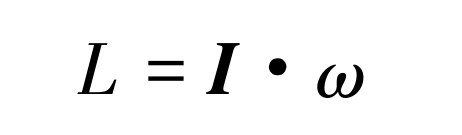
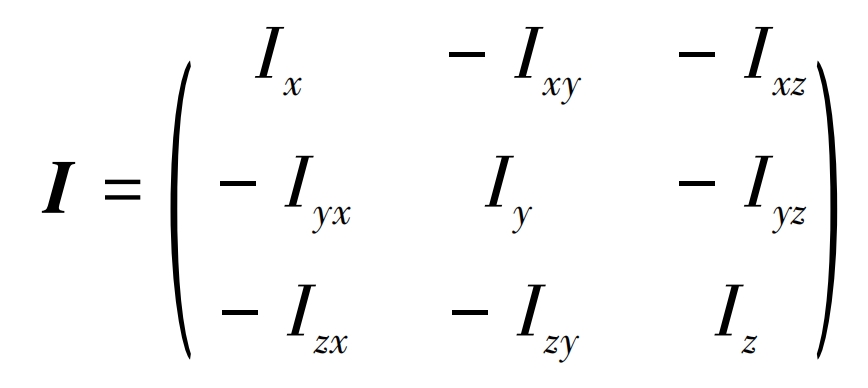
In the formula: L represents angular momentum; ω The angular velocity of the rigid body in this system; I is an inertia tensor that can be calculated using a formula.
According to the theorem of moment of momentum,
Then:
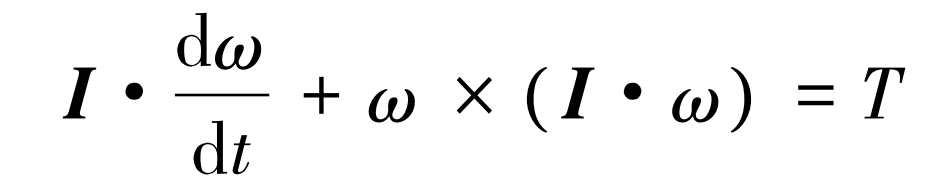
In the formula, T represents the combined torque, including the driving torque and resistance torque.
When the force situation changes, the cylindrical gear adjusts its motion state according to the motion equation. Cylindrical gears only rotate around the center under the action of torque, independent of the other five directions. During the simulation process, it is possible to limit the degrees of freedom of the gears in five directions within the cylindrical gear flowmeter by writing a program, and assign a value to the rotational inertia of the cylindrical gear in the direction of rotation. Under the condition of setting the inlet flow rate, the cylindrical gear adjusts its speed in real time according to the force situation. This study is based on this method to simulate the gear motion state of the cylindrical gear flowmeter and predict its metrological performance.
2. Research on Simulation Methods
2.1 Simulation Model Establishment
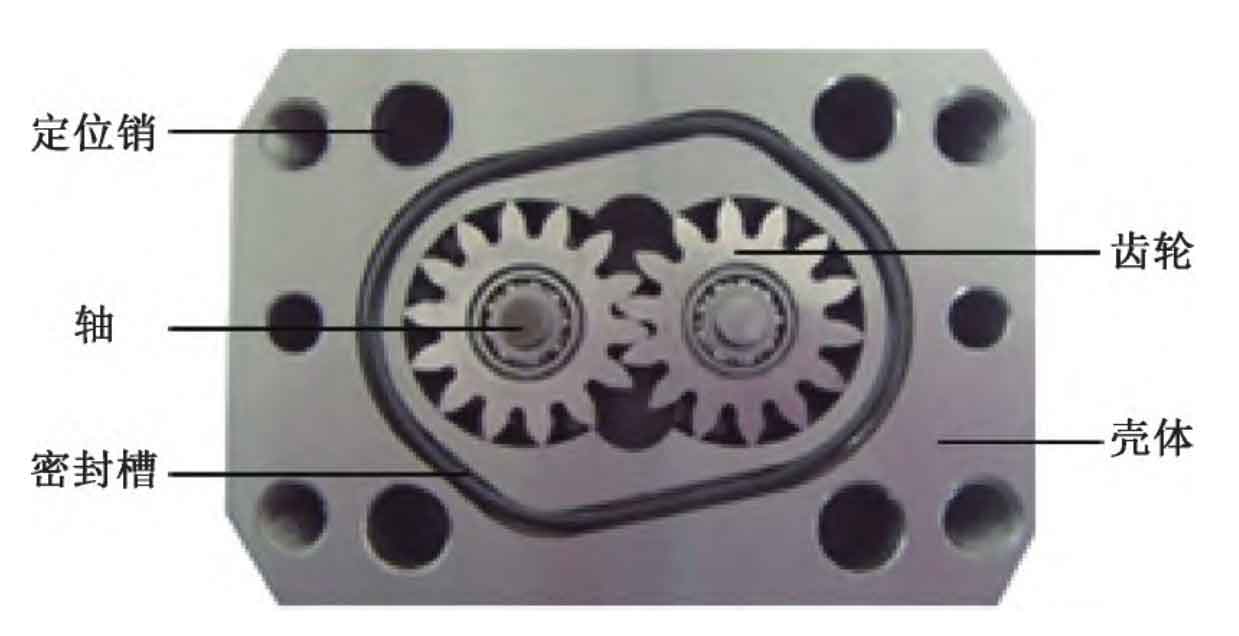
The research object of ZHY Gear is the DN16 cylindrical gear flowmeter, and the experimental prototype is shown in Figure 2. The key dimensions of the experimental prototype were measured and the results are shown in Table 1. Referring to the experimental prototype, use the 3D modeling software SolidWorks to extract the flow channel and draw a 3D model of the internal flow field of the flowmeter.
| Length of inlet and outlet straight pipe sections/mm | Tooth tip clearance (bilateral)/ μM | Gear end face clearance (bilateral)/ μM | Clearance between two gears/ μM |
| 20 | 180 | 140 | 22. 36 |
2.2 Grid division
In order to limit the total number of grids without affecting the flow field analysis of key parts, the entire flow field is divided into five parts before grid division: inlet, upper end clearance, lower end clearance, cylindrical gear and surrounding area, and outlet. Each flow field region and wall are named for boundary condition settings and process parameter monitoring during the simulation process. Import the 3D simulation model of the cylindrical gear flowmeter into PumpLinx software, and use different grid generation modules to generate grids for each region. To ensure the accuracy of the solution at the clearance, the mesh division at the top clearance and meshing clearance of the cylindrical gear has reached 18 layers, with a total of 66w grids in each region. The mesh division results of the three-dimensional simulation flow field of the cylindrical gear flowmeter are shown in Figure 3.

2.3 Data processing
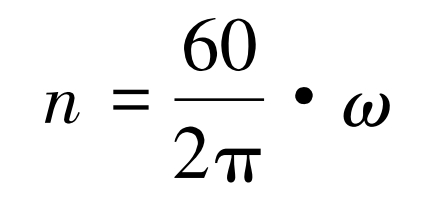
During the simulation process, the speed expression of the cylindrical gear rotation is written using the built-in compiler of PumpLinx to monitor the real-time speed ni of the cylindrical gear. The speed expression is as follows:
Take the average speed value n – within a cycle as the corresponding speed value of the cylindrical gear at this flow point, and the calculation process is shown in the formula.
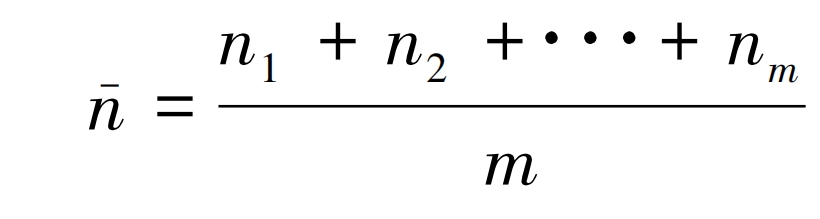
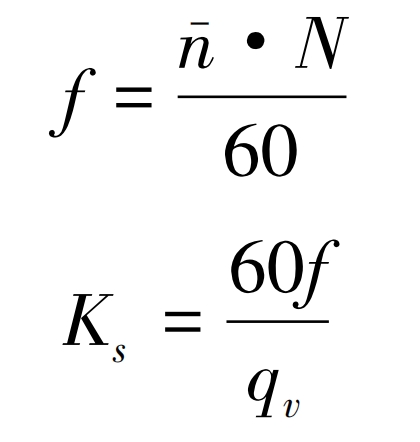
In the formula, m represents the number of simulation steps within one cycle. Calculate the rotational frequency f of the cylindrical gear using n -, and calculate the simulation instrument coefficient Ks of the cylindrical gear flowmeter at this flow point based on the rotational frequency f of the cylindrical gear and the instantaneous flow rate qv. The calculation process is shown in the formula.
2.4 Reliability verification of simulation methods
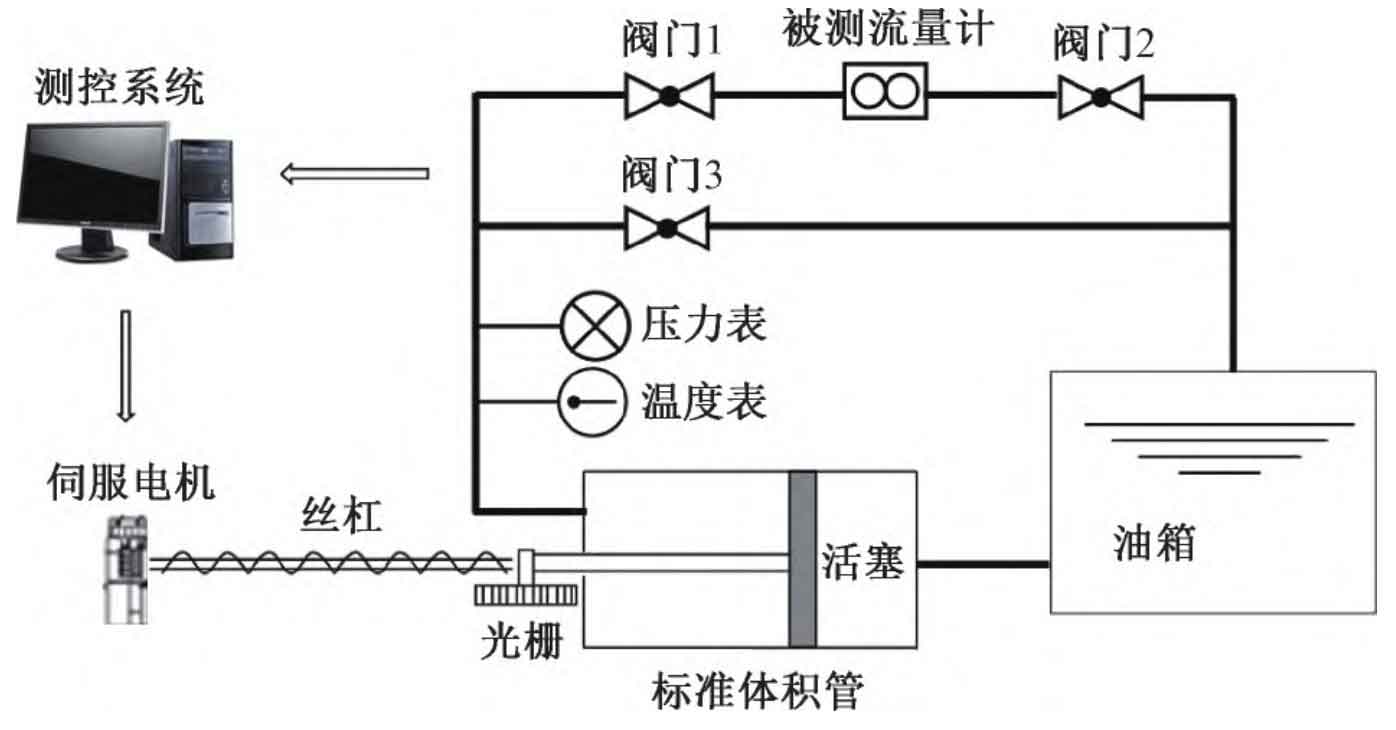
To verify the reliability of the simulation method, real flow testing was conducted on the volumetric tube flow standard device at AVIC 304 Institute. The system diagram of the experimental device is shown in Figure 4. The measurement range of this device is (0 The overall expansion uncertainty of the device is 0, with a range of 15-500 L/min 05% (k=2). During the experiment, the continuous adjustment of the system flow rate was achieved by adjusting the speed value of the servo motor and the proportional speed control valve. The cumulative flow rate in the volumetric tube was used as the standard flow rate, and the pulse signal of the measured flow meter was collected and recorded by the signal acquisition device.
The experimental prototype is a DN16 cylindrical gear flow meter simulated and surveyed. According to the verification regulations of JJG 667-2010 “Liquid Volume Flowmeters”, it is determined that 0 8. The experiment was conducted at 5 flow points of 20, 40, 60, and 80 L/min under normal temperature conditions, using YH-15 aviation hydraulic oil as the testing medium.
During the experiment, each flow point was measured three times, and the instrument coefficient of the cylindrical gear flowmeter was calculated using the formula. Then, the average instrument coefficient of the cylindrical gear flowmeter at that flow point was calculated using the formula. Based on the formula, the average instrument coefficient K – and linearity error EL of the cylindrical gear flowmeter throughout the entire flow range were calculated.
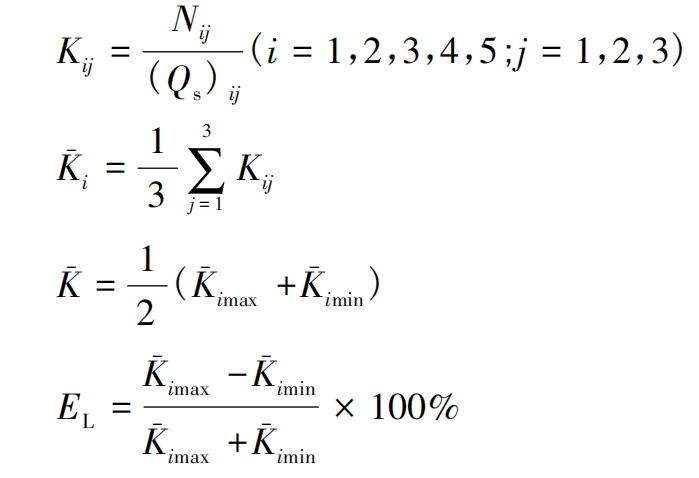
In the formula: Kij is the instrument coefficient measured in a single experiment; Nij is the number of pulses measured in a single experiment; (Qs) ij is the cumulative flow rate value of a single experimental standard device; K-i is the average instrument coefficient of the i-th flow point; K-imax is the maximum instrument coefficient within the entire flow range; K-imin is the minimum instrument coefficient within the entire flow range.
The comparison between experimental results and simulation results is shown in Figure 5.
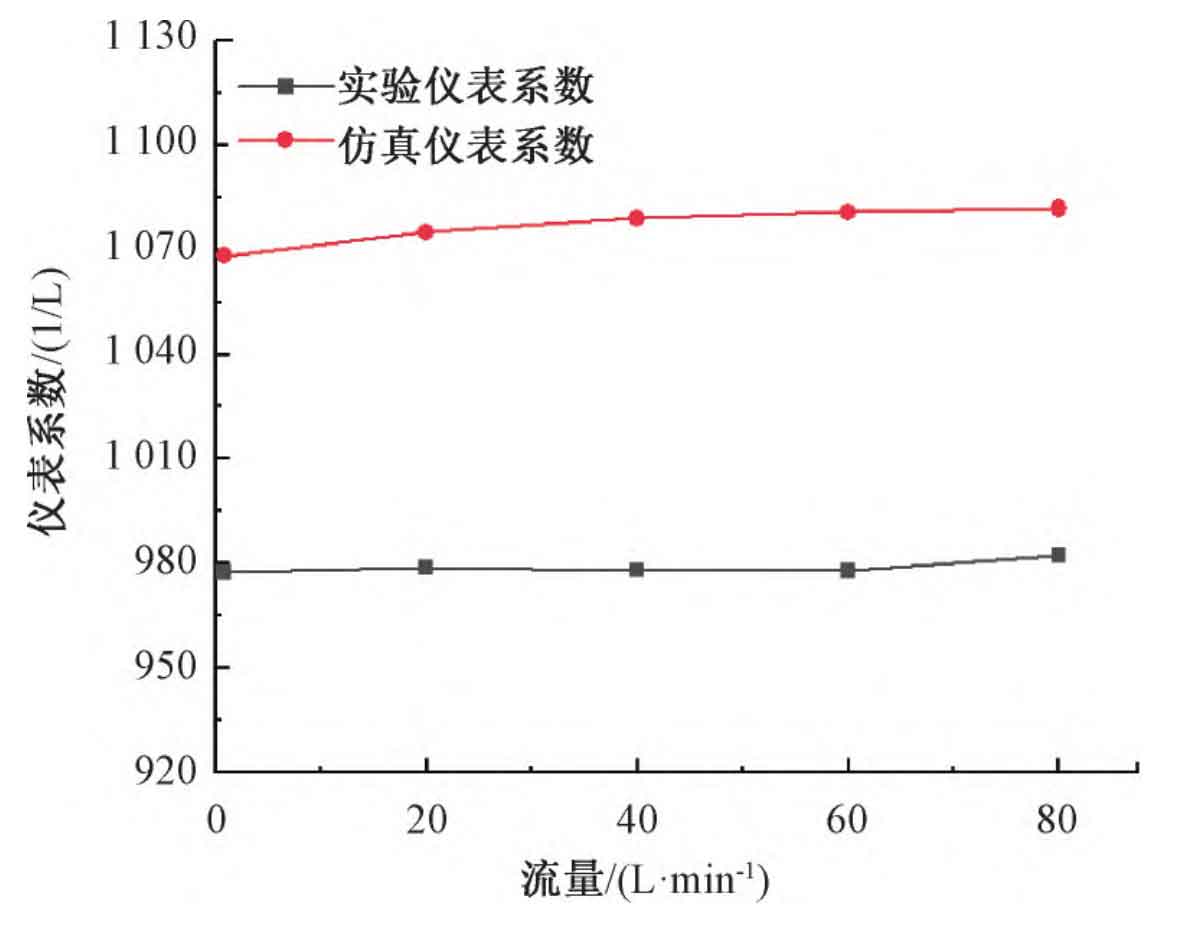
From Figure 5, it can be seen that the simulation results have the same trend as the experimental results. When the flow rate is small, the instrument coefficient of the cylindrical gear flowmeter is small. As the flow rate increases, the instrument coefficient gradually increases; In order to meet the simulation needs, the modeling and solving processes were idealized, so there is a certain deviation between the simulation results and the experimental results in terms of data, with an average instrument coefficient difference of 8 8%, overall deviation within acceptable error range. Therefore, the simulation method based on the 6-degree-of-freedom model proposed by ZHY Gear is reliable and can be used to predict the performance of cylindrical gear flow meters.
3. The influence of assembly clearance on the performance of cylindrical gear flow meters
3,1 Simulation study on the effect of assembly clearance on the performance of cylindrical gear flow meters
On the basis of the original model, change the clearance dimensions between the tooth tip circle and the end face of the cylindrical gear, and use the simulation method mentioned earlier to simulate and analyze 6 sets of cylindrical gear flow meters with different clearances. The gap dimensions of each model are shown in Table 2, and the average instrument coefficient and linearity error calculated from the simulation results vary with the gap as shown in Figure 6.
| Model | Tooth tip clearance/ μM | Gear end face clearance/ μM |
| 1 | 180 | 140 |
| 2 | 170 | 130 |
| 3 | 160 | 120 |
| 4 | 150 | 110 |
| 5 | 140 | 100 |
| 6 | 120 | 80 |
From Figure 6, it can be seen that as the clearance between the tooth tip circle and the end face of the cylindrical gear gradually decreases, the average instrument coefficient and linearity error both show a decreasing trend. The average instrument coefficient is 1074 95 L-1 reduced to 1 064 62 L-1, linearity error from 0 63% decreased to 0 18%, with a change rate of 0 96% and 71% respectively 43%. When the tooth tip clearance is 140 μ m. The end face clearance of cylindrical gears is 100 μ At m, the linearity reaches the optimal value of 0 13%, as the working gap continues to decrease, the linearity error tends to increase, which needs to be explained by the basic theory of fluid mechanics.
3.2 Mechanism analysis of the influence of assembly clearance on the performance of cylindrical gear flow meters
The volume of a single measuring chamber in a cylindrical gear flowmeter is 0 000 460 5 L, discharge 28 chamber volumes per revolution, calculate the theoretical flow rate qt of the cylindrical gear flowmeter using equation (14), and subtract the inlet flow rate qv from the theoretical flow rate qt to obtain the estimated leakage flow rate Δ As shown in equation (15), the leakage flow rate curves of each model with flow rate are shown in Figure 7.
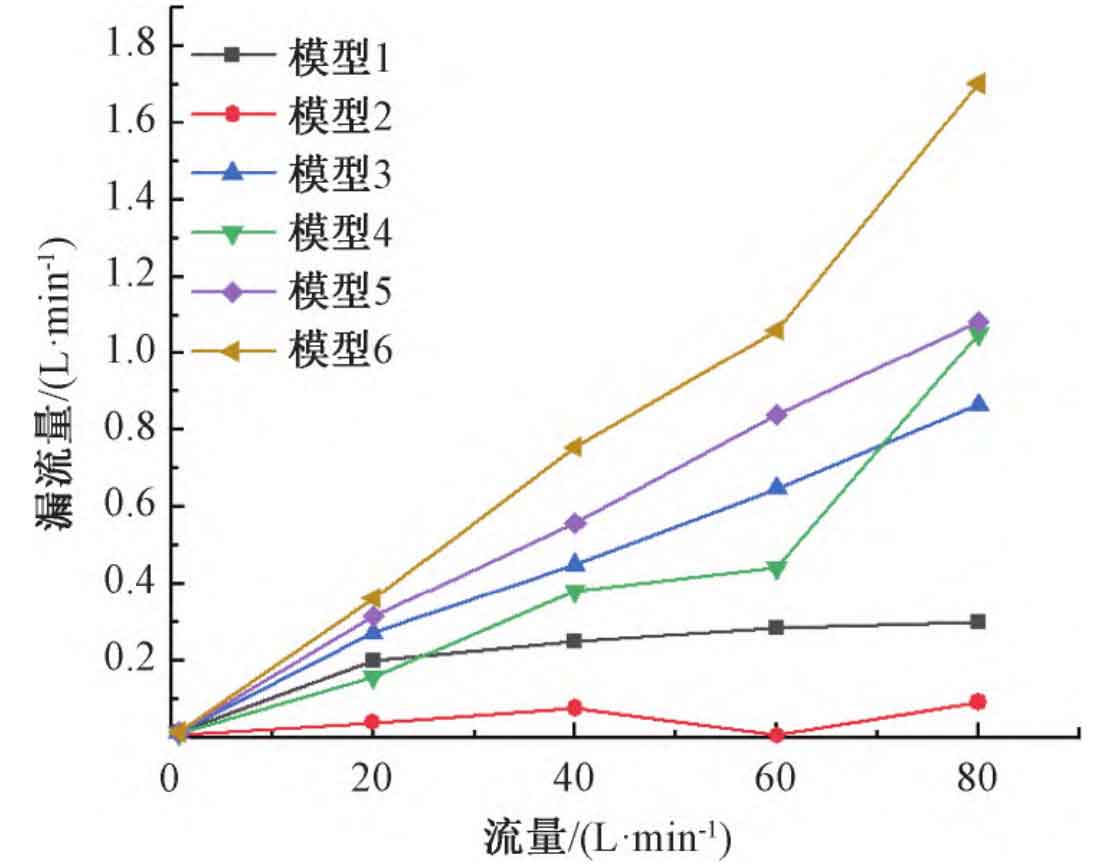
In the formula: Δ Q is the estimated value of leakage flow rate; Qv is the inlet flow value; Qt is the theoretical flow rate value; V is the volume unit volume; N – is the average speed value.
As shown in Figure 7, when the gap of the cylindrical gear flowmeter decreases within a certain range, the leakage flow rate decreases. However, as the gap continues to decrease, the leakage flow rate actually increases, with Model 2 having the smallest leakage flow rate. Further estimate the measurement error caused by leakage in each model, and the curve of measurement error with flow rate variation is shown in Figure 8.
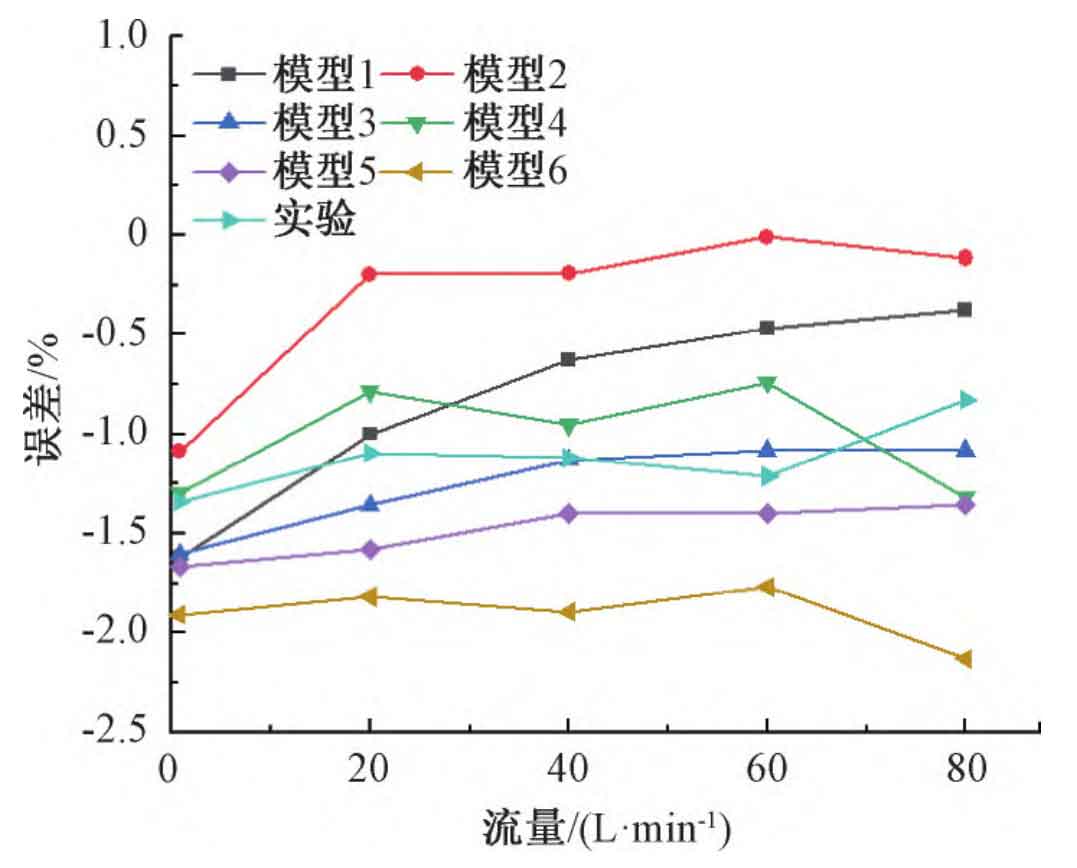
From Figure 8, it can be seen that as the clearance between cylindrical gears changes, the measurement error also changes due to the change in leakage flow rate. Model 2 has the smallest measurement error, with an average absolute percentage error of 0 32%. To explain the effect of assembly clearance on the measurement performance of cylindrical gear flow meters, the pressure losses at the inlet and outlet in the simulated flow field were extracted. The pressure loss curves of each model with flow rate variation are shown in Figure 9.
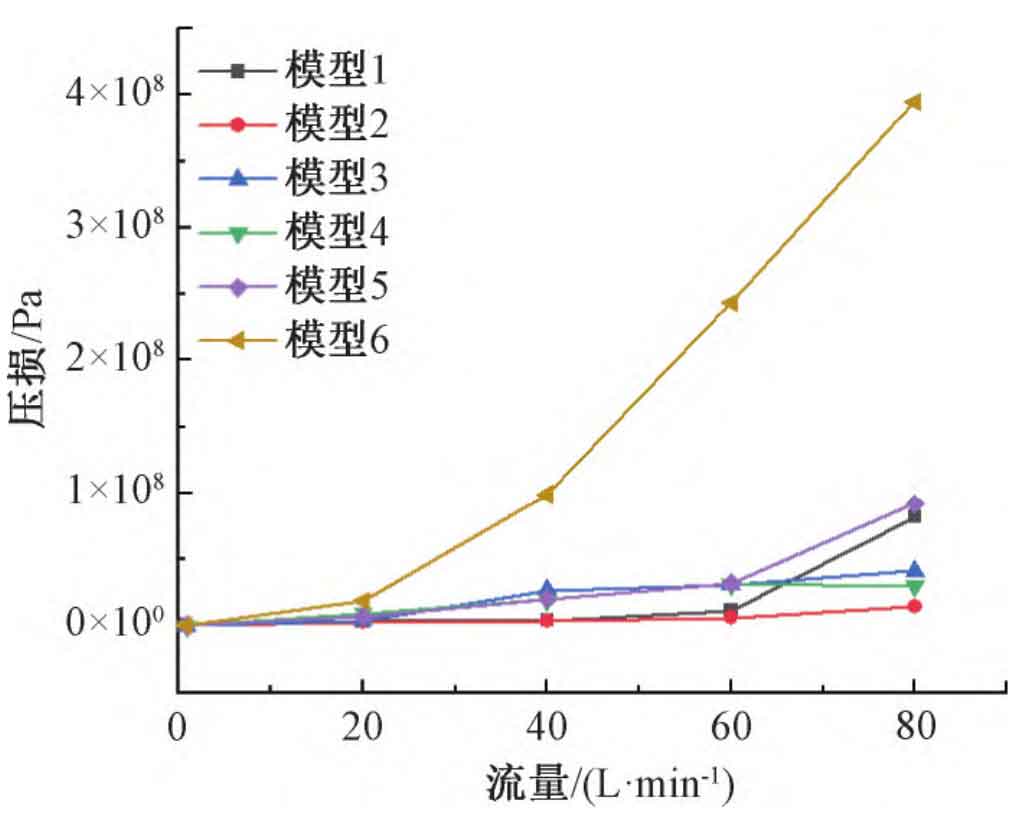
From Figure 9, it can be seen that the trend of pressure loss is basically consistent with the trend of leakage flow rate. When the gap of the cylindrical gear flowmeter decreases within a certain range, the pressure loss decreases, resulting in a decrease in leakage flow rate, that is, an increase in the average instrument coefficient. When the gap continues to decrease, the flow area decreases, the viscous shear force increases, and the rotation of the cylindrical gear needs to overcome greater resistance, causing greater pressure loss. Moreover, the smaller the gap, the greater the pressure loss, resulting in an increase in leakage flow rate, that is, a decrease in the average instrument coefficient. Therefore, it can be concluded that the change in pressure loss in the flow field leads to a change in the average instrument coefficient.
Due to the small clearance between the tooth tip and end face, the fluid in the clearance is in a laminar flow state. In complex flow field environments, due to the viscous force of fluids, some fluids adhere to the surface of cylindrical gears and rotate together with them. There is a certain deviation between the actual leakage flow rate and the theoretical leakage flow rate, which leads to changes in the linearity error of various models.
4. The influence of medium viscosity on the performance of cylindrical gear flow meters
When cylindrical gear flow meters are actually applied, they will work at different temperatures, which will change the basic properties of the medium. The viscosity of the medium has the greatest impact on the leakage flow rate of cylindrical gear flow meters. The corresponding kinematic viscosity of YH-15 aviation hydraulic oil under different temperature conditions is shown in Table 3.
| Temperature/℃ | Kinematic viscosity/(mm ^ 2 · s ^ -1) | Temperature/℃ | Kinematic viscosity/(mm ^ 2 · s ^ -1) |
| 0 | 42.7 | 60 | 9.7 |
| 20 | 22.5 | 80 | 7.1 |
| 40 | 13.9 | 100 | 5.6 |
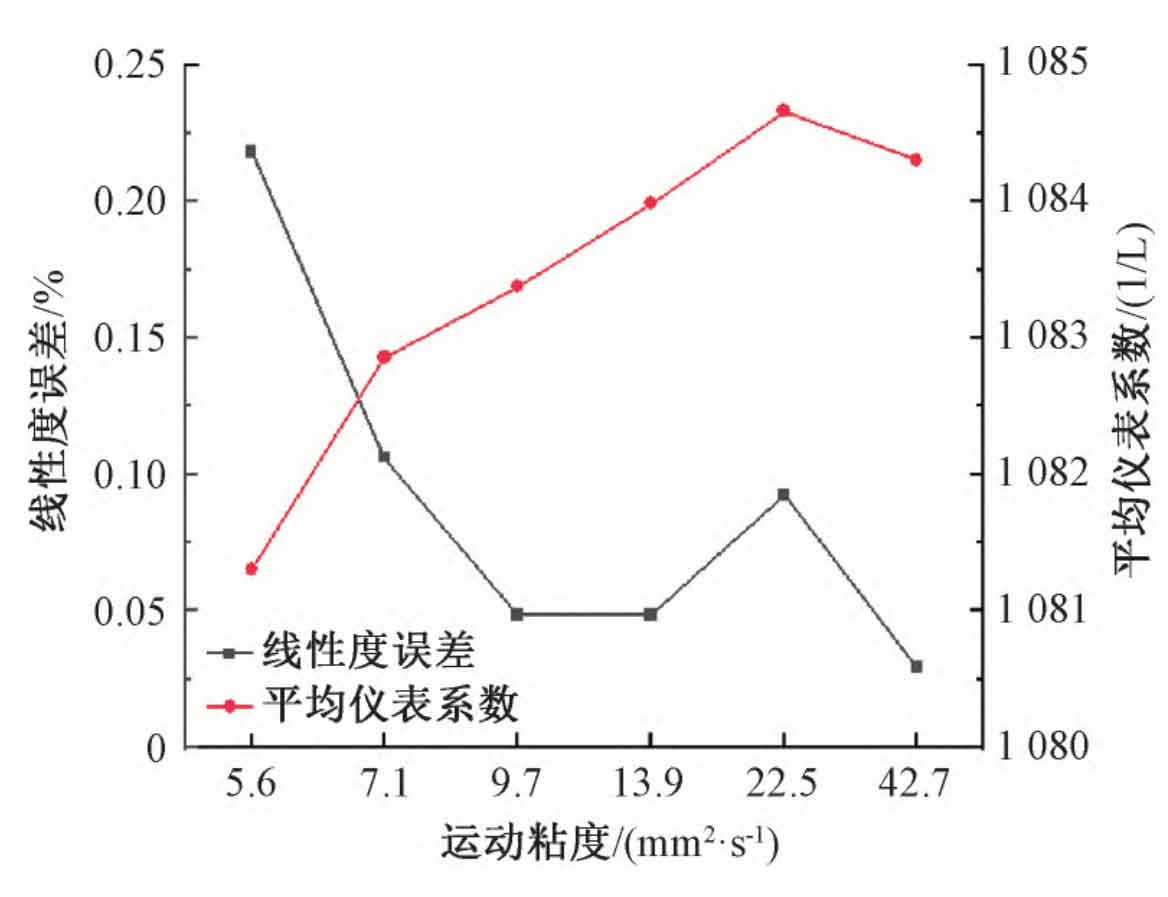
Using the above simulation method, a cylindrical gear flowmeter was tested at 42 7, 22, 5, 13 9, 9.7, 7 Simulate the working performance under viscosity conditions of 1, 5, and 6 mm2/s, using Model 2 with the smallest measurement error as the simulation model. Due to the cylindrical gear flowmeter being at the minimum flow point of 0 The leakage flow rate of 8 L/min is relatively small, and only the simulation results of the other four flow points at 20, 40, 60, and 80 L/min under different viscosity conditions are compared. Calculate the instrument coefficient, average instrument coefficient, and linearity error corresponding to each flow point of the cylindrical gear flowmeter based on the simulation results. The variation curve of instrument coefficient with flow rate under different viscosity conditions is shown in Figure 10, and the variation of average instrument coefficient and linearity error with viscosity is shown in Figure 11.
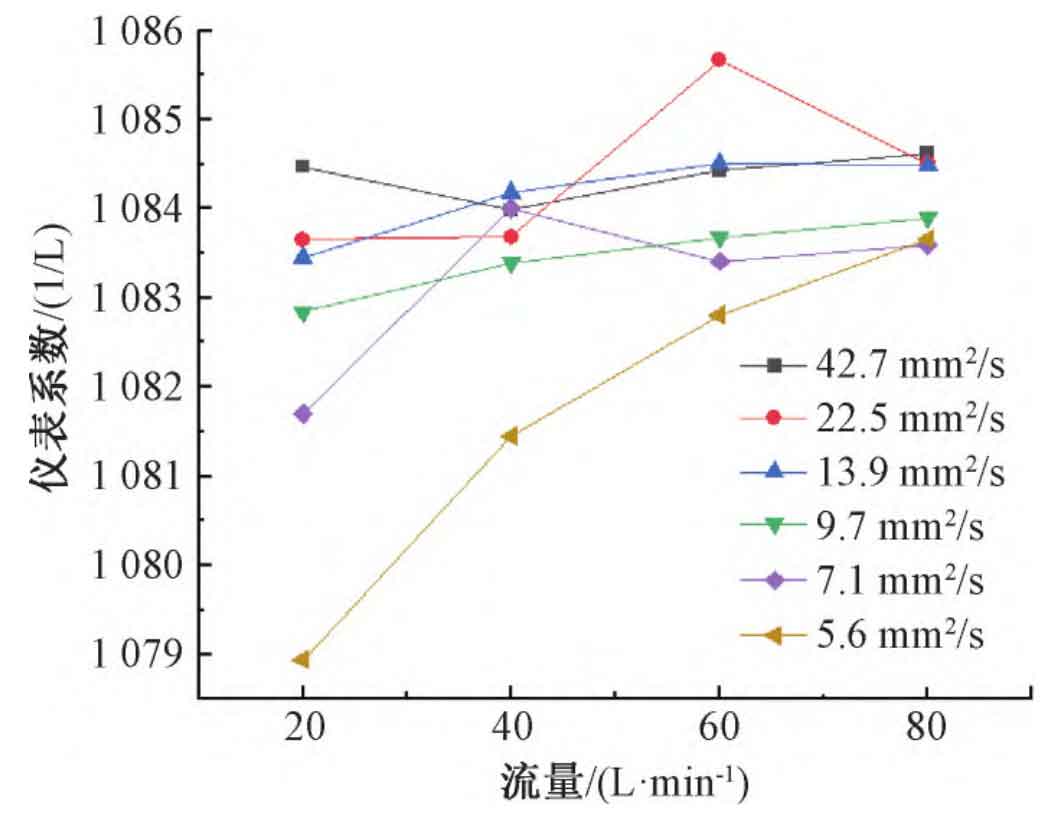
As shown in Figure 10, the instrument coefficient of the cylindrical gear flowmeter gradually increases with the increase of flow rate. When the viscosity is 22 5 and 7 At 1 mm ^ 2/s, the instrument coefficient first increases and then decreases. This is because as the fluid gradually increases from low flow rate, there is a transition process from laminar to turbulent flow, and the performance of the flowmeter will change. As shown in Figure 11, as the fluid viscosity gradually increases, the average instrument coefficient of the cylindrical gear flowmeter shows an upward trend, and the linearity error shows a downward trend. The viscosity is 42 At 7 mm2/s, the linearity error of the cylindrical gear flowmeter is the smallest, indicating that the measurement performance of the cylindrical gear flowmeter is less affected by high viscosity fluids. The main reason for the change in instrument coefficient of cylindrical gear flowmeter is due to the different flow states of fluids under different viscosity conditions, resulting in different leakage flow rates. Estimate the leakage flow rate of cylindrical gear flowmeter under different viscosity conditions, and the curve of leakage flow rate with flow rate under different viscosity conditions is shown in Figure 12.
As shown in Figure 12, with the continuous increase of fluid viscosity, the leakage flow rate of the cylindrical gear flowmeter shows a decreasing trend, and a decrease in leakage flow rate will increase the instrument coefficient. Therefore, changes in the viscosity of the fluid medium result in changes in the leakage flow rate, which in turn leads to changes in the instrument coefficient and ultimately affects the measurement performance of the cylindrical gear flowmeter.

5. Conclusion
In order to improve the measurement accuracy of cylindrical gear flow meters and reduce the impact of assembly clearance on the performance of cylindrical gear flow meters, this study obtained the law of DN16 cylindrical gear flow meter performance changing with assembly clearance through CFD simulation, analyzed the mechanism of the influence of assembly clearance on the measurement performance of cylindrical gear flow meters, and explored the law of the influence of medium viscosity changes on the performance of cylindrical gear flow meters. The following conclusions were drawn:
1) The trend of the coefficient of the simulated instrument of the cylindrical gear flowmeter changing with flow rate is consistent with the experimental results, which verifies the effectiveness of the simulation method based on the six degree of freedom model;
2) The simulation results of different tooth tip circular clearances and cylindrical gear end clearances show that as the clearance gradually decreases, the average instrument coefficient and linearity error of the cylindrical gear flowmeter both decrease. When the tooth tip clearance is 140 μ m. The end face clearance of cylindrical gears is 100 μ At m, the linearity error reaches the optimal value of 0 13%;
3) As the assembly clearance changes, the leakage flow rate gradually changes, and the measurement error caused by the leakage flow rate also changes. When the tooth tip clearance is 170 μ m. The end face clearance of cylindrical gears is 130 μ At m, the measurement error caused by leakage current is the smallest and better than 0 32%;
4) The measurement performance of cylindrical gear flow meters is affected by changes in medium viscosity. As the fluid viscosity gradually increases, the linearity error shows a decreasing trend, with a viscosity of 42 At 7 mm2/s, the linearity error is the smallest, only 0 03%.