
The experimental measurement shows that the lower threshold of fatigue crack growth is 15.29 and 5.08 when the stress ratio is 0.1 and 0.6 respectively, and the upper threshold is 64.05 and 18.757 respectively.
In the low-speed propagation stage, the stress intensity factor at the crack tip Δ K is lower than the lower threshold of fatigue crack growth of 42CrMo steel. That is, when the stress ratio r = 0.1 Δ K < 15.29, when stress ratio r = 0.6 Δ K < 5.08, the crack does not expand at this time. The curve basically develops vertically upward.


The stress intensity factor m at the crack tip increases gradually with the increase of fatigue crack generation and length. When the stress intensity factor m at the crack tip is greater than the minimum value of fatigue crack growth, that is, when the stress ratio r = 0.1, Δ K > 15.29, the stress ratio of crack is r = 0.6, Δ When k > 5.08, it starts to expand, and the stress intensity factor at the crack tip Δ The value of K also increases (consistent with what is described in Figure 1). And with the increase of M, the crack growth rate is also increasing. The stable fatigue crack growth stage is the most important part of the study of fatigue crack growth. After logarithmicizing the data of fatigue crack growth rate and crack tip stress intensity factor, it can be clearly found that the image curve shows a good linear relationship. It is a prediction of the remaining life of structural components. Paris law describes the relationship between the two at this stage, and its formula is:

Where, a – crack length, mm; N – fatigue cycle; Da / dN – crack growth rate, mm / cycle; K – amplitude of stress intensity factor, MPA · M1 / 2; C. M – material constant.
The formula can be obtained by taking logarithms on both sides of the formula at the same time.

The stress intensity factor at the crack tip and the fatigue crack growth rate in the stable growth stage in the experimental data with r = 0.1 are logarithmicized, and then fitted with origin, as shown in Fig. 2 (a). It can be seen that the logarithm of the two shows a good linear relationship, with a slope of M and an intercept of LGC.


In Fig. 2 (a), the intercept of the fitting line is LGC = – 7.22, the slope is m = 2.30, and the correlation coefficient is r = 0.9924. At this time, when the stress ratio r = 0.1, the crack propagation equation describing the stable propagation stage of 42CrMo steel compact tensile specimen can be obtained by calculation.

When the formula is converted to Paris formula, it is:

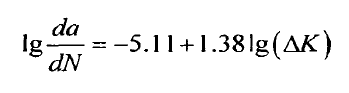
The stress intensity factor at the crack tip and the fatigue crack growth rate in the stable growth stage in the experimental data with r = 0.6 are logarithmicized, and then fitted with origin, as shown in Fig. 2 (a). It can be seen that the logarithm of the two shows a good linear relationship, with a slope of M and an intercept of LGC.
In Fig. 2 (b), the intercept of the fitting line is LGC = – 5.11, the slope is m = 1.38, and the correlation coefficient is r = 0.9397. At this time, when the stress ratio r = 0.6 can be obtained through calculation, the crack propagation equation describing the stable propagation stage of 42CrMo steel compact tensile specimen is the formula.
When the formula is converted to Paris formula, it is:
