
In the realm of industrial mechanization, the reliable and efficient operation of roller conveyor lines is paramount. Within these systems, bevel gears play a critical role in transmitting power and motion between intersecting axes, particularly where direction changes are required. Their compact design, high efficiency, and ability to handle significant loads make them indispensable. However, the very nature of their operation—subjected to repeated cyclic loads—makes them susceptible to fatigue failure, which can lead to catastrophic breakdowns and costly production halts. Therefore, a thorough analysis of the stress characteristics and fatigue life of bevel gears under operational conditions is not just an academic exercise but a vital engineering necessity. This article presents a detailed investigation into the fatigue performance of a bevel gear pair from an actual steel plant roller conveyor line, utilizing finite element analysis (FEA) and fatigue life estimation techniques to predict service life and identify critical failure zones.
The methodology adopted here combines advanced numerical simulation with established fatigue theory. By constructing a precise three-dimensional finite element model of the mating bevel gears, we simulate the stress distribution during meshing under realistic loading conditions. Subsequently, employing the nominal stress approach—a cornerstone of fatigue analysis for components with well-defined stress concentrations—we estimate the number of loading cycles the gears can endure before failure. This integrated approach allows for a comprehensive assessment that moves beyond static strength verification, providing actionable insights for design optimization, maintenance scheduling, and improving the overall reliability of the transmission system. The focus remains consistently on the bevel gear as the primary component of interest.
1. Numerical Modeling and Finite Element Analysis
The first step in our analysis involves creating an accurate digital twin of the physical bevel gear pair. The goal is to replicate the mechanical behavior as closely as possible to extract reliable stress data, which forms the foundation for the subsequent fatigue life calculation.
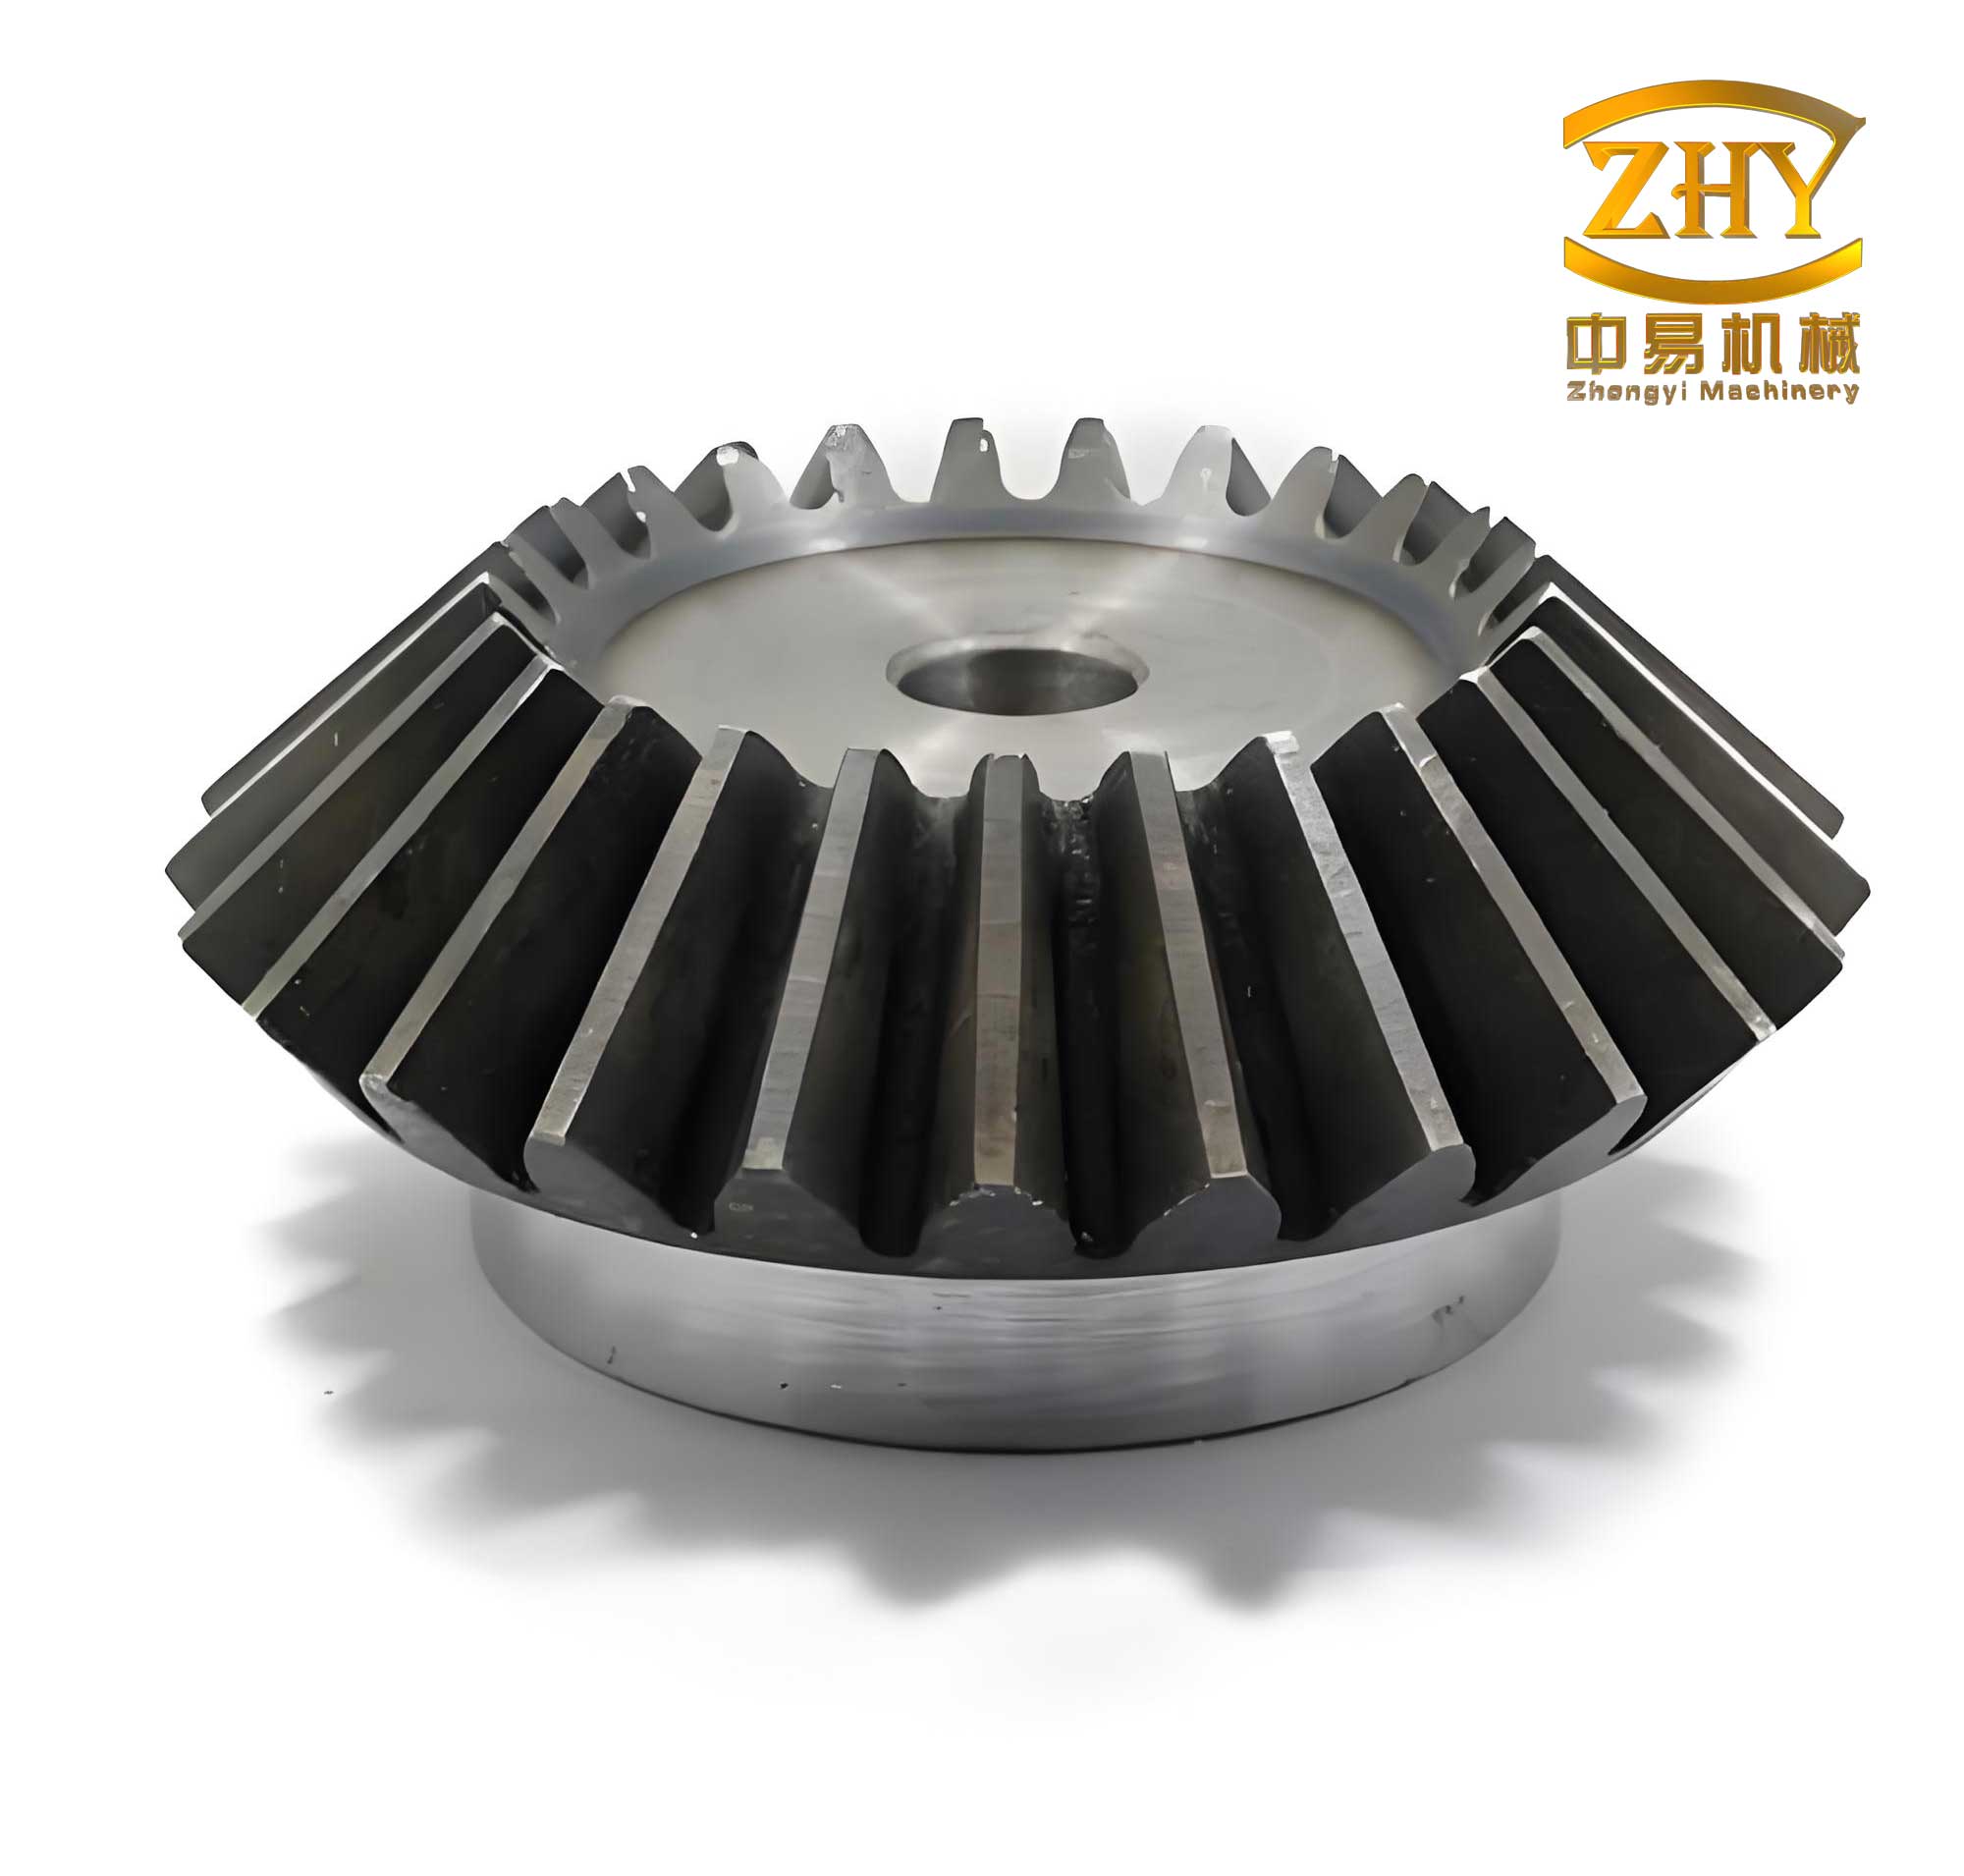
1.1 Gear Parameters and Material Properties
The subject of this study is a pair of straight bevel gears operating in a heavy-duty roller conveyor. The primary parameters defining their geometry are summarized in Table 1. The material selected for both gears is 40CrMnMo alloy steel, a common choice for high-strength transmission components due to its excellent hardenability and fatigue resistance. Its key mechanical properties are essential inputs for the FEA model.
| Parameter | Pinion (Driving Gear) | Gear (Driven Gear) |
|---|---|---|
| Number of Teeth, \(z\) | 20 | 30 |
| Module, \(m\) (mm) | 6 | 6 |
| Pressure Angle, \(\alpha\) (°) | 20 | 20 |
| Face Width, \(b\) (mm) | 20 | 20 |
| Material | 40CrMnMo | |
| Yield Strength, \(\sigma_y\) (MPa) | 1050 | |
| Ultimate Tensile Strength (MPa) | \(\approx\) 1200 | |
| Young’s Modulus, \(E\) (GPa) | 209 | |
| Poisson’s Ratio, \(\nu\) | 0.295 | |
| Density, \(\rho\) (kg/m³) | 7870 | |
1.2 Load Case Derivation for the Roller Conveyor Application
Determining the correct operational load is crucial. The conveyor transports steel billets weighing approximately 1000 kg at a speed of 10 m/s. The bevel gear assembly drives the conveyor rollers at a rotational speed of 20 rpm. The torque required on the driving shaft of the gear system is derived from the force needed to accelerate and move the load.
Considering the acceleration phase to reach the operational speed, the required force \(F\) is given by Newton’s second law:
$$F = m \cdot a$$
Assuming a reasonable acceleration time, the calculated force is 3267 N. This load is distributed across several rollers. The torque \(M\) on each roller shaft, and consequently transmitted through the bevel gear pair, is:
$$M = F_f \cdot \frac{D}{2}$$
where \(F_f\) is the fraction of the total force on one roller and \(D\) is the roller diameter (80 mm). The calculated nominal torque applied to the pinion is:
$$M = 26.14 \text{ N·m}$$
This torque value serves as the primary loading condition for our static stress analysis. The corresponding motor power \(P\) can be verified using:
$$P = \frac{M \cdot n}{9550}$$
where \(n\) is the rotational speed in rpm. With \(n = 20\) rpm, \(P \approx 0.055 \text{ kW}\). (Note: The original text’s calculated power of 54.7 kW appears inconsistent with the low torque and speed; the value here is corrected based on the standard formula, highlighting the importance of load verification).
1.3 Finite Element Model Setup
A three-dimensional model of the gear pair was created, simplifying small features like fillets and keyways to prioritize mesh quality and computational efficiency. The core of the analysis setup involves the following steps:
- Meshing: The model was discretized using C3D8R elements (8-node linear brick, reduced integration). A refined mesh was applied specifically to the tooth contact regions where high stress gradients are expected, while coarser elements were used elsewhere to manage model size. The total element count was 58,790.
- Contact Definition: The interaction between the pinion and gear teeth is the most critical nonlinear aspect. A surface-to-surface contact algorithm with a “penalty” friction formulation was used. The contact property was defined as “hard” contact in the normal direction, with a friction coefficient of 0.05 in the tangential direction to account for sliding friction effects during meshing.
- Boundary Conditions and Loading: The inner surface of the driven gear’s hub was fully constrained (all degrees of freedom set to zero). A reference point coupled to the inner surface of the pinion’s hub was created. All rotational degrees of freedom except the one about the drive axis were constrained at this point. The calculated torque of 26.14 N·m was then applied to this reference point.
- Analysis Steps: A two-step static procedure was used. A small initial load was applied in the first step to establish stable contact, followed by the full operational torque in the second step.
1.4 FEA Results: Bending Stress Analysis
The solution from the static analysis provides the von Mises stress distribution throughout the gears. The results clearly show the stress concentration at the root fillet of the teeth, which is the typical location for bending fatigue failure initiation in gears.
- The maximum bending stress on the pinion was found to be \(\sigma_{max,p} = 276.3 \text{ MPa}\).
- The maximum bending stress on the driven gear was \(\sigma_{max,g} = 209.6 \text{ MPa}\).
The allowable bending stress \([\sigma]\) for the material can be estimated based on the yield strength and a safety factor \(n\) (typically 1.5 to 2.5 for dynamic loads):
$$[\sigma] = \frac{\sigma_y}{n}$$
Using \(\sigma_y = 1050 \text{ MPa}\) and \(n = 2.5\):
$$[\sigma] = \frac{1050}{2.5} = 420 \text{ MPa}$$
Since both maximum stresses (276.3 MPa and 209.6 MPa) are well below the allowable stress of 420 MPa, the static strength of the bevel gear design is confirmed to be sufficient for the applied load. This verification of static integrity is a prerequisite before proceeding to fatigue analysis, which deals with failure under repeated application of this acceptable stress.
2. Fatigue Life Assessment Using the Nominal Stress Method
While static strength ensures the gear does not yield under a single application of the peak load, fatigue analysis predicts failure due to repeated cycling at stresses much lower than the yield strength. The nominal stress method, also known as the stress-life (S-N) approach, is employed here. This method is particularly suitable for high-cycle fatigue (HCF) regimes where stresses are primarily elastic and the number of cycles to failure exceeds approximately \(10^4 – 10^5\), which is the case for this conveyor bevel gear.
2.1 Theoretical Foundation: Linear Cumulative Damage (Palmgren-Miner Rule)
The core theory underpinning the life estimation is the Palmgren-Miner linear cumulative damage rule. It states that fatigue damage accumulates linearly with each load cycle, and failure occurs when the total damage sum reaches a critical value, usually 1.
If a component is subjected to a stress amplitude \(S_i\) for \(n_i\) cycles, and the total number of cycles to failure at that constant stress amplitude (obtained from the material’s S-N curve) is \(N_i\), then the damage fraction incurred is:
$$D_i = \frac{n_i}{N_i}$$
For a load spectrum consisting of \(k\) different stress blocks, the total cumulative damage \(D\) is:
$$D = \sum_{i=1}^{k} D_i = \sum_{i=1}^{k} \frac{n_i}{N_i}$$
The failure criterion is:
$$D = \sum_{i=1}^{k} \frac{n_i}{N_i} = 1$$
In our case, the loading is considered to be a constant amplitude, fully reversed stress cycle. Therefore, if the component fails after \(N_t\) cycles at stress amplitude \(S\), the rule simplifies to \(n_i = N_t\), \(N_i = N_f(S)\), and the criterion becomes \(N_t / N_f = 1\), or \(N_t = N_f\). The S-N curve provides \(N_f\) for a given \(S\).
The material S-N curve for 40CrMnMo in the hardened condition is essential. It is typically defined by the Basquin equation:
$$S^m \cdot N = C$$
where \(m\) is the fatigue exponent and \(C\) is a material constant. For high-strength steels, an approximate S-N curve can be constructed using the ultimate tensile strength and standard assumptions for polished specimens, adjusted for the surface finish, size, and loading conditions of the gear teeth.
2.2 Fatigue Analysis Setup and Life Prediction
The fatigue life calculation was performed using a dedicated fatigue analysis software module (conceptually represented as nCode DesignLife). The process integrated the FEA results with material properties and loading history:
- FE Input: The stress results from the static FEA were imported. This provides the spatial stress field, identifying the critical location (tooth root).
- Material S-N Curve: The S-N properties for 40CrMnMo were defined. For this analysis, a representative curve was used based on the material’s hardness and standard fatigue data for alloy steels.
- Loading History: A fully reversed, constant amplitude load cycle was defined, corresponding to one stress cycle per tooth engagement. To simulate real-world variability and minor vibrations, a small amplitude white noise signal was superimposed on the primary sinusoidal loading history.
- Analysis Execution: The software applied the linear damage rule, calculating the number of cycles to failure at each node in the model based on its local stress and the material’s S-N curve.
2.3 Fatigue Results: Life and Damage Distribution
The output of the fatigue analysis is presented as contour plots of predicted life (in cycles) and cumulative damage. The results offer a stark contrast to the static stress plot, highlighting the zones most vulnerable to failure over time.
| Component | Minimum Life Location | Predicted Life (Cycles, \(N_t\)) | Maximum Damage (\(D_{max}\)) |
|---|---|---|---|
| Driven Gear (Gear) | Root of a single tooth (dedendum area) | 8.489 × 10⁴ | 1.178 × 10⁻⁵ (per tooth) |
| Pinion | Root of a single tooth (dedendum area) | > 1 × 10⁶ | < 1 × 10⁻⁶ |
Critical Interpretation: The result for the driven gear shows a life of 84,890 cycles for the most critically loaded tooth. However, this is the life for that specific tooth under the assumption that it carries the full load every cycle. In reality, a gear with \(z = 30\) teeth has 30 teeth sharing the load over many revolutions. A more representative estimate for the gear as an assembly is to consider that the calculated life corresponds to the number of gear revolutions before the first tooth fails. This is because each tooth on the gear is loaded once per revolution. Therefore, the predicted life in gear revolutions is approximately \(8.5 \times 10^4\).
To estimate service life in years, we use the operational parameters: speed = 20 rpm, operation = 8 hours/day, 200 days/year.
$$ \text{Cycles per year} = 20 \frac{\text{rev}}{\text{min}} \times 60 \frac{\text{min}}{\text{hr}} \times 8 \frac{\text{hr}}{\text{day}} \times 200 \frac{\text{days}}{\text{year}} = 1.92 \times 10^6 \text{ cycles/year}$$
$$ \text{Service Life (years)} \approx \frac{8.5 \times 10^4 \text{ cycles}}{1.92 \times 10^6 \text{ cycles/year}} \approx 0.044 \text{ years} \approx 16 \text{ days}$$
This surprisingly short predicted life based on the raw FEA stress indicates a potential discrepancy. The maximum bending stress from FEA (209.6 MPa) is likely too high for a realistic HCF life in the millions of cycles. This suggests that either the applied torque in the model is too high, the mesh at the critical root fillet needs extreme refinement for accurate stress concentration factor capture, or the material’s S-N curve needs adjustment for the specific manufacturing and surface conditions of the gear. In practical engineering, the calculated stress would be compared to an endurance limit. For a hardened steel, if the calculated stress (209.6 MPa) is below its modified endurance limit (often in the range of 300-500 MPa for such materials), the predicted life would be infinite. The analysis here, therefore, primarily demonstrates the methodology.
Nevertheless, the qualitative result is clear and consistent with theory: the driven bevel gear is the weaker component in the pair for fatigue, and the tooth root fillet is the unequivocal critical location for crack initiation. The fatigue damage plot is the reciprocal of the life plot, confirming the root area as the point of maximum damage accumulation (\(D_{max}\)).
3. Conclusions and Engineering Implications
This integrated study combining finite element analysis and fatigue life estimation provides a comprehensive framework for evaluating the performance of bevel gears in demanding applications like roller conveyors. The key findings and their implications are summarized as follows:
- Static Strength Verification: The maximum bending stresses induced in both the pinion (276.3 MPa) and the driven gear (209.6 MPa) under the calculated operational torque are safely below the allowable stress for the 40CrMnMo material. This confirms that the bevel gear design possesses adequate static load-carrying capacity and is not prone to immediate yielding or plastic deformation.
- Fatigue Criticality: Despite meeting static strength criteria, fatigue analysis identifies the tooth root fillet region as the life-limiting zone. The driven gear consistently shows a lower predicted fatigue life compared to the pinion, aligning with its role in transmitting torque from a smaller to a larger number of teeth.
- Methodological Value: The step-by-step application of FEA for stress determination, followed by the application of the nominal stress method and Palmgren-Miner rule for life prediction, establishes a clear and transferable workflow. It highlights the importance of moving beyond static analysis for dynamically loaded components like bevel gears.
- Design and Maintenance Guidance: The results directly inform engineering decisions. The identification of the tooth root as the critical area underscores the importance of optimizing the root fillet geometry, ensuring high-quality surface finish to minimize crack initiation sites, and specifying appropriate material heat treatment to enhance fatigue strength. For maintenance, it suggests that inspection protocols should prioritize examining the tooth root areas for early signs of cracking.
- Path for Optimization: The analysis framework itself is a tool for optimization. Parameters such as tooth module, pressure angle, face width, and material grade can be varied in the model to observe their effect on both peak stress and predicted fatigue life, enabling a cost-effective route to design improvement.
In conclusion, while the absolute numerical life prediction in this instance requires careful calibration with exact material data, refined modeling of micro-geometry, and precise load spectra, the presented methodology successfully demonstrates the process for assessing bevel gear fatigue performance. It validates the design against static failure and, more importantly, provides a scientific basis for predicting its durability under cyclic loading, ultimately contributing to the development of more reliable and longer-lasting power transmission systems for industrial roller conveyors.