
In modern industrial automation, the operational stability of industrial robots is paramount, directly impacting production efficiency and cost-effectiveness. The RV reducer, a core transmission component, plays a critical role in ensuring precise motion and load-bearing capacity. Its failure can lead to significant downtime and economic loss. Therefore, developing advanced, accurate, and reliable fault diagnosis methods for the RV reducer is a crucial research direction for predictive maintenance and improving robotic system reliability. With advancements in information processing technology, the automation level of electromechanical control equipment has significantly improved, demanding higher standards for the operational monitoring and fault diagnosis of industrial robots. To meet these demands, the introduction of deep learning algorithms has become essential for more accurately diagnosing fault signals from equipment containing complex components like the RV reducer.
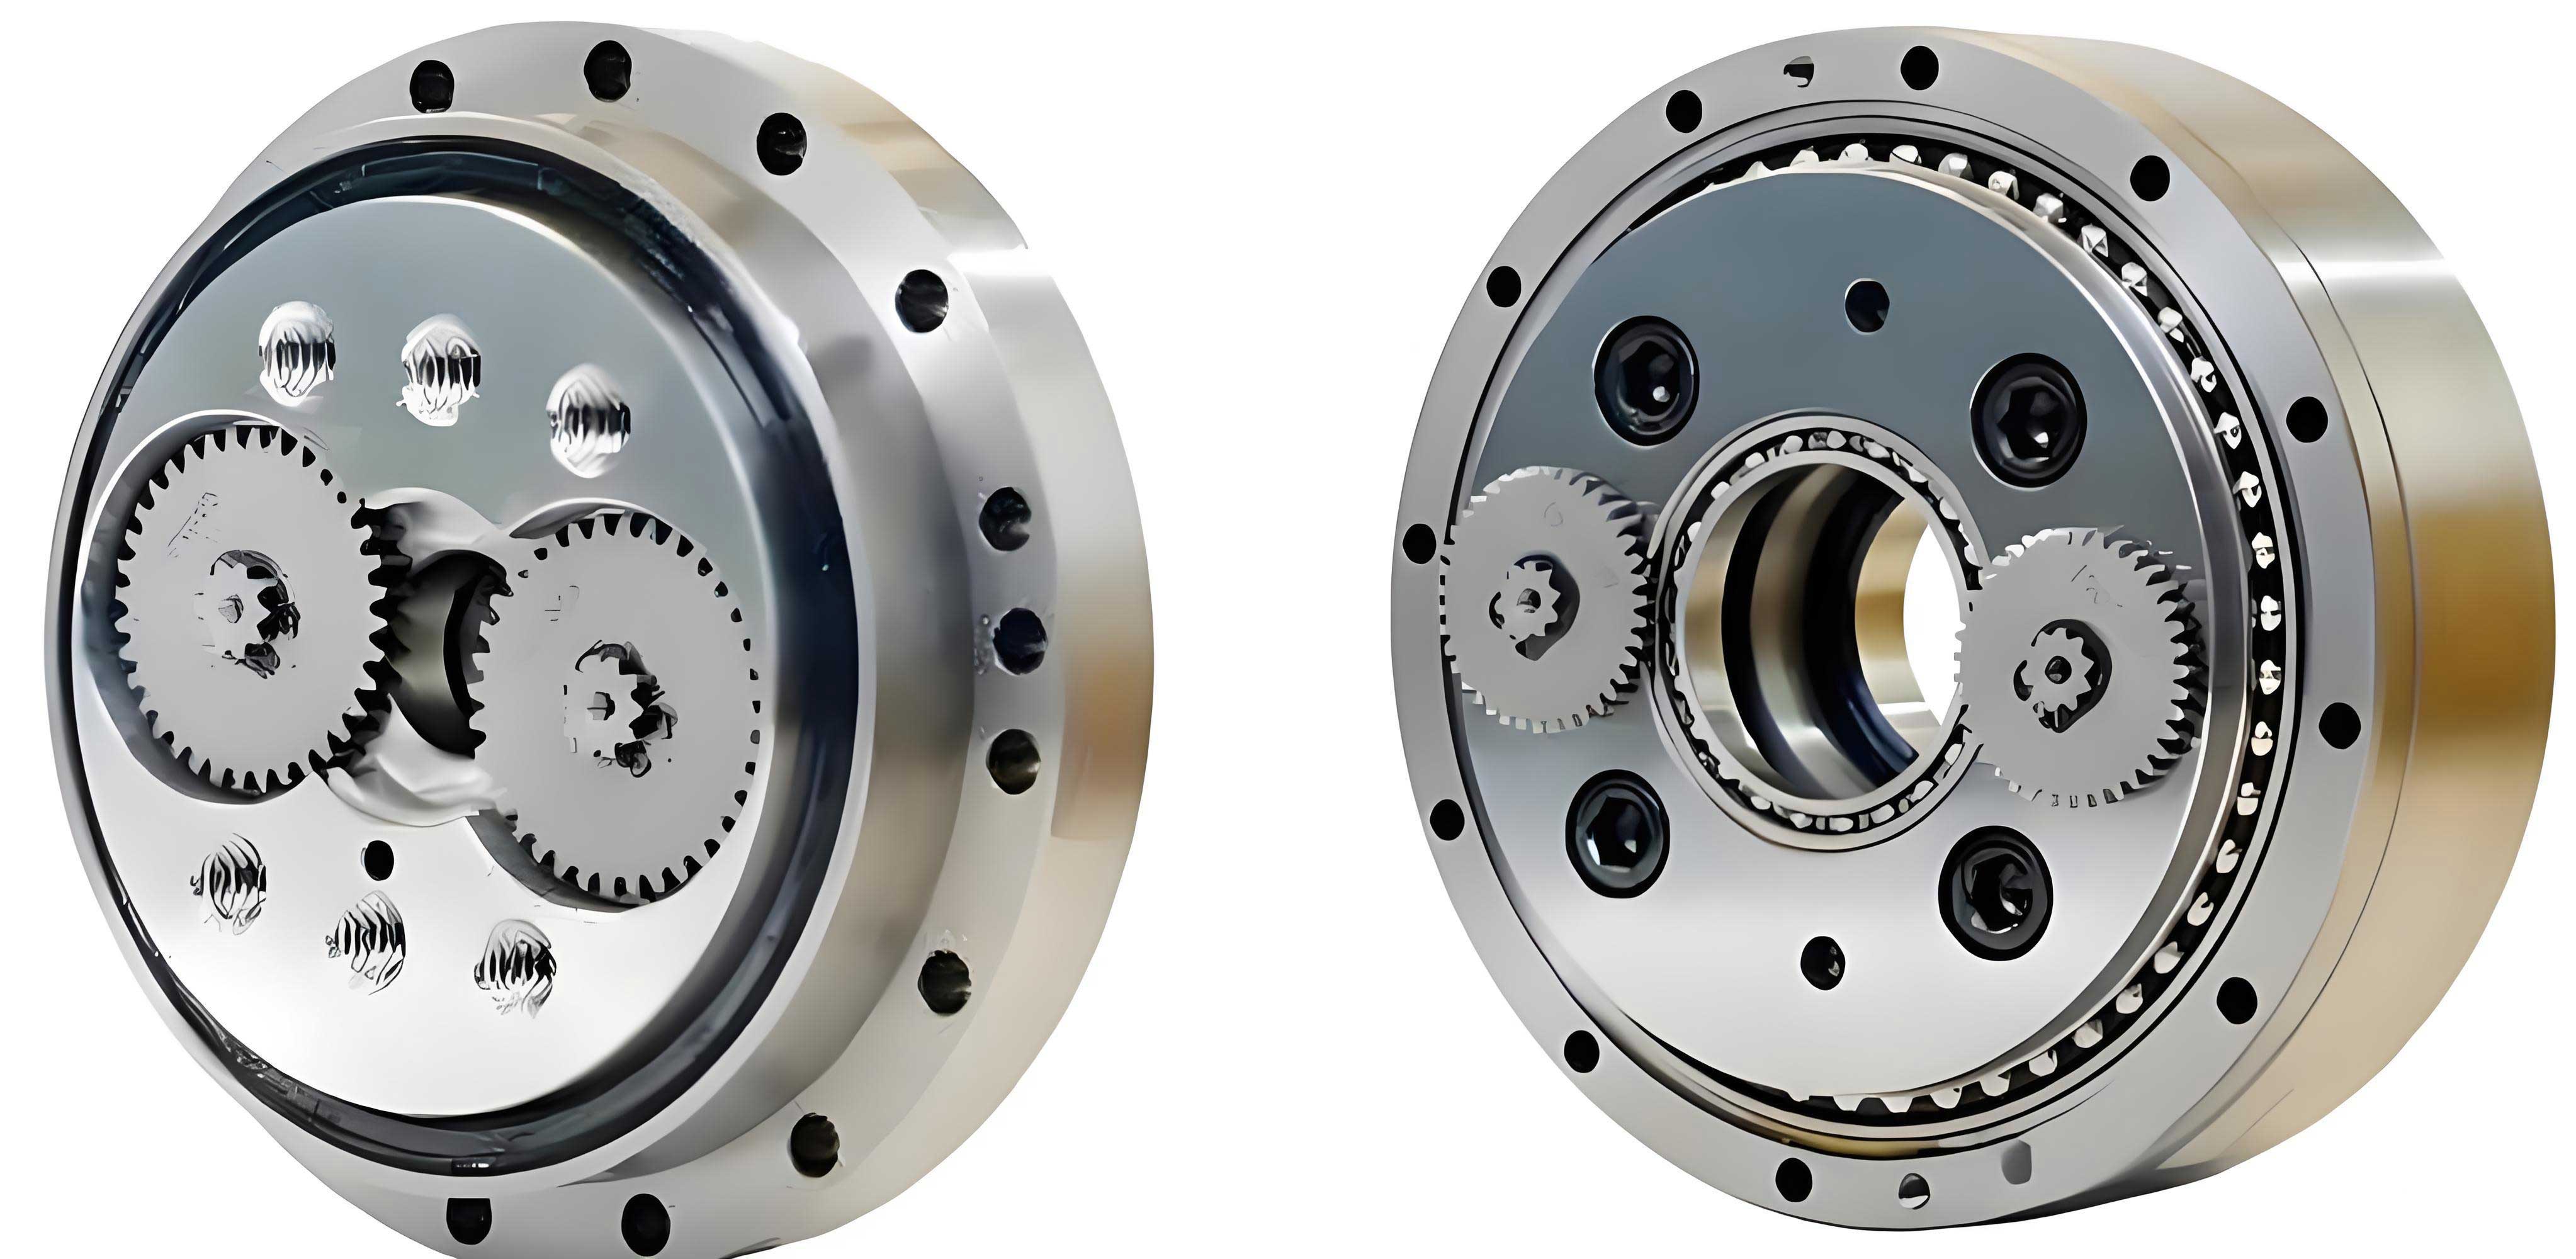
Deep Belief Networks (DBNs), with their ability to learn hierarchical feature representations from raw data, offer significant potential for enhancing fault diagnosis accuracy due to their adaptability to time-varying signals. Research in this area has attracted considerable attention. For instance, improved DBN methods incorporating attention mechanisms and cosine loss functions have been proposed to enhance gearbox fault diagnosis accuracy under varying operational conditions. Other studies have explored transfer learning with DBNs, utilizing a small number of labeled target samples to fine-tune the network and improve fault recognition accuracy. Furthermore, the use of optimizers like Adam in the fine-tuning stage of DBNs has been shown to accelerate model convergence and improve classification performance.
However, diagnosis based on a single measurement point from the RV reducer can be susceptible to noise, sensor placement errors, or localized signal masking, potentially limiting diagnostic reliability. To overcome this limitation, this paper proposes a multi-measurement point fusion fault diagnosis framework for the industrial robot RV reducer, integrating the Dempster-Shafer (DS) evidence theory with Deep Belief Networks (DBN). The proposed DS-DBN method synergizes the powerful feature learning capability of DBNs with the robust information fusion ability of DS theory, aiming to achieve superior diagnostic accuracy and confidence by synthesizing evidence from multiple sensor locations on the RV reducer.
Methodology: The DS-DBN Fusion Framework
The overall diagnostic process of the proposed DS-DBN framework is illustrated conceptually. It involves data collection from multiple pre-defined measurement points on the RV reducer, individual DBN-based diagnosis for each point, and final decision fusion using DS evidence theory. The mathematical formulation of this process is detailed below.
1. System Architecture Based on Fault Types
The first step involves analyzing the potential fault types of the RV reducer (e.g., normal operation, bearing faults, gear faults, imbalance) to establish a corresponding recognition system. For each trained DBN model corresponding to a specific measurement point \(\delta\), its performance is evaluated using a confusion matrix on a validation dataset. The elements of this matrix are calculated as:
$$ c_{ij}^{(\delta)} = \frac{r_{ij}^{(\delta)}}{\sum_{j=1}^{k} r_{ij}^{(\delta)}} $$
where \(c_{ij}^{(\delta)}\) represents the ratio of samples from actual fault class \(i\) that are identified as class \(j\) by the model at measurement point \(\delta\). \(r_{ij}^{(\delta)}\) is the count of such misclassified samples, and \(k\) is the total number of fault classes (including normal state).
This leads to a \(k \times k\) confusion matrix \(Q^{(\delta)}\) for each measurement point \(\delta\):
$$ Q^{(\delta)} = \begin{bmatrix} c_{11}^{(\delta)} & c_{12}^{(\delta)} & \dots & c_{1k}^{(\delta)} \\ c_{21}^{(\delta)} & c_{22}^{(\delta)} & \dots & c_{2k}^{(\delta)} \\ \vdots & \vdots & \ddots & \vdots \\ c_{k1}^{(\delta)} & c_{k2}^{(\delta)} & \dots & c_{kk}^{(\delta)} \end{bmatrix} $$
The row vector \(\mathbf{c}_{i}^{(\delta)}\) indicates the probability distribution over all fault classes when the actual fault is \(i\), as perceived by the sensor at point \(\delta\). The diagonal element \(c_{ii}^{(\delta)}\) is particularly important as it represents the model’s accuracy for fault \(i\) at that specific point.
2. Credibility Assessment Function for Measurement Points
Not all measurement points contribute equally reliable evidence for every fault. The overall diagnostic accuracy of a point and its relative credibility are calculated. The diagnostic accuracy \(Z_\delta\) for measurement point \(\delta\) is computed as a weighted sum of its per-class accuracies:
$$ Z_\delta = \frac{\sum_{i=1}^{k} (c_{ii}^{(\delta)} \cdot T_i)}{\sum_{j=1}^{k} T_j} $$
where \(T_i\) is the total number of samples for fault class \(i\) in the validation set.
The credibility \(\gamma_\delta\) of measurement point \(\delta\) is then derived by normalizing a scaled version of its accuracy relative to all \(\tau\) measurement points:
$$ \gamma_\delta = \frac{\sigma \cdot Z_\delta}{\sum_{i=1}^{\tau} Z_i} $$
Here, \(\sigma\) is a scaling factor within the interval (0, 1), which can be adjusted to control the overall influence of the accuracy-based credibility. This credibility factor \(\gamma_\delta\) will be used to weight the evidence from each point during fusion.
3. Initial Assignment of Basic Probability Assignment (BPA) Function
For a new vibration sample, each DBN model at point \(\delta\) outputs a probability vector \(\mathbf{p}^{(\delta)} = [p^{(\delta)}_1, p^{(\delta)}_2, …, p^{(\delta)}_k]\), where \(p^{(\delta)}_i\) is the probability that the sample belongs to fault class \(i\) according to that local model. To form a valid Basic Probability Assignment (BPA) function \(m_\delta\) for DS theory, these probabilities are combined with the point’s credibility and a measure of class-specific reliability. First, a modified probability is calculated by weighting each class probability with the corresponding diagonal element (accuracy) from the confusion matrix:
$$ p’^{(\delta)}_i = \frac{\omega^{(\delta)}_i \cdot p^{(\delta)}_i}{\sum_{j=1}^{k} \omega^{(\delta)}_j \cdot p^{(\delta)}_j}, \quad \text{where } \omega^{(\delta)}_i = c_{ii}^{(\delta)} $$
This step emphasizes classes for which the local model has historically shown higher accuracy.
4. Model Fusion Diagnosis via DS Combination Rule
Evidence from different sensors can sometimes be conflicting. The DS evidence theory provides a formal rule to combine multiple BPAs into a fused, more reliable belief assignment. The BPA for each measurement point \(\delta\) is structured as a belief mass distribution over the frame of discernment \(\Theta = \{F_1, F_2, …, F_k\}\) (the set of fault classes) and its uncertainty:
$$ m_\delta(F_1, F_2, …, F_k, \phi) = (\gamma_\delta p’^{(\delta)}_1, \gamma_\delta p’^{(\delta)}_2, …, \gamma_\delta p’^{(\delta)}_k, 1-\gamma_\delta, 0) $$
In this tuple, \(\gamma_\delta p’^{(\delta)}_i\) is the belief mass assigned to fault class \(F_i\), \(1-\gamma_\delta\) is the mass assigned to uncertainty (represented by \(\phi\), often interpreted as the universal set \(\Theta\)), and the last element 0 signifies that no mass is assigned to the empty set (representing conflict) initially before combination.
The core of DS fusion is the orthogonal sum, also known as Dempster’s rule of combination. For two BPAs \(m_1\) and \(m_2\), the combined BPA \(m = m_1 \oplus m_2\) is calculated as:
$$ m(A) = \frac{1}{1-K} \sum_{B \cap C = A} m_1(B) m_2(C), \quad \text{for } A \neq \varnothing $$
where the conflict coefficient \(K\) is given by:
$$ K = \sum_{B \cap C = \varnothing} m_1(B) m_2(C) $$
This rule is applied sequentially to fuse the BPAs from all \(\tau\) measurement points, resulting in a final, unified BPA \(m_{final}\). The fault class with the highest final belief mass is selected as the diagnostic output for the RV reducer. This process effectively resolves conflicts and reinforces consensus among the multiple diagnostic results from different locations on the RV reducer.
Experimental Design and Data Acquisition
To validate the correctness and efficacy of the proposed DS-DBN method, a comprehensive experimental test was conducted. The test platform consisted of an industrial robot RV reducer test rig. A Y160M2-8 type reducer was used, instrumented with four vibration sensors placed at strategic measurement points: the coupling connection point, the head position, the tail position, and the base of the reducer housing. This multi-point setup allows for capturing vibration signatures from different structural paths associated with potential faults within the RV reducer.
The data acquisition parameters were set with a sampling frequency of 10 kHz and a sampling period of 0.0001 seconds, ensuring capture of high-frequency components relevant to RV reducer fault signatures. Vibration signals were collected under various health states of the RV reducer, including normal operation and several seeded fault conditions such as inner/outer race bearing faults, gear tooth damage, and rotor imbalance.
Frequency-domain analysis of the acquired signals reveals distinct patterns. The vibration frequency spectra for the RV reducer under different conditions show marked differences in peak amplitudes and the distribution of energy across frequency bands. For instance, characteristic fault frequencies associated with bearing defects or gear meshing anomalies become prominent in their respective spectra, providing a basis for the DBN models to learn discriminative features. The raw time-domain signals also exhibit clear morphological changes corresponding to different fault types in the RV reducer.
Performance Testing of RV Reducer Fault Diagnosis
The performance of the DS-DBN model was evaluated through iterative training and testing. The parameter optimization process for the four individual DBN models (one per measurement point) is shown in the following figure. The classification error for each point’s model decreases significantly during initial training epochs. As training progresses, the error reduction rate slows, eventually converging. All four models reached a stable convergence state after approximately 30 training epochs. The final classification errors for the trained DBN models at the four measurement points on the RV reducer were 2.07%, 3.78%, 3.96%, and 3.41%, respectively, all below 5%. This indicates that the DBN models effectively learned to extract fault features from the vibration data at each specific location on the RV reducer.
The primary metric for evaluating the diagnostic performance is the overall accuracy, calculated as:
$$ \text{Accuracy} = \frac{n_{11}T_1 + \sum_{i=2}^{k} (f_{ii} T_i) }{\sum_{i=1}^{k} T_i} $$
where \(n_{11}\) is the proportion of correctly identified normal state samples, \(f_{ii}\) is the proportion of correctly identified samples for fault state \(i\), \(T_1\) is the total number of normal state samples, and \(T_i\) is the total number of samples for fault class \(i\).
The diagnostic results for individual measurement points and the fused DS-DBN result are summarized in the table below. The table clearly demonstrates the power of multi-point fusion for RV reducer diagnosis.
| Parameter / Measurement Point | Normal State | Stator Fault | Rotor Fault | Ball Fault | Roller Fault |
|---|---|---|---|---|---|
| Point 1 (Coupling) | 0.994 | 0.982 | 0.988 | 0.989 | 0.982 |
| Point 2 (Head) | 0.993 | 0.975 | 0.976 | 0.966 | 0.983 |
| Point 3 (Tail) | 0.985 | 0.984 | 0.979 | 0.971 | 0.986 |
| Point 4 (Base) | 0.989 | 0.981 | 0.985 | 0.975 | 0.983 |
| DS-DBN Fusion Result | 0.999 | 0.999 | 1.000 | 0.999 | 0.995 |
As evident from the table, while individual measurement points provide good diagnostic accuracy (mostly above 97-98%), there is variability, and no single point achieves perfect recognition across all fault types for the RV reducer. However, after applying the DS evidence theory to fuse the diagnostic results from all four points, the accuracy for normal state, stator fault, and rotor fault is elevated to nearly 100%. The accuracy for bearing-related faults (ball and roller faults) is also significantly improved to 99.9% and 99.5%, respectively. This substantial improvement underscores the critical advantage of the multi-measurement point DS-DBN fusion approach: it synthesizes complementary evidence from spatially distributed sensors on the RV reducer, mitigating the limitations of any single sensor and yielding a more robust and reliable final diagnosis.
Conclusion
This paper presented an in-depth study on fault diagnosis for the industrial robot RV reducer using a multi-measurement point DS-DBN fusion methodology. The integration of Deep Belief Networks for sophisticated feature extraction from vibration signals and Dempster-Shafer evidence theory for robust multi-source information fusion creates a powerful diagnostic framework specifically tailored for the complex structure of the RV reducer. The experimental results lead to two primary conclusions. First, the individual DBN models for each measurement point on the RV reducer converge effectively, achieving low classification errors (below 5%), which validates their capability as reliable local diagnostic agents. Second, and most importantly, the DS evidence theory-based fusion of these local diagnoses dramatically enhances the overall system performance. Compared to relying on any single test point, the fused DS-DBN approach elevates the diagnostic accuracy for most fault types in the RV reducer to near-perfect levels (approaching 100%). This research demonstrates a significant step forward in solving hidden fault problems within the industrial robot RV reducer. By enabling earlier and more accurate fault detection, this method contributes directly to prolonging the service life of these critical components, minimizing unplanned downtime, and reducing long-term operational and maintenance costs in automated industrial settings.