
In this study, I present a systematic methodology for diagnosing tooth profile change faults in worm gear reducers by integrating Empirical Mode Decomposition (EMD) with the Hilbert transform. The vibration signals of the reducer are acquired via a specifically designed acquisition system. Through comparative experiments on both normal and faulty worm gears, I demonstrate that the proposed method effectively extracts characteristic frequencies associated with tooth profile changes, achieving results consistent with those obtained using a JD45+ gear measuring instrument. The approach successfully identifies the modulation phenomenon where the meshing frequency is modulated by the rotation frequency of the worm gear shaft, confirming its viability for online fault diagnosis.
Table 1: Key Parameters of the Worm Gear Reducer Test System
| Parameter | Value |
|---|---|
| Motor input speed (theoretical) | 1440 rpm |
| Worm gear shaft rotation frequency (theoretical) | 2.4 Hz |
| Meshing frequency (theoretical) | 72 Hz |
| Sampling frequency | 2731 Hz |
| Sampling duration | 6 s |
| Reducer ratio | 30:1 |
| Worm gear precision grade (nominal) | 9 |
Worm gear reducers are extensively employed in mechanical transmission systems due to their high reduction ratio and torque output. However, harsh operating conditions often lead to worm gear failure, with tooth profile change being a critical factor. Timely detection of such faults can prevent catastrophic breakdowns and reduce economic losses. Recent advances in signal processing, including wavelet analysis, EMD, short-time Fourier transform, and Hilbert transform, have been applied to gear fault diagnosis with promising results. In this work, I combine EMD and Hilbert transform to extract fault signatures from vibration signals of worm gear reducers.
Fault Characteristics of Worm Gear Tooth Profile Change
When a worm gear experiences tooth profile change, its actual tooth shape deviates significantly from the ideal involute curve. This fault typically manifests as an amplitude modulation phenomenon: the meshing frequency acts as the carrier frequency, while the rotation frequency of the worm gear shaft serves as the modulating frequency. The modulation sidebands are usually narrow and of low amplitude because tooth profile changes generally do not generate strong impact vibrations. In severe cases, the fault may excite the natural frequencies of the worm gear, leading to resonance modulation.
Let the meshing frequency be fm and the worm gear shaft rotation frequency be fr. The fault-induced modulation can be expressed in the frequency domain as:
$$ X(f) = A \cdot \left[ \delta(f – f_m) + \frac{m}{2} \delta(f – f_m – f_r) + \frac{m}{2} \delta(f – f_m + f_r) \right] $$
where m is the modulation index. This narrow sideband structure is a key indicator of tooth profile change faults in worm gear reducers.
Empirical Mode Decomposition (EMD) Principle
EMD is an adaptive signal decomposition technique that breaks down a non-stationary signal into a finite set of intrinsic mode functions (IMFs). Each IMF must satisfy two conditions: (1) the number of extrema and zero-crossings must differ by at most one, and (2) the mean of the upper and lower envelopes must be zero at every point. The decomposition process for a signal x(t) proceeds as follows:
Step 1: Identify all local extrema of x(t) and construct the upper and lower envelopes via cubic spline interpolation.
Step 2: Compute the mean of the two envelopes, μ1, and subtract it from the signal:
$$ y_1(t) = x(t) – \mu_1 $$
Step 3: Check if y1(t) meets the IMF conditions. If not, treat y1(t) as the new x(t) and repeat Steps 1–3 until the conditions are satisfied. The resulting component is the first IMF, denoted c1(t).
Step 4: Remove the first IMF from the original signal:
$$ r_1(t) = x(t) – c_1(t) $$
Step 5: Treat r1(t) as the new signal and repeat Steps 1–4 to obtain subsequent IMFs c2, c3, …, until the residual rn(t) becomes a monotonic function or its amplitude falls below a predefined threshold.
The complete decomposition is given by:
$$ x(t) = \sum_{i=1}^{n} c_i(t) + r_n(t) $$
where rn(t) represents the trend or mean of the signal. In this work, the EMD algorithm is applied to the vibration signals of the worm gear reducer, yielding several IMF components that isolate different frequency bands.
Hilbert Transform and Envelope Analysis
The Hilbert transform is used to obtain the analytic signal and its instantaneous envelope. For a discrete signal x(n), the Hilbert transform is defined as:
$$ \hat{x}(n) = x(n) * h(n) $$
where the impulse response h(n) is:
$$ h(n) =
\begin{cases}
0, & n \text{ even} \\
\frac{2}{n\pi}, & n \text{ odd}
\end{cases}
$$
Equivalently, the convolution can be expressed as:
$$ \hat{x}(n) = \frac{2}{\pi} \sum_{m=-\infty}^{\infty} \frac{x(n – 2m – 1)}{2m + 1} $$
The analytic signal z(n) is constructed as:
$$ z(n) = x(n) + j \hat{x}(n) $$
The instantaneous envelope is then:
$$ |z(n)| = \sqrt{x^2(n) + \hat{x}^2(n)} $$
By applying the Hilbert transform to a selected IMF component of the worm gear reducer vibration signal, I obtain the envelope spectrum. The presence of a peak at the worm gear shaft rotation frequency within the envelope spectrum indicates amplitude modulation caused by tooth profile change. This modulation is the primary fault feature used in the diagnosis.
Experimental Setup and Vibration Signal Acquisition
I constructed a dedicated test rig for worm gear reducers, as conceptually shown in the figure above (see the image link below). The system comprises an electric motor, flange couplings, input/output torque sensors, the worm gear reducer under test, a magnetic powder brake acting as load, and a microcomputer for data acquisition. The acceleration sensor (piezoelectric type) was mounted on the reducer housing near the worm gear shaft to obtain vibration signals with high sensitivity. Before recording, each reducer was run for about 4 hours until the temperature stabilized, ensuring proper run-in of the worm gear and worm.
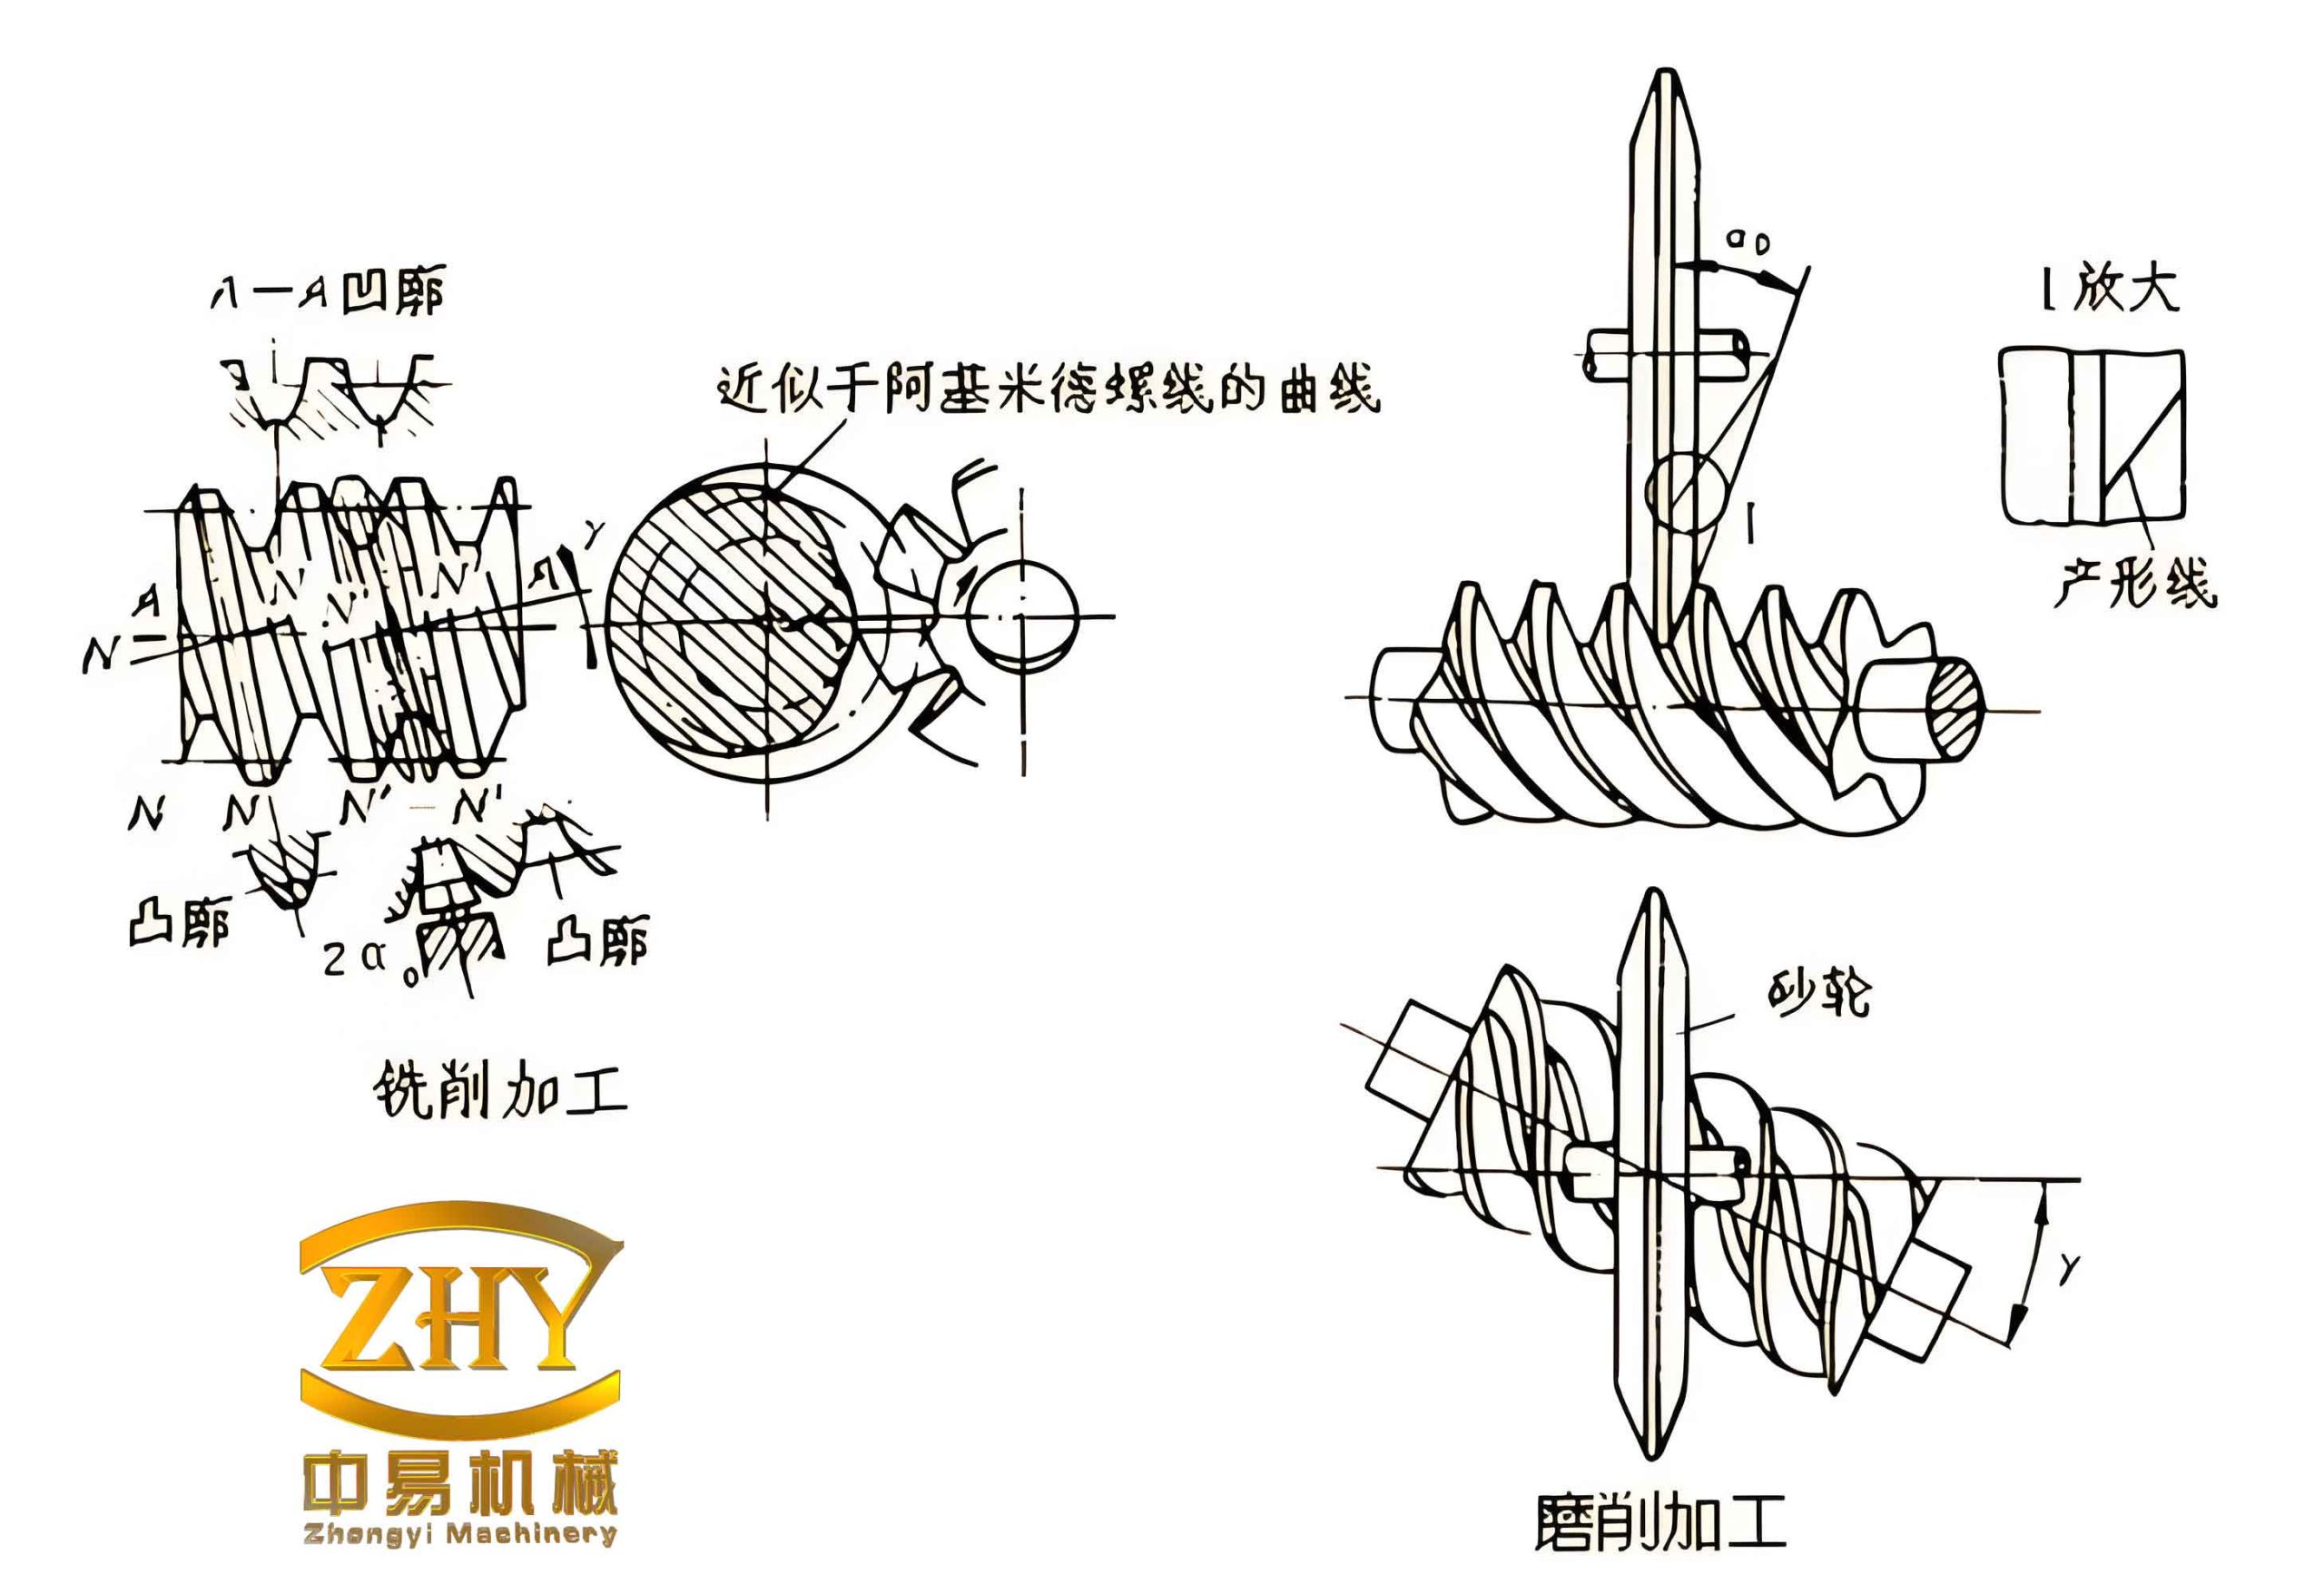
Two worm gear reducers were tested: one suspected to have a tooth profile fault (Reducer #1) and another considered normal (Reducer #2). The sampling frequency was set to 2731 Hz and the sampling time to 6 s. The raw vibration signals are highly complex and noisy, making direct visual inspection impractical.
EMD Decomposition and Fault Identification
I performed EMD on the raw signals from both reducers. The first four IMF components are shown in the following analysis (note: figures are referenced in the original work but not reproduced here in text). For Reducer #1, the third IMF component exhibited characteristics consistent with tooth profile change modulation. I applied the Hilbert transform to this IMF and computed its envelope spectrum.
Table 2: Frequency Peaks Observed in Envelope Spectrum of IMF3 for Reducer #1
| Frequency (Hz) | Amplitude (relative) | Interpretation |
|---|---|---|
| 2.34 | Prominent peak | Worm gear shaft rotation frequency (modulation frequency) |
| ~72 | Carrier | Meshing frequency |
| 72 ± 2.34 | Weak sidebands | Modulation sidebands due to tooth profile change |
The envelope spectrum of Reducer #1 clearly shows a dominant peak at 2.34 Hz, which matches the theoretical worm gear shaft rotation frequency (2.4 Hz) within measurement uncertainty. In contrast, the envelope spectrum of Reducer #2 exhibited a peak around 10 Hz, unrelated to the worm gear rotation, indicating the absence of tooth profile fault. These results align well with the theoretical fault characteristics: narrow sidebands around the meshing frequency and a modulating frequency equal to the worm gear shaft rotation frequency.
For confirmation, I measured the actual tooth profile deviations of both worm gears using a JD45+ gear measuring instrument. The results are summarized below.
Table 3: Comparison of Measured Tooth Profile Deviations with Theoretical Tolerance
| Worm Gear | Maximum Measured Deviation (μm) | Theoretical Tolerance (μm) |
|---|---|---|
| Reducer #1 (faulty) | 306.2 | 39 |
| Reducer #2 (normal) | 52.4 | 39 |
The measured deviation of Reducer #1 (306.2 μm) far exceeds the tolerance of 39 μm for grade 9 accuracy, confirming a significant tooth profile change. For Reducer #2, the deviation (52.4 μm) is only slightly above the tolerance, indicating acceptable gear quality. This direct measurement corroborates the vibration-based diagnosis using EMD and Hilbert transform, validating the effectiveness of the proposed method.
Conclusions
I have demonstrated a robust approach for diagnosing tooth profile change faults in worm gear reducers by combining EMD and Hilbert transform. The key findings are:
- EMD effectively decomposes the complex vibration signal into multiple IMFs, isolating the component containing fault-related information.
- Hilbert envelope analysis of the appropriate IMF reveals a distinct modulation peak at the worm gear shaft rotation frequency, which is the hallmark of tooth profile change.
- Experimental results on two worm gear reducers (one faulty, one normal) match perfectly with direct measurements from a JD45+ gear measuring instrument, confirming the method’s reliability.
- Selection of the correct IMF is crucial for efficient diagnosis; future work could focus on automated IMF selection to improve practicality.
The proposed EMD-Hilbert approach offers a non-destructive, online tool for early detection of worm gear tooth profile faults, helping to prevent unexpected failures in industrial applications.