
I conducted this experimental study to improve the surface morphology quality of a face gear material during femtosecond laser finishing. A face gear is a critical transmission component because it can transfer motion between intersecting axes with a large transmission ratio and high load capacity. However, the tooth geometry of a face gear is complex, and conventional mechanical finishing often struggles to reach the required precision. For this reason, I focused on femtosecond laser finishing as a high-precision method for the face gear material 18Cr2Ni4WA. The ultrafast pulse duration and extremely high peak power of a femtosecond laser allow precise ablation with a small heat-affected zone, which is attractive for finishing a face gear surface without introducing excessive thermal damage.
I treated the ablation depth and surface roughness of the face gear material as the two main response targets. The ablation depth is related to finishing efficiency and material removal, while surface roughness controls the final surface integrity of the face gear. My goal was not only to maximize the ablation depth or minimize roughness separately, but also to identify a process parameter combination that improves the combined surface morphology quality. Therefore, I designed an orthogonal experiment and used signal-to-noise ratio analysis together with grey relational analysis. This approach allowed me to evaluate pulse frequency, energy density, and scanning speed as three factors, each at three levels, and to optimize multiple response targets for femtosecond laser finishing of the face gear material.
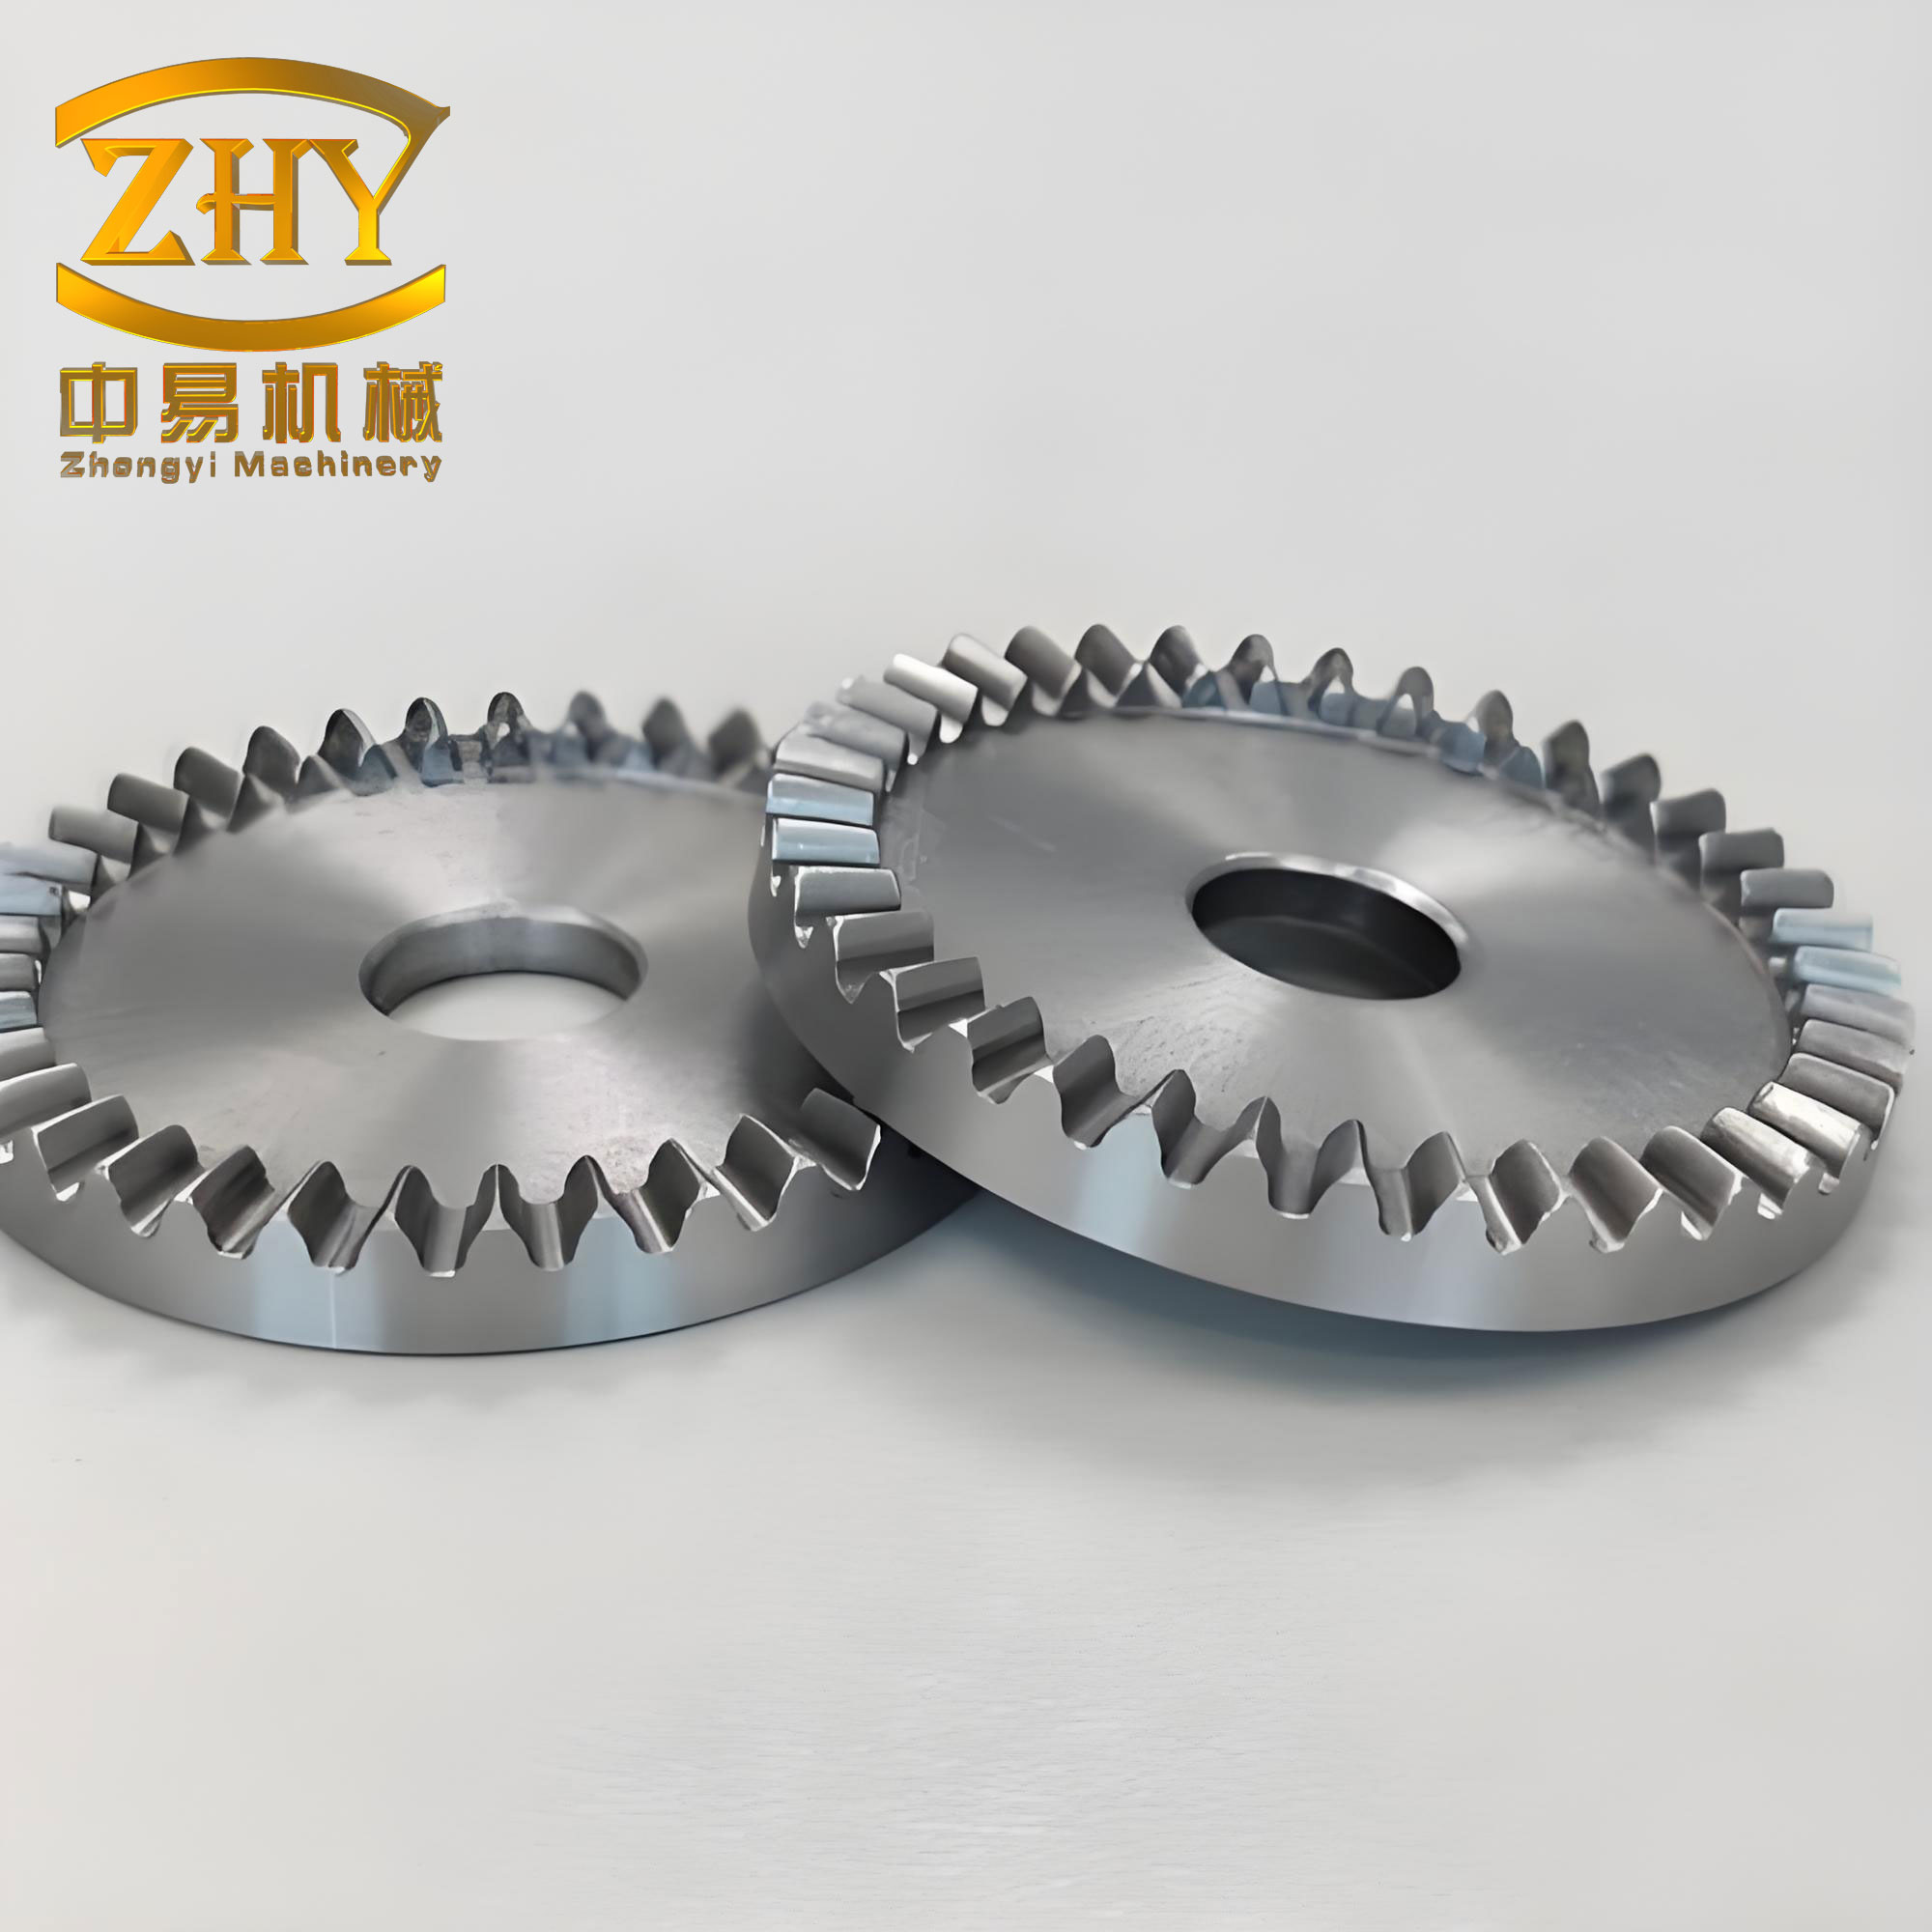
I selected 18Cr2Ni4WA as the face gear material because it is a high-strength alloy steel often used in heavily loaded transmission components. The femtosecond laser system I used generated pulses with a central wavelength of 1030 nm, and the maximum output power was 116.4 W. I directed the laser beam through an optical path and focused it onto the face gear sample mounted on a four-axis motion platform. I monitored the process with a computer-aided system and a charge-coupled device monitoring unit, and I used a gas blowing system to assist debris removal. The ablation depth was measured with a three-dimensional laser confocal morphology microscope, and the surface roughness was measured with a profilometer. The scanning strategy was a serpentine path with straight and parallel scan lines, which I used to cover the face gear material surface uniformly during femtosecond laser finishing.
I designed a three-factor, three-level orthogonal experiment to reduce the number of trials while still revealing the main effects of the process parameters. The three factors were pulse frequency \(F\), energy density \(D\), and scanning speed \(V\). I denoted the levels using coded values 1, 2, and 3. The factor level table is given in Table 1. The orthogonal array \(L_9(3^3)\) is given in Table 2. I used the orthogonal array to arrange nine experiments, and I measured the ablation depth and surface roughness for each experiment.
| Process parameter | Symbol | Level 1 | Level 2 | Level 3 |
|---|---|---|---|---|
| Pulse frequency / kHz | \(F\) | 100 | 150 | 200 |
| Energy density / (J·cm-2) | \(D\) | 3.0 | 3.5 | 4.0 |
| Scanning speed / (mm·s-1) | \(V\) | 100 | 110 | 120 |
| No. | Coded level | \(F\) / kHz | \(D\) / (J·cm-2) | \(V\) / (mm·s-1) |
|---|---|---|---|---|
| 1 | 1 1 1 | 100 | 3.0 | 100 |
| 2 | 1 2 2 | 100 | 3.5 | 110 |
| 3 | 1 3 3 | 100 | 4.0 | 120 |
| 4 | 2 1 2 | 150 | 3.0 | 110 |
| 5 | 2 2 3 | 150 | 3.5 | 120 |
| 6 | 2 3 1 | 150 | 4.0 | 100 |
| 7 | 3 1 3 | 200 | 3.0 | 120 |
| 8 | 3 2 1 | 200 | 3.5 | 100 |
| 9 | 3 3 2 | 200 | 4.0 | 110 |
For the response analysis, I used the signal-to-noise ratio to evaluate the robustness of each process parameter level. Since I wanted the ablation depth to be as large as possible for efficient femtosecond laser finishing of the face gear material, I applied the larger-the-better signal-to-noise ratio to the ablation depth. Since I wanted the surface roughness to be as small as possible for a smooth face gear surface, I applied the smaller-the-better signal-to-noise ratio to the surface roughness. The corresponding equations are shown below.
$$ \eta_{\mathrm{SNR-L}} = -10 \log_{10} \left( \frac{1}{m} \sum_{j=1}^{m} \frac{1}{y_j^2} \right) $$
$$ \eta_{\mathrm{SNR-S}} = -10 \log_{10} \left( \frac{1}{m} \sum_{j=1}^{m} y_j^2 \right) $$
In these equations, \(\eta_{\mathrm{SNR-L}}\) is the larger-the-better signal-to-noise ratio, \(\eta_{\mathrm{SNR-S}}\) is the smaller-the-better signal-to-noise ratio, \(m\) is the number of repeated measurements in a trial group, and \(y_j\) is the measured response value. I calculated the signal-to-noise ratios for the ablation depth and surface roughness from the nine orthogonal trials. The measured response values and their corresponding signal-to-noise ratios are summarized in Table 3.
| No. | Ablation depth / μm | \(\eta_{\mathrm{SNR-L}}\) for depth | Surface roughness / μm | \(\eta_{\mathrm{SNR-S}}\) for roughness |
|---|---|---|---|---|
| 1 | 2.20 | 6.848454 | 0.429 | 7.350854 |
| 2 | 3.49 | 10.856509 | 0.213 | 13.432408 |
| 3 | 3.04 | 9.657472 | 0.523 | 5.629966 |
| 4 | 5.11 | 14.168418 | 0.468 | 6.595083 |
| 5 | 4.31 | 12.689545 | 0.539 | 5.368225 |
| 6 | 9.61 | 19.654468 | 0.365 | 8.754143 |
| 7 | 6.05 | 15.635107 | 0.273 | 11.276747 |
| 8 | 10.85 | 20.708595 | 0.549 | 5.208553 |
| 9 | 9.48 | 19.536167 | 0.544 | 5.288022 |
I analyzed the main effects by averaging the signal-to-noise ratio at each level of each factor. For a given factor \(q\) and level \(l\), the mean signal-to-noise ratio can be expressed as
$$ \bar{\eta}_{q,l} = \frac{1}{n_{q,l}} \sum_{i \in (q,l)} \eta_i $$
where \(n_{q,l}\) is the number of trials in which factor \(q\) is set to level \(l\), and \(\eta_i\) is the signal-to-noise ratio of trial \(i\). I also used the range \(\Delta_q\) to rank the influence of each process parameter:
$$ \Delta_q = \max_l \bar{\eta}_{q,l} – \min_l \bar{\eta}_{q,l} $$
A larger \(\Delta_q\) indicates that the factor has a stronger effect on the response target. The mean signal-to-noise ratios for the ablation depth are shown in Table 4. I found that the pulse frequency had the largest range, which means that the ablation depth of the face gear material was mainly controlled by pulse frequency. The energy density was the second most influential factor, and the scanning speed was the third.
| Factor | Level 1 mean | Level 2 mean | Level 3 mean | Delta | Rank |
|---|---|---|---|---|---|
| Pulse frequency \(F\) | 9.120812 | 15.504144 | 18.626623 | 9.505811 | 1 |
| Energy density \(D\) | 12.217326 | 14.751550 | 16.282702 | 4.065376 | 2 |
| Scanning speed \(V\) | 15.737172 | 14.853698 | 12.660708 | 3.076464 | 3 |
The mean signal-to-noise ratios for the surface roughness are shown in Table 5. I observed that the pulse frequency and energy density had the strongest effects on surface roughness. As the pulse frequency increased, more laser pulses interacted with the face gear material in the same scanning time, and the accumulated energy increased. Although this promoted material removal, it also produced more molten material. Part of the molten material could not be ejected completely, and it resolidified on the surface, which increased the surface roughness. A similar mechanism occurred when the energy density increased. The scanning speed showed a non-monotonic effect, because a lower speed increased the pulse overlap and accumulated energy, while a higher speed reduced the overlap and caused incomplete ablation. Both extremes could increase the roughness of the face gear surface.
| Factor | Level 1 mean | Level 2 mean | Level 3 mean | Delta | Rank |
|---|---|---|---|---|---|
| Pulse frequency \(F\) | 8.804409 | 6.905817 | 7.257774 | 1.898592 | 1 |
| Energy density \(D\) | 8.407561 | 8.003062 | 6.557377 | 1.850184 | 2 |
| Scanning speed \(V\) | 7.104517 | 8.438504 | 7.424979 | 1.333988 | 3 |
From the single-response signal-to-noise ratio analysis, I determined that the process parameter combination for maximizing the ablation depth was \(F_3D_3V_1\), corresponding to a pulse frequency of 200 kHz, an energy density of 4.0 J·cm-2, and a scanning speed of 100 mm·s-1. The process parameter combination for minimizing the surface roughness was \(F_1D_1V_2\), corresponding to a pulse frequency of 100 kHz, an energy density of 3.0 J·cm-2, and a scanning speed of 110 mm·s-1. These two single-objective optima were different, which confirmed that the ablation depth and surface roughness of the face gear material were in conflict. A high pulse frequency and high energy density can deepen the ablation region, but they can also increase the roughness of the face gear surface. Therefore, I used grey relational analysis to optimize the two response targets simultaneously.
Grey relational analysis converts multiple response targets into a single grey relational grade. The procedure includes normalization of the signal-to-noise ratios, calculation of the grey relational coefficients, and calculation of the grey relational grade. Because the ablation depth and surface roughness have different units and scales, I first normalized their signal-to-noise ratios. I used the following normalization equation:
$$ x_i(k) = \frac{y_i(k) – \min_k y_i(k)}{\max_k y_i(k) – \min_k y_i(k)} $$
where \(x_i(k)\) is the normalized value for the \(i\)-th trial and the \(k\)-th response, and \(y_i(k)\) is the signal-to-noise ratio data. After normalization, I calculated the deviation from the ideal normalized value. The ideal value was set to \(x_0(k)=1\) for both response targets, because a larger normalized signal-to-noise ratio is preferred. The absolute difference was calculated as
$$ \Delta_{0i}(k) = |x_0(k) – x_i(k)| $$
The normalized signal-to-noise ratios and the corresponding deviations are listed in Table 6. The depth signal-to-noise ratio was normalized as a larger-the-better characteristic, and the roughness signal-to-noise ratio was also normalized as a larger-the-better characteristic because its original signal-to-noise ratio had already been defined using the smaller-the-better formula. In this way, larger normalized values represented better performance for both response targets.
| No. | Normalized depth SNR | Depth deviation | Normalized roughness SNR | Roughness deviation |
|---|---|---|---|---|
| 1 | 0.000000 | 1.000000 | 0.260498 | 0.739502 |
| 2 | 0.289179 | 0.710821 | 1.000000 | 0.000000 |
| 3 | 0.202669 | 0.797331 | 0.051243 | 0.948757 |
| 4 | 0.528131 | 0.471869 | 0.168599 | 0.831401 |
| 5 | 0.421431 | 0.578569 | 0.019416 | 0.980584 |
| 6 | 0.923945 | 0.076055 | 0.431135 | 0.568865 |
| 7 | 0.633951 | 0.366049 | 0.737877 | 0.262123 |
| 8 | 1.000000 | 0.000000 | 0.000000 | 1.000000 |
| 9 | 0.915410 | 0.084590 | 0.009663 | 0.990337 |
I then calculated the grey relational coefficient for each response target. The grey relational coefficient measures how close the normalized signal-to-noise ratio is to the ideal value. I used the following equation:
$$ \mu_i(k) = \frac{\Delta_{\min} + \zeta \Delta_{\max}}{\Delta_{0i}(k) + \zeta \Delta_{\max}} $$
where \(\mu_i(k)\) is the grey relational coefficient, \(\Delta_{\min}\) is the minimum of all \(\Delta_{0i}(k)\), \(\Delta_{\max}\) is the maximum of all \(\Delta_{0i}(k)\), and \(\zeta\) is the distinguishing coefficient. I set \(\zeta=0.5\), which is a common choice for balanced identification. After obtaining the grey relational coefficients for the ablation depth and surface roughness, I calculated the grey relational grade as
$$ \gamma_i = \frac{1}{n} \sum_{k=1}^{n} \mu_i(k) $$
where \(\gamma_i\) is the grey relational grade of the \(i\)-th trial and \(n\) is the number of response targets. In my study, \(n=2\). The grey relational coefficients and the grey relational grades are shown in Table 7. A larger grey relational grade indicates that the trial result is closer to the ideal combination of a deep ablation region and a smooth face gear surface. I found that trial 2 had the highest grey relational grade among the nine orthogonal trials, which means that the combination \(F_1D_2V_2\) gave the best combined surface morphology within the orthogonal array.
| No. | Grey relational coefficient for depth SNR | Grey relational coefficient for roughness SNR | Grey relational grade | Order |
|---|---|---|---|---|
| 1 | 0.333333 | 0.403388 | 0.368361 | 8 |
| 2 | 0.412943 | 1.000000 | 0.706471 | 1 |
| 3 | 0.385407 | 0.345123 | 0.365265 | 9 |
| 4 | 0.514472 | 0.375544 | 0.445008 | 6 |
| 5 | 0.463577 | 0.337705 | 0.400641 | 7 |
| 6 | 0.867973 | 0.467786 | 0.667880 | 2 |
| 7 | 0.577335 | 0.656062 | 0.616698 | 4 |
| 8 | 1.000000 | 0.333333 | 0.666667 | 3 |
| 9 | 0.855300 | 0.335495 | 0.595398 | 5 |
To determine the optimal process parameter combination for the multi-response target, I calculated the mean grey relational grade for each factor at each level. The mean grey relational grade for factor \(q\) at level \(l\) is
$$ \bar{\gamma}_{q,l} = \frac{1}{n_{q,l}} \sum_{i \in (q,l)} \gamma_i $$
The factor with the largest range in mean grey relational grade has the strongest influence on the combined surface morphology quality. The mean grey relational grade response is shown in Table 8. I found that the pulse frequency had the largest range, followed by the scanning speed and then the energy density. This means that for the integrated optimization of ablation depth and surface roughness in femtosecond laser finishing of the face gear material, the pulse frequency was the most important factor, the scanning speed was the second most important factor, and the energy density was the third most important factor. Based on the maximum mean grey relational grade at each level, I selected the optimal combination \(F_3D_2V_2\), which corresponds to a pulse frequency of 200 kHz, an energy density of 3.5 J·cm-2, and a scanning speed of 110 mm·s-1.
| Factor | Level 1 mean | Level 2 mean | Level 3 mean | Delta | Rank |
|---|---|---|---|---|---|
| Pulse frequency \(F\) | 0.480032 | 0.504510 | 0.626254 | 0.146222 | 1 |
| Energy density \(D\) | 0.476689 | 0.591260 | 0.542847 | 0.114571 | 3 |
| Scanning speed \(V\) | 0.567636 | 0.582292 | 0.460868 | 0.121424 | 2 |
I compared the single-response optima and the multi-response optimum in Table 9. For the ablation depth alone, the best combination was \(F_3D_3V_1\), because the highest pulse frequency, highest energy density, and lowest scanning speed produced the strongest energy accumulation and the largest ablation depth. For the surface roughness alone, the best combination was \(F_1D_1V_2\), because the lowest pulse frequency and lowest energy density reduced molten material and resolidification, while the intermediate scanning speed provided balanced overlap. For the multi-response target, the best combination was \(F_3D_2V_2\). This combination did not simply maximize depth or minimize roughness; instead, it balanced the two responses. The pulse frequency was kept at the highest level to promote efficient material removal, the energy density was set at the intermediate level to avoid excessive melting, and the scanning speed was set at the intermediate level to maintain appropriate pulse overlap.
| Optimization target | Pulse frequency \(F\) | Energy density \(D\) | Scanning speed \(V\) | Combination |
|---|---|---|---|---|
| Maximum ablation depth | 200 kHz | 4.0 J·cm-2 | 100 mm·s-1 | \(F_3D_3V_1\) |
| Minimum surface roughness | 100 kHz | 3.0 J·cm-2 | 110 mm·s-1 | \(F_1D_1V_2\) |
| Best combined surface morphology | 200 kHz | 3.5 J·cm-2 | 110 mm·s-1 | \(F_3D_2V_2\) |
Because the optimal multi-response combination \(F_3D_2V_2\) was not one of the nine orthogonal trials, I performed a confirmation experiment. I first predicted the grey relational grade using the additive model
$$ \hat{\gamma} = \bar{\gamma} + \sum_{q=1}^{Q} \left( \bar{\gamma}_{q}^{\mathrm{opt}} – \bar{\gamma} \right) $$
where \(\hat{\gamma}\) is the predicted grey relational grade, \(\bar{\gamma}\) is the overall mean grey relational grade of the orthogonal experiment, \(\bar{\gamma}_{q}^{\mathrm{opt}}\) is the mean grey relational grade at the optimal level of factor \(q\), and \(Q\) is the number of factors. The overall mean grey relational grade was 0.536932. Using the optimal levels \(F_3\), \(D_2\), and \(V_2\), I obtained a predicted grey relational grade of 0.725942. I then conducted the confirmation experiment with the same femtosecond laser finishing setup and the same face gear material. The measured ablation depth was 8.63 μm, and the measured surface roughness was 0.244 μm. The grey relational grade of the confirmation experiment was 0.777019. The relative error between the predicted and experimental grey relational grades was calculated as
$$ E_r = \left| \frac{\hat{\gamma} – \gamma_{\mathrm{exp}}}{\gamma_{\mathrm{exp}}} \right| \times 100\% $$
Using the experimental value as the reference, the relative error was about 7%. This agreement indicated that the grey relational analysis was reliable for multi-response optimization of femtosecond laser finishing of the face gear material. The confirmation results are summarized in Table 10. Compared with the best orthogonal trial, the ablation depth increased by 5.14 μm, while the surface roughness increased only slightly. The grey relational grade increased from 0.706471 to 0.777019, which confirmed that the optimized process parameters improved the combined surface morphology quality of the face gear material.
| Condition | Pulse frequency \(F\) | Energy density \(D\) | Scanning speed \(V\) | Ablation depth / μm | Surface roughness / μm | Grey relational grade |
|---|---|---|---|---|---|---|
| Initial best orthogonal trial | 100 kHz | 3.5 J·cm-2 | 110 mm·s-1 | 3.49 | 0.213 | 0.706471 |
| Prediction for \(F_3D_2V_2\) | 200 kHz | 3.5 J·cm-2 | 110 mm·s-1 | — | — | 0.725942 |
| Confirmation experiment for \(F_3D_2V_2\) | 200 kHz | 3.5 J·cm-2 | 110 mm·s-1 | 8.63 | 0.244 | 0.777019 |
I also evaluated the relative improvements of the confirmation experiment compared with the best orthogonal trial. The ablation depth improvement was
$$ I_h = \frac{h_{\mathrm{opt}} – h_{\mathrm{orth}}}{h_{\mathrm{orth}}} \times 100\% $$
which gave an increase of approximately 147.3%. The roughness change was
$$ I_R = \frac{R_{\mathrm{opt}} – R_{\mathrm{orth}}}{R_{\mathrm{orth}}} \times 100\% $$
which corresponded to an increase of approximately 14.6%. Although the roughness increased slightly, the grey relational grade improved by approximately 10.0%. This result showed that the multi-response optimization did not sacrifice too much surface smoothness for a large gain in ablation depth. For femtosecond laser finishing of the face gear material, this balance is important because a face gear surface must satisfy both geometric removal requirements and surface integrity requirements.
| Response | Best orthogonal trial | Optimized confirmation | Absolute change | Relative change |
|---|---|---|---|---|
| Ablation depth / μm | 3.49 | 8.63 | +5.14 | +147.3% |
| Surface roughness / μm | 0.213 | 0.244 | +0.031 | +14.6% |
| Grey relational grade | 0.706471 | 0.777019 | +0.070548 | +10.0% |
I explain the physical mechanisms of the observed effects as follows. When the pulse frequency increases, the number of femtosecond laser pulses delivered to the face gear material per unit time increases. For the same scanning speed, a higher pulse frequency produces a higher pulse overlap and stronger energy accumulation. This promotes material removal and increases the ablation depth. However, the same energy accumulation also generates more molten material. If the recoil pressure from evaporation is not sufficient to eject all the molten material, the residual liquid solidifies and forms recast layers, droplets, and accumulated debris. These features increase the surface roughness of the face gear material. When the energy density increases, the peak intensity in the focal region increases, and the ablation rate rises. A higher energy density can deepen the ablation region, but it can also intensify melting, spatter, and plasma shielding. Therefore, an excessively high energy density is not always beneficial for surface roughness. When the scanning speed increases, the overlap between consecutive laser spots decreases. A low scanning speed gives a high overlap and strong heat accumulation, which deepens the ablation region but may increase roughness. A high scanning speed gives a low overlap and incomplete ablation, which reduces the depth and may also increase roughness because the ablation is uneven. The intermediate scanning speed used in the optimal combination provided a suitable balance between overlap and removal efficiency.
| Process parameter | Effect on ablation depth | Effect on surface roughness | Role in multi-response optimization |
|---|---|---|---|
| Pulse frequency \(F\) | Increases depth because more pulses and higher energy accumulation occur in the same time. | Strongly influences roughness because more molten material and recast layers can form. | Most influential factor; the highest level was selected to promote efficient removal. |
| Energy density \(D\) | Increases depth because higher intensity raises the ablation rate. | Strongly influences roughness; excessive melting and spatter increase roughness. | Intermediate level gave the best balance between depth and surface quality. |
| Scanning speed \(V\) | Decreases depth as speed increases because pulse overlap and energy accumulation decrease. | Non-monotonic effect; both too low and too high speed can increase roughness. | Second most influential factor in the grey relational grade; intermediate level was selected. |
The relative influence rankings for the single-response and multi-response analyses are summarized in Table 12. For the ablation depth, the ranking was pulse frequency, energy density, and scanning speed. For the surface roughness, the ranking was also pulse frequency, energy density, and scanning speed. For the grey relational grade, however, the ranking changed to pulse frequency, scanning speed, and energy density. This change occurred because the multi-response optimization considered both depth and roughness simultaneously, and the scanning speed had a strong non-monotonic effect on the surface morphology of the face gear material. The grey relational analysis therefore revealed interactions among the process parameters that a single-response analysis could not fully capture.
| Response target | Influence ranking |
|---|---|
| Ablation depth | \(F > D > V\) |
| Surface roughness | \(F > D > V\) |
| Grey relational grade | \(F > V > D\) |
I further considered the meaning of the confirmation results for practical femtosecond laser finishing of a face gear. A face gear has a complex tooth surface, and the finishing process must remove a controlled amount of material while maintaining a smooth surface. If the process parameters are chosen only to maximize depth, the face gear surface may suffer from excessive melting and roughness. If the process parameters are chosen only to minimize roughness, the material removal rate may be too low, and the finishing efficiency of the face gear will be poor. The optimal combination \(F_3D_2V_2\) achieved a much larger ablation depth while keeping the roughness at a moderate level. The grey relational grade was higher than that of any orthogonal trial, which means that the combined quality of the face gear surface was improved. This is the main reason why I consider grey relational analysis an effective method for multi-response process parameter optimization in femtosecond laser finishing of face gear material.
I also examined the sensitivity of the grey relational grade to the distinguishing coefficient \(\zeta\). In grey relational analysis, \(\zeta\) controls the difference between the grey relational coefficients. A smaller \(\zeta\) gives more weight to the minimum difference, while a larger \(\zeta\) gives more weight to the maximum difference. I used \(\zeta=0.5\), which is widely accepted because it provides a balanced resolution. The ranking of the orthogonal trials and the identification of the optimal levels were stable under this choice. The confirmation experiment supported the prediction, and the relative error of about 7% was acceptable for an experimental optimization study. If the process window were expanded to include more levels or additional factors such as pulse duration, spot size, or ambient gas pressure, the grey relational model could be extended accordingly.
In my analysis, the signal-to-noise ratio was essential because it converted the measured ablation depth and surface roughness into quality characteristics that could be compared on a common basis. The larger-the-better signal-to-noise ratio for depth rewarded trials with deeper ablation regions. The smaller-the-better signal-to-noise ratio for roughness rewarded trials with smoother surfaces. The grey relational analysis then combined these two signal-to-noise ratios without requiring an arbitrary weighting of the responses. This is important for femtosecond laser finishing of a face gear, because the relative importance of depth and roughness may depend on the specific finishing stage. During rough finishing, depth may be more important; during final finishing, roughness may be more important. A multi-response method such as grey relational analysis provides a systematic way to balance these objectives.
The experimental results also showed that the face gear material 18Cr2Ni4WA responded strongly to pulse frequency. This can be attributed to the accumulation of thermal energy and the increase in the number of ablation events. At a higher pulse frequency, the time between consecutive pulses is shorter, so the material has less time to cool. The elevated temperature increases the ablation rate and deepens the crater. However, the same mechanism can produce a thicker recast layer and more redeposited material. I observed that the surface roughness did not decrease monotonically with pulse frequency. Instead, it reached a minimum at the lowest pulse frequency and then increased at higher frequencies. This non-monotonic behavior is consistent with the competition between material removal and molten material accumulation. The grey relational analysis captured this competition by integrating the depth and roughness responses.
For the energy density, I found that the intermediate level of 3.5 J·cm-2 was better for the combined surface morphology than the highest level of 4.0 J·cm-2. The highest energy density produced the deepest ablation region in the single-response analysis, but it also produced more melting and spatter. The intermediate energy density provided sufficient ablation intensity while limiting the amount of molten material. This result is practically useful for femtosecond laser finishing of a face gear, because it suggests that increasing energy density without limit is not the best strategy for surface quality. A controlled energy density can improve the finishing efficiency and maintain a smoother face gear surface.
For the scanning speed, I found that 110 mm·s-1 was optimal in the multi-response analysis. At this speed, the pulse overlap was sufficient to produce a continuous ablation region, but not so high that excessive heat accumulation caused severe melting. At a lower scanning speed of 100 mm·s-1, the overlap was higher, and the ablation depth increased, but the roughness also increased. At a higher scanning speed of 120 mm·s-1, the overlap was lower, and the ablation became less uniform. The intermediate scanning speed therefore provided the best balance for the face gear material. This finding is consistent with the idea that femtosecond laser finishing requires a narrow process window in which the pulse overlap is optimized.
I also note that the orthogonal array \(L_9(3^3)\) allowed me to estimate the main effects with only nine experiments. Although the array does not provide full information about interactions, the confirmation experiment validated the predicted optimum and demonstrated the reliability of the main-effect model. The grey relational grade prediction equation used the overall mean and the mean values at the optimal levels. The small relative error of about 7% indicated that the additive model was adequate for this process window. If stronger interactions were present, a response surface design or a full factorial design could be used in future work. Nevertheless, the orthogonal array combined with grey relational analysis was efficient and effective for the current study of femtosecond laser finishing of the face gear material.
The practical implications of my study are as follows. First, for femtosecond laser finishing of a face gear made of 18Cr2Ni4WA, I recommend a pulse frequency of 200 kHz, an energy density of 3.5 J·cm-2, and a scanning speed of 110 mm·s-1 when the goal is to improve the combined surface morphology. Second, I recommend using the grey relational grade as a decision index when both ablation depth and surface roughness are important. Third, I recommend measuring both depth and roughness because a process parameter that improves one response may degrade the other. Fourth, I recommend validating any predicted optimum with a confirmation experiment, because the nonlinear nature of laser ablation can cause deviations from the additive prediction. Fifth, I recommend controlling the pulse frequency carefully, because it had the strongest influence on both the ablation depth and the surface roughness of the face gear material.
In summary, I designed a three-factor, three-level orthogonal experiment for femtosecond laser finishing of the face gear material 18Cr2Ni4WA. I used signal-to-noise ratio analysis to evaluate the single-response effects of pulse frequency, energy density, and scanning speed on ablation depth and surface roughness. I found that pulse frequency was the most influential factor for both responses. I then used grey relational analysis to optimize the two responses simultaneously. The optimal process parameter combination was \(F_3D_2V_2\), namely 200 kHz, 3.5 J·cm-2, and 110 mm·s-1. The confirmation experiment produced an ablation depth of 8.63 μm, a surface roughness of 0.244 μm, and a grey relational grade of 0.777019. The relative error between the predicted and experimental grey relational grades was about 7%, which confirmed the reliability of the multi-response optimization. The optimized surface morphology quality was better than that of the initial orthogonal trial, demonstrating that grey relational analysis is an effective method for improving femtosecond laser finishing of a face gear material. This work provides a systematic approach for selecting process parameters for femtosecond laser finishing of face gears and for balancing ablation efficiency with surface integrity.