
This study investigates the contact force distribution and stress evolution during helical gear meshing using finite element methods. A comprehensive contact analysis model is developed to evaluate the effects of plastic deformation, surface friction, thermal effects, and material hardening. Experimental validation confirms the accuracy of the simulation framework.
1. Geometric Modeling of Helical Gears
The involute profile of helical gears is mathematically represented as:
$$X_k = \frac{r_b}{\cos\alpha_k} \sin\left(\frac{\pi}{z} + \text{inv}\alpha – \text{inv}\alpha_k\right)$$
$$Y_k = \frac{r_b}{\cos\alpha_k} \cos\left(\frac{\pi}{z} + \text{inv}\alpha – \text{inv}\alpha_k\right)$$
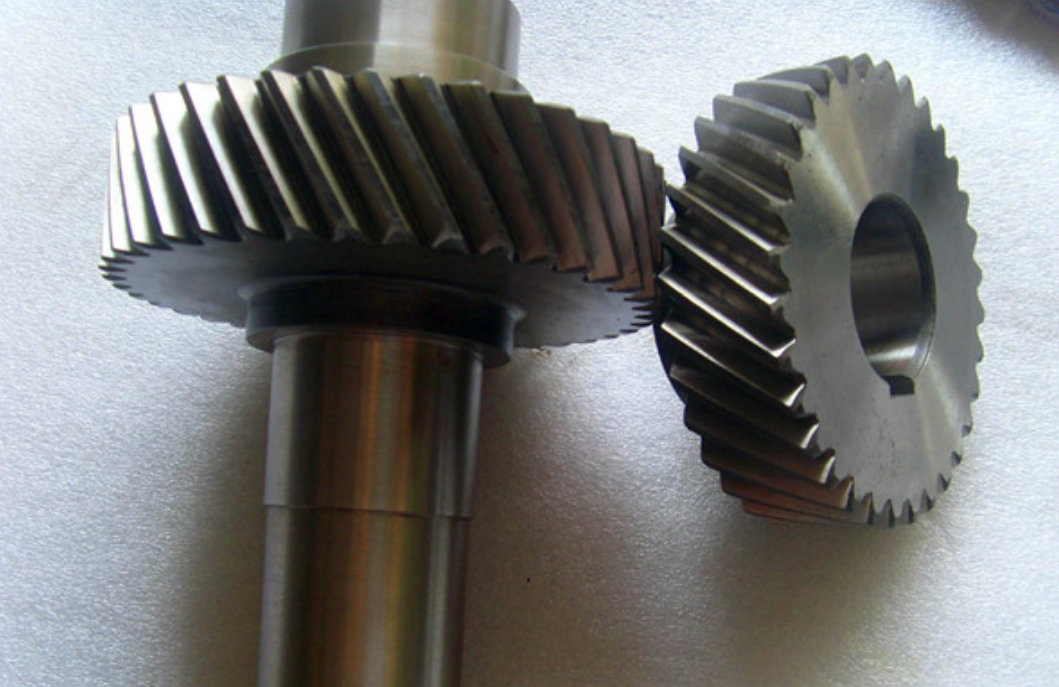
Key geometric parameters for the analyzed helical gear pair are summarized below:
| Parameter | Pinion | Gear |
|---|---|---|
| Number of Teeth | 18 | 27 |
| Module (mm) | 4 | |
| Pressure Angle | 20° | |
| Helix Angle | 12° | |
| Face Width (mm) | 20 | |
2. Contact Analysis Framework
The contact pressure distribution follows the modified Hertzian formulation:
$$p_n = \frac{2F}{\pi b} \sqrt{1 – \left(\frac{x}{a}\right)^2}$$
where contact semi-width a and load distribution factor b are determined through iterative finite element analysis.
2.1 Plastic Deformation Effects
The bilinear hardening model describes material behavior:
$$\sigma =
\begin{cases}
E\varepsilon & \varepsilon \leq \varepsilon_y \\
\sigma_y + E_t(\varepsilon – \varepsilon_y) & \varepsilon > \varepsilon_y
\end{cases}$$
| Torque (Nm) | Elastic Model (kN) | Elastoplastic Model (kN) | Deviation (%) |
|---|---|---|---|
| 400 | 11.25 | 11.26 | 0.11 |
| 1000 | 28.17 | 28.69 | 1.84 |
| 1500 | 42.11 | 42.96 | 2.01 |
| 2000 | 56.04 | 57.80 | 3.13 |
2.2 Frictional Contact Analysis
The friction-induced stress enhancement follows:
$$\Delta \sigma_f = \mu p_n \sqrt{\frac{1-\nu}{\pi(1-2\nu)}}$$
where μ represents the coefficient of friction.
3. Thermal-Structural Coupling
The convective heat transfer coefficients are calculated as:
$$h_s = 0.308\lambda(2)^{0.5}(Pr)^{0.5}\left(\frac{\omega}{v_f}\right)$$
$$h_t = \left(\frac{\omega}{2\pi}\right)^{0.5} \left(\frac{\lambda \rho_f c_f}{v_f H_c}\right)^{0.25}$$
| Location | Simulation (°C) | Experiment (°C) | Error (%) |
|---|---|---|---|
| Tooth Tip | 67.6 | 63.2 | 6.95 |
| Tooth Root | 58.8 | 55.1 | 6.71 |
4. Experimental Validation
The bending stress validation shows good agreement between simulation and experimental measurements:
$$\% \text{Error} = \frac{|\sigma_{\text{exp}} – \sigma_{\text{FEA}}|}{\sigma_{\text{FEA}}} \times 100$$
| Load Case | FEA (MPa) | Experiment (MPa) | Error (%) |
|---|---|---|---|
| 600 Nm | 113.5 | 133.6 | 17.7 |
| 800 Nm | 146.2 | 173.8 | 18.9 |
| 1500 Nm | 262.6 | 295.5 | 12.5 |
5. Material Hardening Effects
The linear hardening model significantly affects subsurface stress distribution:
$$\sigma_{\text{hardened}} = \sigma_y + K(\varepsilon_p)^n$$
where K is the strength coefficient and n represents the hardening exponent.
| Hardening Ratio | Surface Stress (MPa) | Plastic Strain (%) |
|---|---|---|
| Et = 0 | 387 | 0.152 |
| Et = 1%E | 402 | 0.138 |
| Et = 3%E | 425 | 0.121 |
6. Conclusion
The finite element analysis of helical gear contact characteristics reveals:
- Plastic deformation increases contact forces by 0.11-3.13% depending on load levels
- Frictional effects elevate root stresses by 15-20% at μ = 0.15
- Thermal softening reduces peak contact pressures by 4-7%
- Material hardening significantly alters subsurface stress gradients
Experimental validation confirms the simulation accuracy with maximum errors below 20% in stress predictions and 7% in thermal analysis. This comprehensive approach enables precise prediction of helical gear performance under complex operating conditions.