
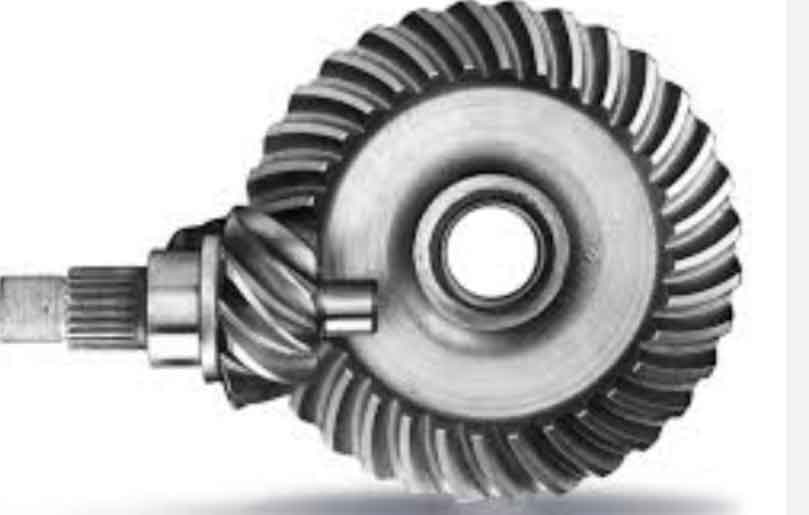
Hypoid gears, characterized by their offset axes and complex tooth geometry, are critical components in automotive drivetrains. This study investigates the contact fatigue behavior of hypoid gears through finite element analysis (FEA), focusing on stress distribution and fatigue life prediction using ANSYS Workbench.
1. Geometric Modeling and Material Properties
The hypoid gear pair consists of a pinion (14 teeth) and gear (30 teeth) with the following parameters:
| Parameter | Pinion | Gear |
|---|---|---|
| Pitch Diameter (mm) | 57.5 | 103.0 |
| Spiral Angle (°) | 28.5 | 68.4 |
| Face Width (mm) | 20 | 20 |
The material 20Cr2Ni4A steel properties are defined by:
$$
\begin{cases}
E = 207\ \text{GPa} \\
\nu = 0.29 \\
\sigma_y = 1,292\ \text{MPa} \\
\rho = 7,800\ \text{kg/m}^3
\end{cases}
$$
2. Contact Mechanics Fundamentals
The Hertzian contact stress for hypoid gears is calculated using:
$$
\sigma_H = \sqrt{\frac{F}{\pi b} \cdot \frac{E_1 E_2}{(1-\nu_1^2)E_2 + (1-\nu_2^2)E_1}}
$$
Where \( F \) is normal load and \( b \) is contact semi-width. For hypoid gear meshing, the equivalent curvature radius \( R_{eq} \) becomes:
$$
\frac{1}{R_{eq}} = \frac{1}{R_1} + \frac{1}{R_2} \pm 2\sin\phi
$$
3. Finite Element Implementation
The FEA model contains 14,054,543 elements with refined meshing at contact zones. Boundary conditions include:
| Parameter | Value |
|---|---|
| Pinion Speed | 2,750 rpm |
| Gear Torque | 2,000 Nm |
| Friction Coefficient | 0.1 |
4. Stress and Strain Analysis
The maximum equivalent von Mises stress distribution follows:
$$
\sigma_{eq} = \sqrt{\frac{1}{2}[(\sigma_1-\sigma_2)^2 + (\sigma_2-\sigma_3)^2 + (\sigma_3-\sigma_1)^2]}
$$
Results show stress concentration at the concave contact surfaces:
| Component | Max Stress (MPa) | Max Strain |
|---|---|---|
| Pinion | 183.49 | 0.00323 |
| Gear | 217.96 | 0.00317 |
5. Fatigue Life Prediction
The modified Miner’s rule estimates fatigue life:
$$
D = \sum\frac{n_i}{N_i} \leq 1
$$
Where \( n_i \) is cycle count and \( N_i \) is cycles to failure at stress level \( \sigma_i \). The P-S-N curves for 95% reliability yield:
$$
N_f = \left(\frac{\sigma_a}{\sigma_f’}\right)^{-b}
$$
Simulation results reveal minimum fatigue life of \( 2.241 \times 10^6 \) cycles at maximum stress locations.
6. Parametric Sensitivity
Key factors affecting hypoid gear performance:
| Parameter | Stress Sensitivity (%) | Life Sensitivity (%) |
|---|---|---|
| Spiral Angle | ±12.7 | ∓18.4 |
| Offset Distance | ±9.3 | ∓14.2 |
| Surface Roughness | +15.1 | -22.8 |
7. Optimization Strategies
For enhanced hypoid gear performance:
$$
\text{Optimization Index} = \frac{\sigma_{max}^{-1} \cdot L_{10}^{0.5}}{m^{0.3}}
$$
Where \( L_{10} \) is rated life and \( m \) is mass. Recommended modifications include:
- Tooth profile crowning (3-5 μm)
- Residual compressive stress treatment (-400 MPa)
- Surface roughness reduction (Ra ≤ 0.4 μm)
This comprehensive analysis demonstrates that proper design and simulation of hypoid gears significantly improves load capacity while maintaining compact dimensions. The methodology provides valuable insights for developing high-performance hypoid gear systems in automotive and industrial applications.