The composition of a certain type of subway vehicle is:+Tc-M-M-T-M-Tc+. Among them,+is a semi-automatic coupler, – is a semi permanent rod coupler, M is a high-speed train without a driver’s cab, Tc is a trailer with a driver’s cab, and T is a trailer without a driver’s cab. The passenger capacity and other data of a certain subway vehicle under various operating conditions are shown in Table 1.
| Operational status | Number of passengers with cab trailer | Vehicle weight with driver’s cab trailer | Number of Trailer Passengers | Trailer vehicle weight | Number of high-speed train passengers | Motor vehicle weight | Number of passengers in the subway vehicle group | Vehicle weight of subway vehicle group |
| Maintenance status AW0 | 0 | 30 | 0 | 28 | 0 | 35 | 0 | 193 |
| Full seat state AW1 | 36 | 32.16 | 42 | 30.52 | 42 | 37.52 | 240 | 207.4 |
| Staffing status AW2 | 226 | 43.56 | 243 | 42.58 | 243 | 49.58 | 1424 | 278.44 |
| Overloading status AW3 | 316 | 48.96 | 340 | 48.4 | 340 | 55.4 | 1992 | 312.52 |
1. Establishment of finite element model for helical gear pairs
In this chapter, a helical gears from a subway vehicle gearbox supplied by a subway company was selected as the research object, and a finite element model was established. The parameters of the helical gears are shown in Table 2.
| Type | Modulus | Number of teeth | Pressure angle/(°) | Tooth width/(mm) | Spiral angle/(°) | Displacement coefficient |
| Pinion | 6 | 18 | 20 | 70 | 19 | 0.488 |
| Gear | 6 | 62 | 20 | 60 | 19 | 0.257 |
The material model of the subway transmission helical gears is 18CrNiMo7-6, and the material parameters are shown in Table 3.
| Density (g/cm3) Elastic modulus (GPa) Poisson’s ratio Fatigue limit (MPa) | Elastic modulus (GPa) | Poisson’s ratio | Fatigue limit (MPa) |
| 7.85 | 235 | 0.3 | 385.5 |
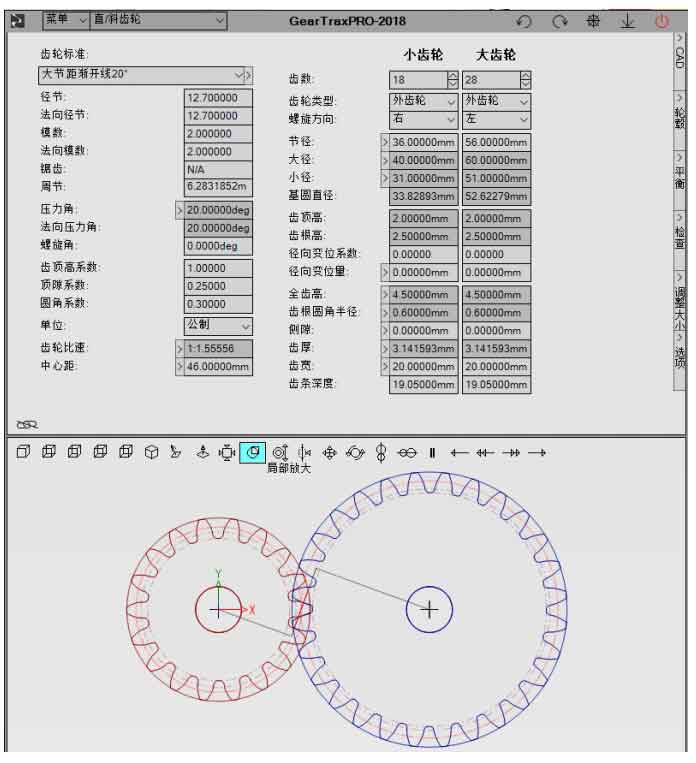
The three-dimensional model of the subway transmission helical gears was established by the plugin GearTrax provided by Camnetics for Solidworks software. GearTrax can quickly create solid models such as spur gears, helical gears, and racks in Solidworks. The GearTrax operation interface is shown in Figure 1.
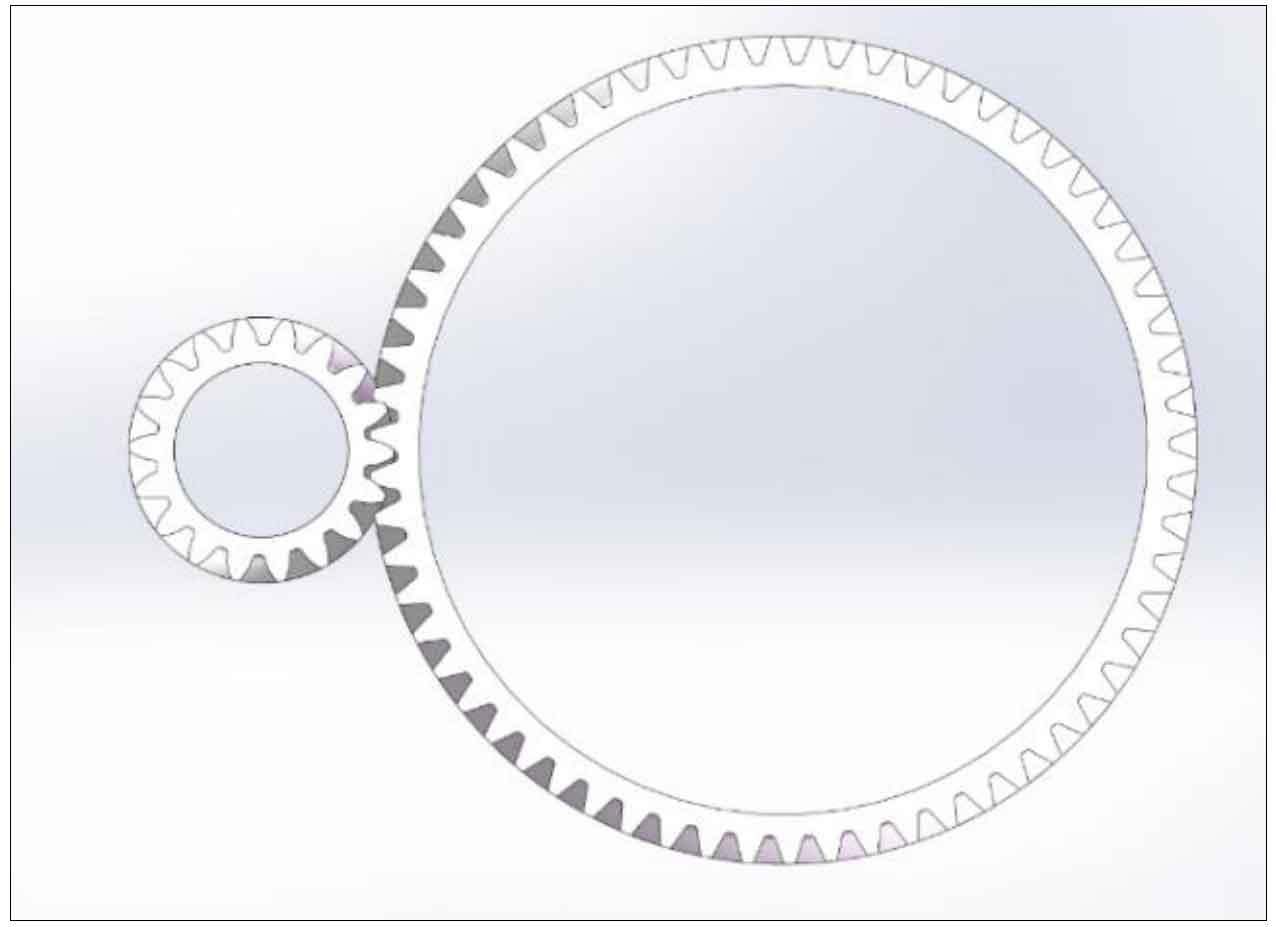
Based on the parameters of the helical gears in Table 2-2, establish a three-dimensional model of the helical gear pair, and adjust and simplify the position of the model to ensure that the helical gears pair model has no interference and sufficient accuracy, while reducing the complexity of subsequent model processing. The final 3D model of the subway transmission helical gears is shown in Figure 2.
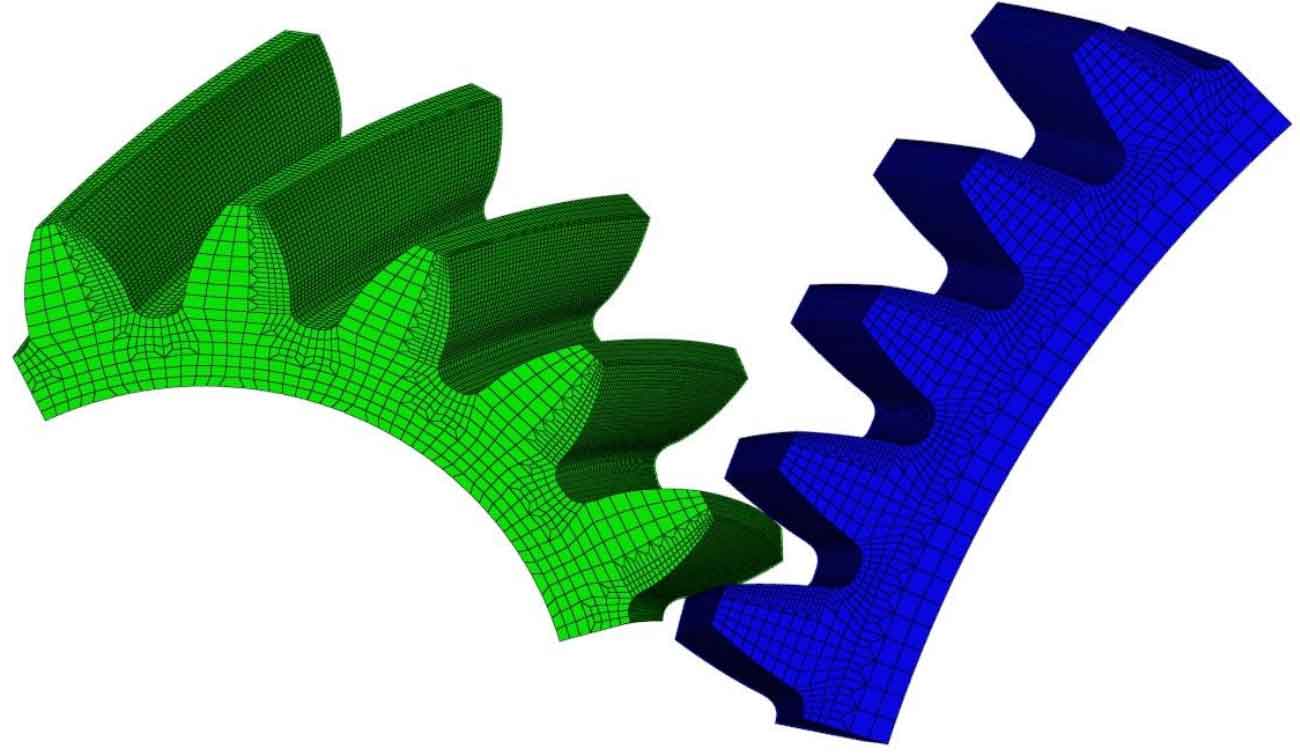
Import the 3D model of helical gears established using the GearTrax plugin into the professional finite element pre-processing software Hypermesh for pre-processing. Due to the fact that the analysis of the dynamic meshing process of helical gears is a typical high non-linear contact problem, which requires a large amount of calculation and high mesh quality during simulation, in order to ensure the accuracy of finite element analysis results and high time cost efficiency, individual teeth of the pinion and gears are divided into meshes, and the meshes at the contact area and tooth root are encrypted to form five pairs of meshing teeth, The final finite element model has 147050 grids and 191109 nodes. The model is shown in Figure 3 after grid partitioning.
2. Load analysis of subway transmission helical gear pairs
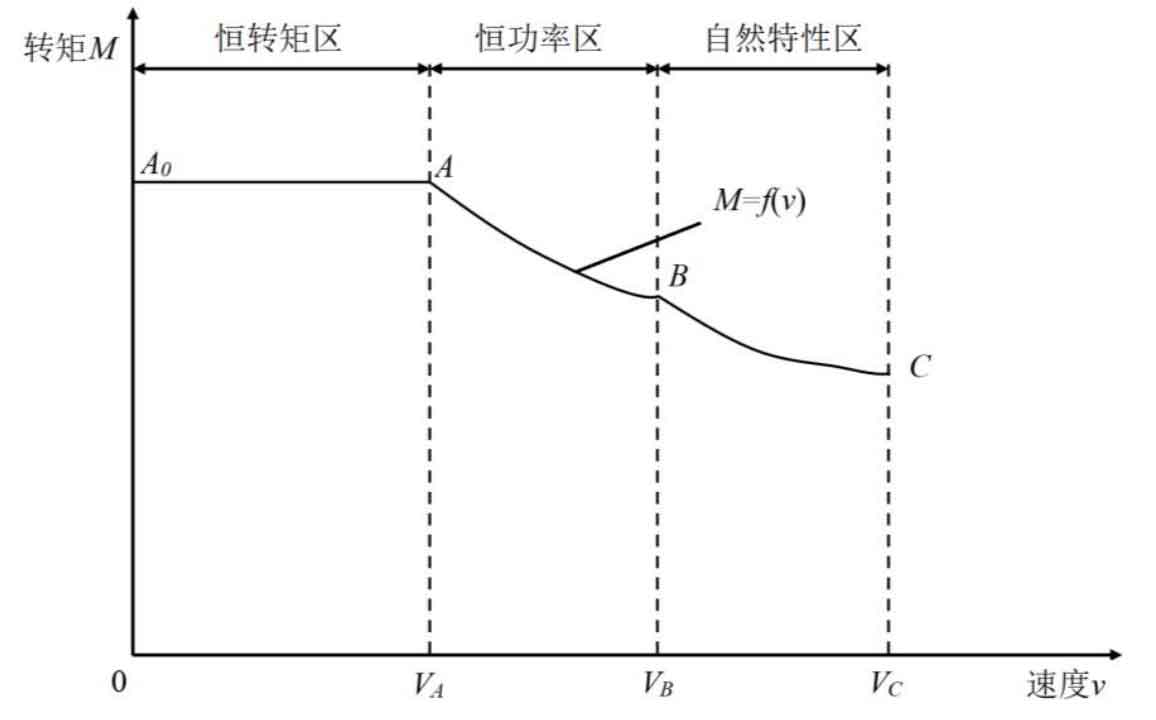
The traction characteristic curve of the electric motor is shown in Figure 4, which consists of three parts: constant torque zone, constant power zone, and natural characteristic zone. The constant torque zone A0-A belongs to the starting stage of the traction motor, at which time the torque of the traction motor remains unchanged, and the termination speed in this area is VA. Afterwards, the train enters the constant power zone A~B, which is the most common operating area where the traction motor can exert its maximum efficiency. The traction force of the train in this area decreases as the operating speed increases, and the end speed in this area is VB. When the train runs above VB, the traction motor enters the natural characteristic zone B~C for operation. The starting speed of the subway vehicle in the constant power zone studied in this chapter is 40km/h, and the maximum running speed of the train is 80km/h. The average running speed of the train without station stopping time is 50km/h.
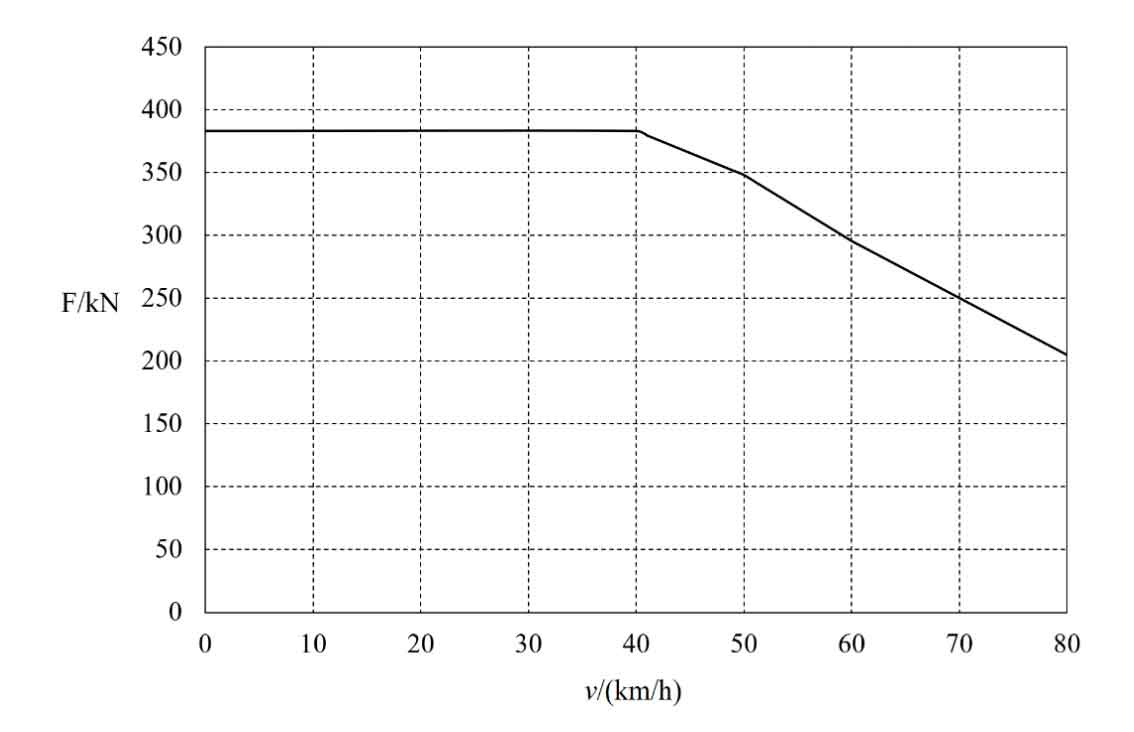
The traction force around the wheels of the subway vehicle varies with the operating speed of the subway vehicle, as shown in Figure 5. It can be seen that the traction force around the wheels of the subway vehicle remains unchanged within the range of 0~40km/h, at 380kN. When the speed of subway vehicles decreases between 40km/h and 80km/h, the traction force decreases to 179kN when the vehicle speed reaches 80km/h. Divide the operating conditions of the subway vehicle into four types according to the operating speed range. The torque of the gear and the speed of the pinion under different working conditions are shown in Table 4.
| Working condition I | Working condition II | Working condition III | Working condition IV | |
| Operating speed (km/h) | 0-40 | 40-50 | 50-60 | 60-80 |
| Torque (N · m) | 20161 | 18270 | 13466 | 8400 |
| Speed (rad/s) | 71.42 | 128.55 | 157.11 | 204.72 |
3. Interaction and boundary conditions of helical gear pair models
To perform transient dynamic analysis on the subway transmission helical gears, it is necessary to save the finite element model processed by Hypermesh as an inp file and import the pinion and gear components separately into ABAQUS software. According to Table 3, define the material parameters of 18CrNiMo7-6 in ABAQUS, then create the cross-section, assign the cross-section to all components of the helical gears model, and create an instance with non independent instance type. Create analysis steps in the ABAQUS analysis step module, using algorithm types such as: dynamic, implicit; Set geometric nonlinearity to on; Set the maximum incremental steps to 100000 to ensure appropriate calculation speed; The solving technique uses the complete Newton method, also known as the Newton method, to ensure the accuracy of the calculation.
Create a rotation axis at the center of the pinion and gear respectively, and set the midpoint position as the reference point for rp; Next, create the inner surface of the helical gears, and establish motion coupling constraints between the inner surfaces of the two gears and the reference point rp at the midpoint of the rotation axis of the two gears, in order to apply boundary conditions to the helical gears in the future; And establish a contact relationship between the contact tooth surfaces of the two gears. When setting the interaction contact properties, the normal behavior is set to, the tangential behavior is set to penalty contact, and the friction coefficient is set to 0.1. The normal behavior of the “hard” contact relationship allows for separation of the contact surface after contact, thereby simulating the meshing state of the helical gears during motion. Surface to surface contact, set from node/surface adjustment only to remove interference, can ensure that when the analysis starts, the surface will be adjusted to precise contact with the main surface. After completing the interaction and other settings, the model is shown in Figure 6.

According to Table 4, the torque load in the direction of rotation is set for the gear in the load module, and the rotational speed in the direction of rotation is set for the pinion. The torque direction of the gear is clockwise around the rotation axis, and the rotational speed of the pinion is also clockwise around the rotation axis, ensuring the simulation of the working characteristics of the helical gears pair transmission of subway vehicles.
4. Analysis of finite element model results
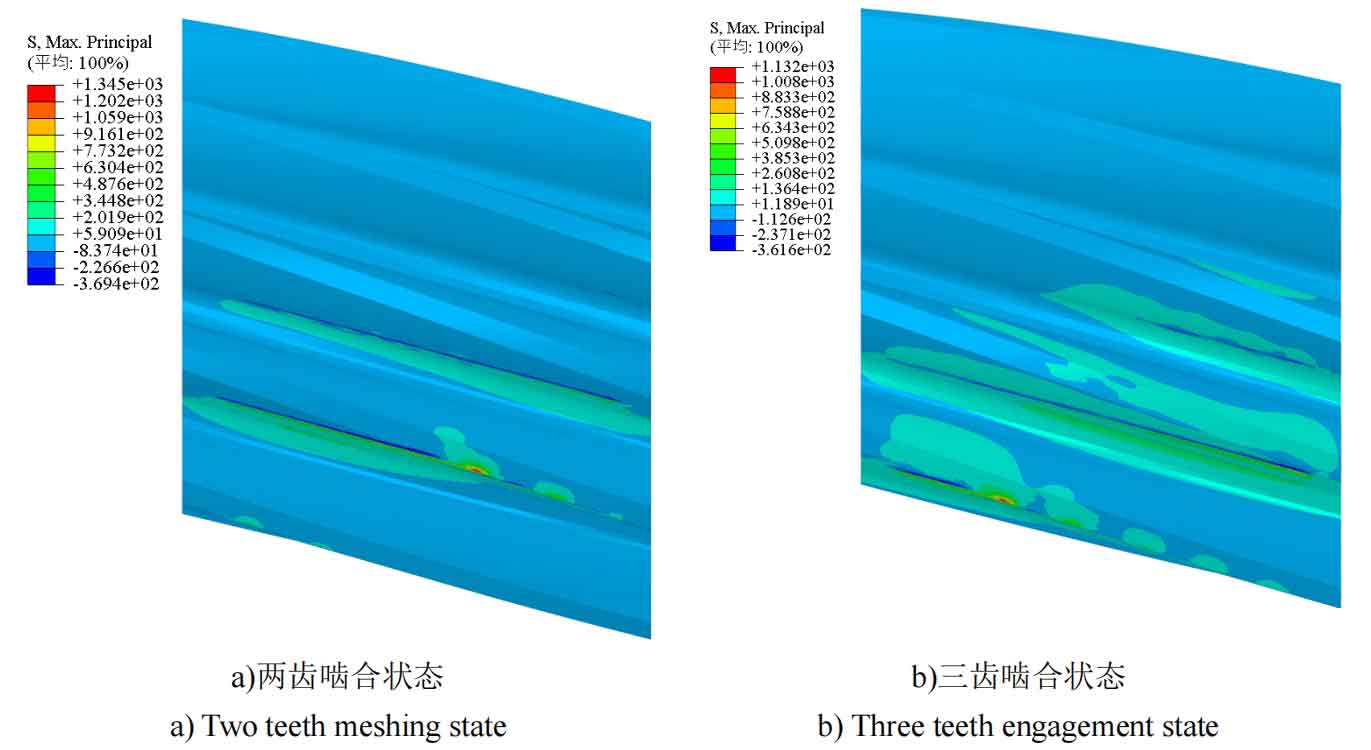
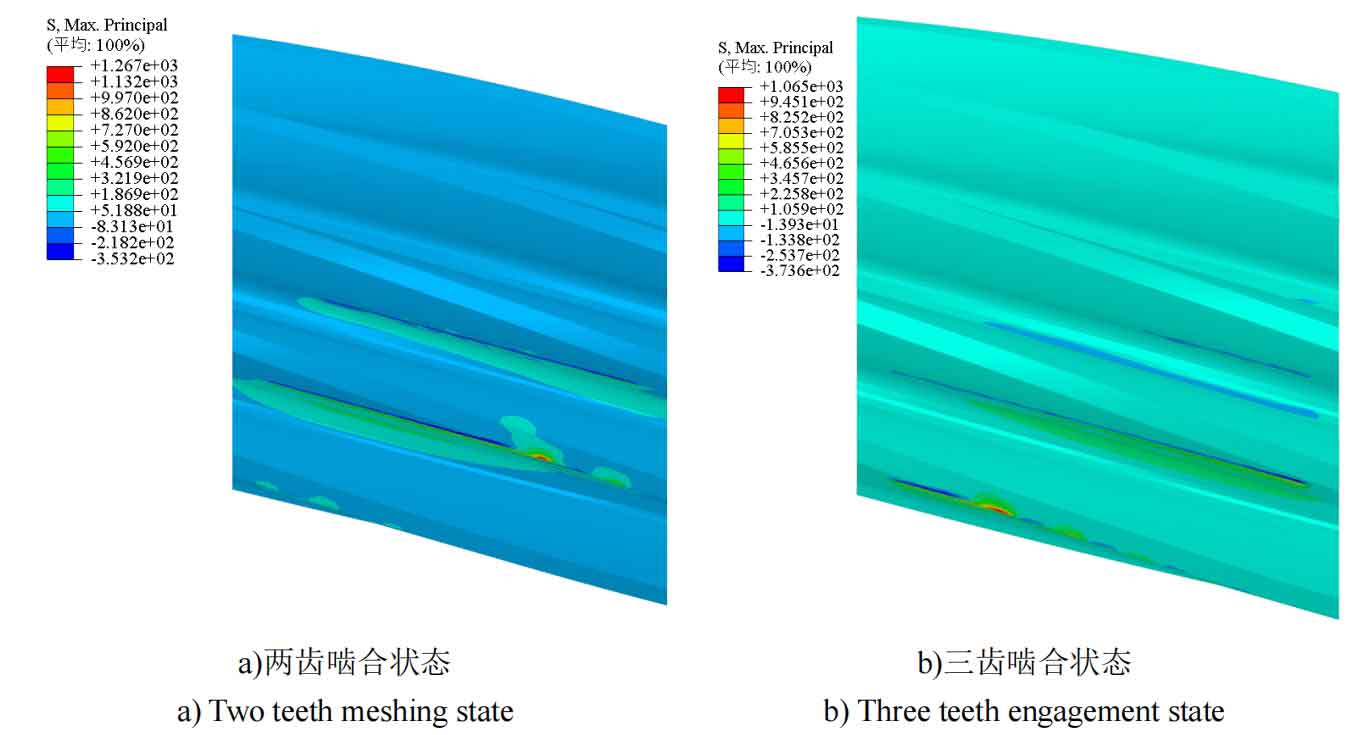
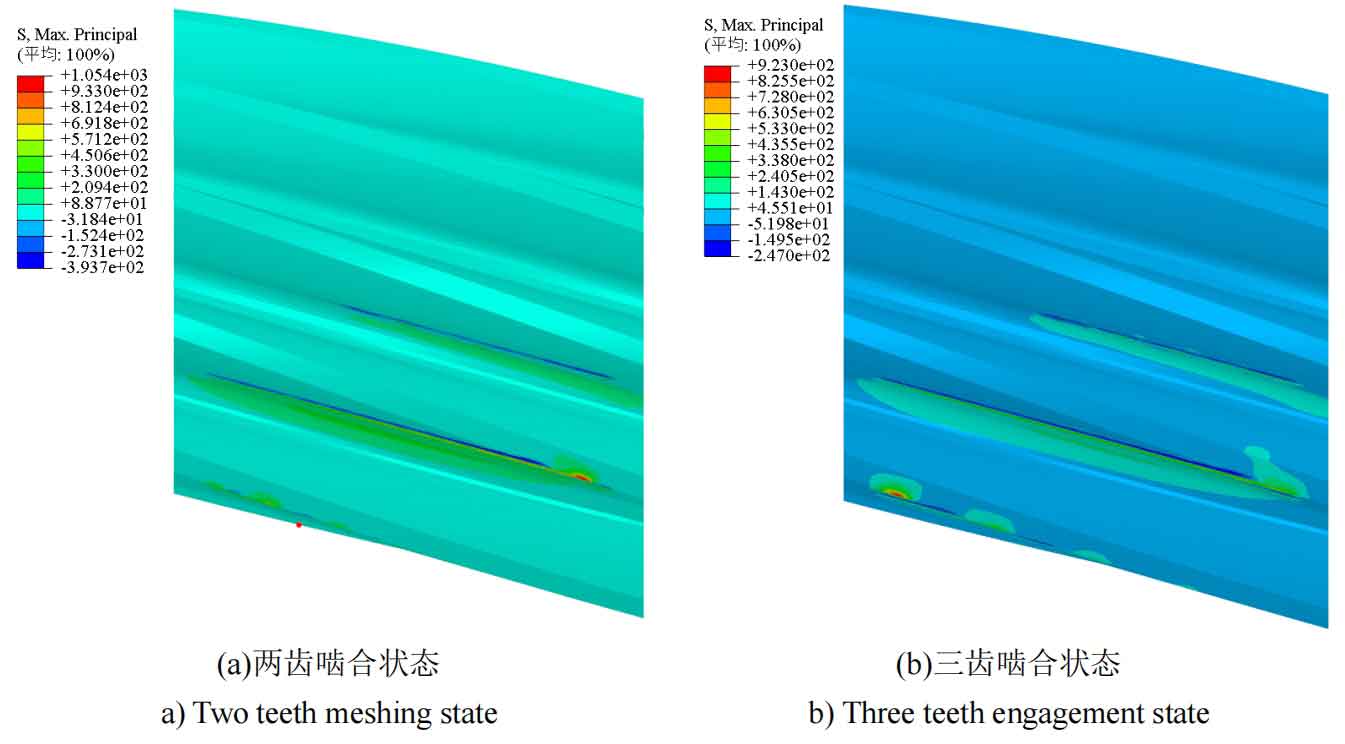
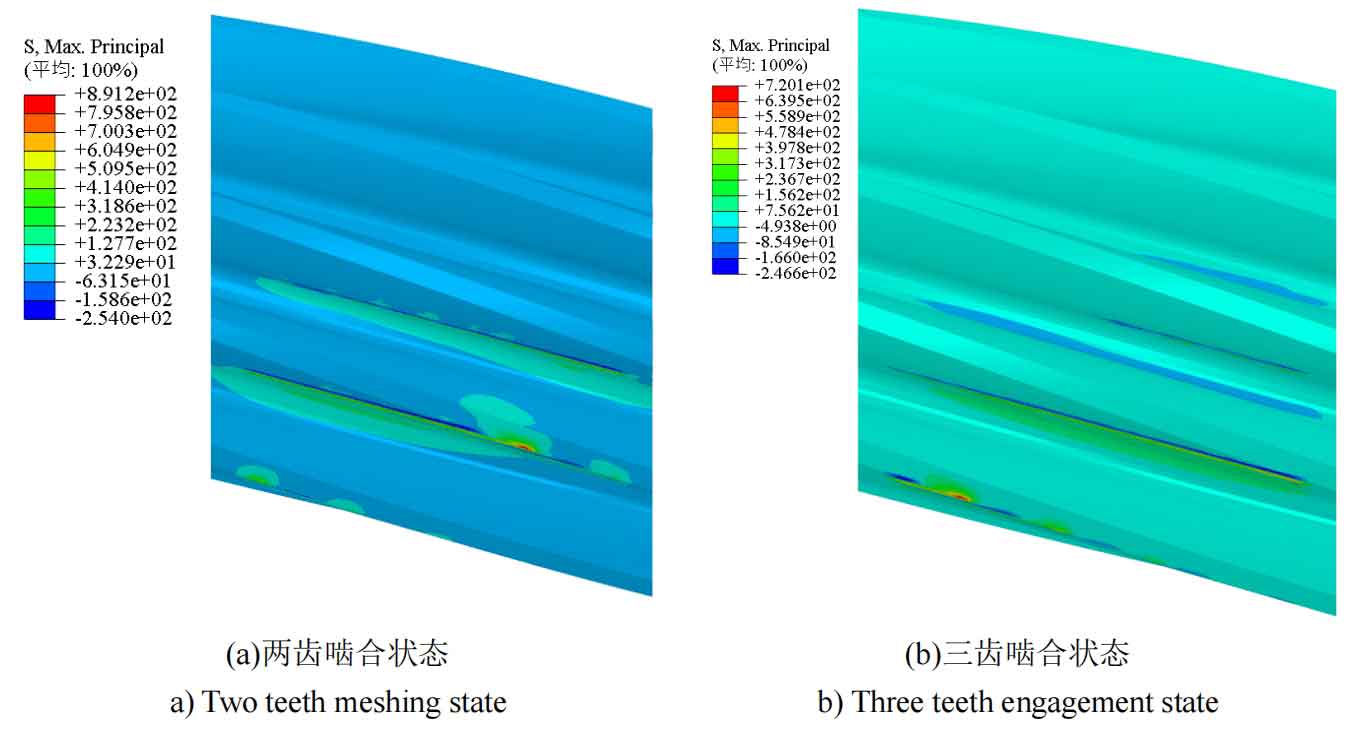
According to the finite element analysis results, the helical gears pair is always in a state of alternating meshing of multiple teeth, with alternating meshing of two teeth and three teeth. The transient dynamic analysis results of helical gears meshing under four working conditions shown in Table 4 are shown in Figures 7 to 10.
By extracting the transient dynamic analysis results of the helical gears pair meshing, the stress values at the maximum bending stress of the tooth root under operating conditions I (0-40km/h), II (40-50km/h), III (50-60km/h), and IV (60-80km/h) can be obtained, respectively. The maximum bending stress at the tooth root under these four operating conditions is shown in Table 5.
| Working conditions | Working condition I | Working condition II | Working condition III | Working condition IV |
| Maximum stress (MPa) | 603.375 | 472.877 | 245.208 | 185.659 |
According to Table 5, it can be seen that there is a significant difference in the maximum tooth root bending stress of the transmission helical gears of subway vehicles under different working conditions, with a maximum of more than three times. The maximum root bending stress of the helical gears is 603.375 MPa within the speed range of 0-40 km/h for subway vehicles. This is because the traction state of the subway vehicle’s electric motor is in the constant torque zone, and the traction force around the wheels is also in the maximum range. The maximum tooth root bending stress of the helical gears in the subway vehicle speed range of 40-50km/h is the second highest, at 472.877MPa. The reason is that at this time, the traction state of the subway vehicle’s electric motor is in the constant power zone, the torque decreases, and the wheel traction force also decreases. For the same reason, the maximum tooth root bending stress of the helical gears is lower in the subway vehicle speed range of 50-60km/h, at 245.208MPa. The maximum tooth root bending stress of the helical gears is the lowest in the speed range of 50-60km/h for subway vehicles, which is 185.659MPa. The reason is that at this time, the traction state of the subway vehicle’s electric motor is already in the natural characteristic zone, the torque is reduced to the lowest, and the wheel traction force is also reduced to the lowest. Only when the maximum root bending stress of the helical gears under working conditions I and II is greater than the fatigue limit of the material, it causes bending fatigue damage to the helical gears.
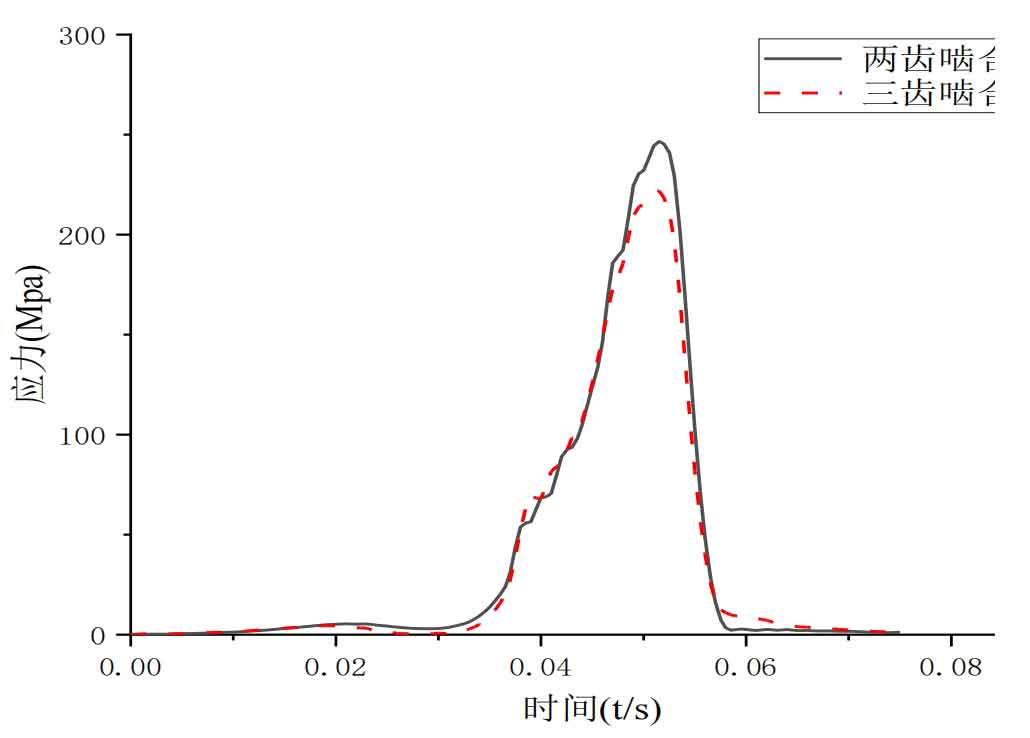
Taking working condition III as an example, from Figure 11 and finite element analysis results, it can be seen that when transitioning from a three tooth meshing state to a two tooth meshing state, the position where the maximum bending stress at the tooth root occurs shifts from the tooth root near the helical gears end face of the middle tooth of the three teeth to the tooth root in the middle of the helical gears. The maximum bending stress of the tooth root in a two tooth meshing state is 245.208 MPa, which is greater than the maximum bending stress of the tooth root in a three tooth meshing state of 222.022 MPa.
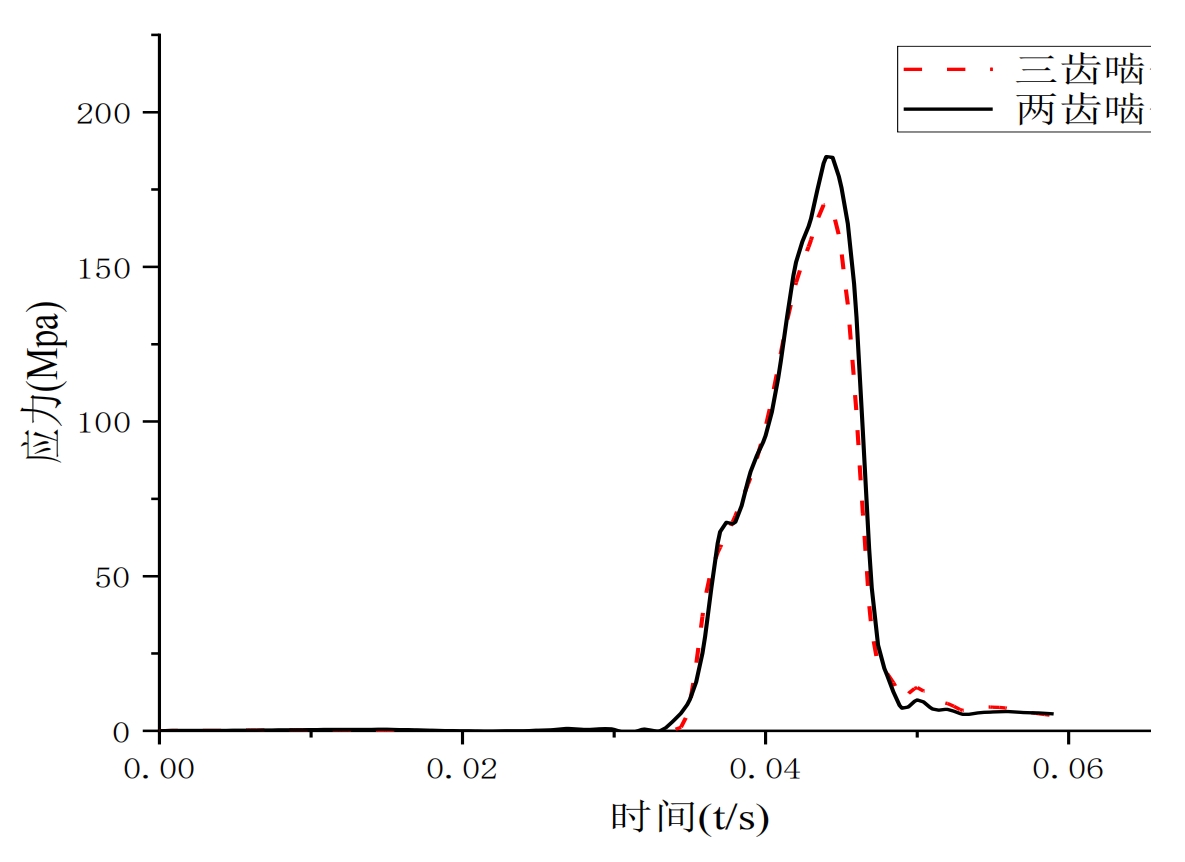
Comparing the trend of the maximum bending stress at the tooth root of working conditions III and IV, it can be seen from Figure 12 that when transitioning from a three tooth meshing state to a two tooth meshing state, the displacement trend of the maximum bending stress at the tooth root is consistent with the situation in working conditions III. The maximum bending stress at the tooth root in a two tooth meshing state is 185.659, which is also greater than the maximum bending stress at the tooth root in a three tooth meshing state of 170.859 MPa, similar to working condition III.

