
Abstract
Based on a comprehensive review of existing literature, this paper analyzes the causes of residual stress in gear milling processing of spiral bevel gears. A partial three-dimensional model of the gear blank and milling tool, based on actual dimensions, is established. The motion of the Computer Numerical Control (CNC) axes is transformed into the relative position adjustment between the gear blank and gear milling cutter. Through orthogonal design, we change the combinations of gear milling processing parameters and utilize the ABAQUS finite element software to analyze the influence of different processing parameters on the nature, magnitude, and distribution of residual stress on the surface of spiral bevel gears. Finally, factors that should be prioritized when improving the processing efficiency and quality of aviation spiral bevel gears are presented. This study provides a certain reference significance for the optimization technology of aviation spiral bevel gear machining.
1. Introduction
Spiral bevel gears are widely used in aviation, aerospace, transportation, machinery, and instrumentation manufacturing due to their smooth transmission, heavy load capacity, high speed, large contact ratio, and low noise. With the rapid development of the aviation industry, there are stronger requirements for high speed, heavy load, long life, low noise, and high stability. Fatigue failure is the most common failure mode of spiral bevel gears, and research shows that improving the stress condition can effectively enhance the fatigue strength of spiral bevel gears. Scholars from both domestic and foreign countries have conducted extensive research on the analysis and control of residual stress in gear milling process of parts. In this paper, the proposed low-stress machining technology aims to improve the gear processing residual stress values and their distribution trends from the perspective of improving the processing technology of aviation spiral bevel gears, thereby significantly increasing the gear’s carrying capacity, effectively controlling noise, and extending its service life.
2. Research on Residual Stress in Gear Milling Processing of Spiral Bevel Gears
Research and practice have shown that the nature and magnitude of cutting residual stress have a significant impact on the performance of precision parts and heavy-load components. Most research on gear residual stress is based on experimental testing. For example, Giovanni et al. used neutron diffraction to measure the residual stress between the gear substrate and the molybdenum coating. Albertini et al. also employed neutron diffraction to test the residual stress in automotive crown gears under thermal loading, achieving good results. However, experimental methods have disadvantages such as high costs and unclear laws, making it necessary to conduct simulation analysis before experiments.
3. Simulation Process
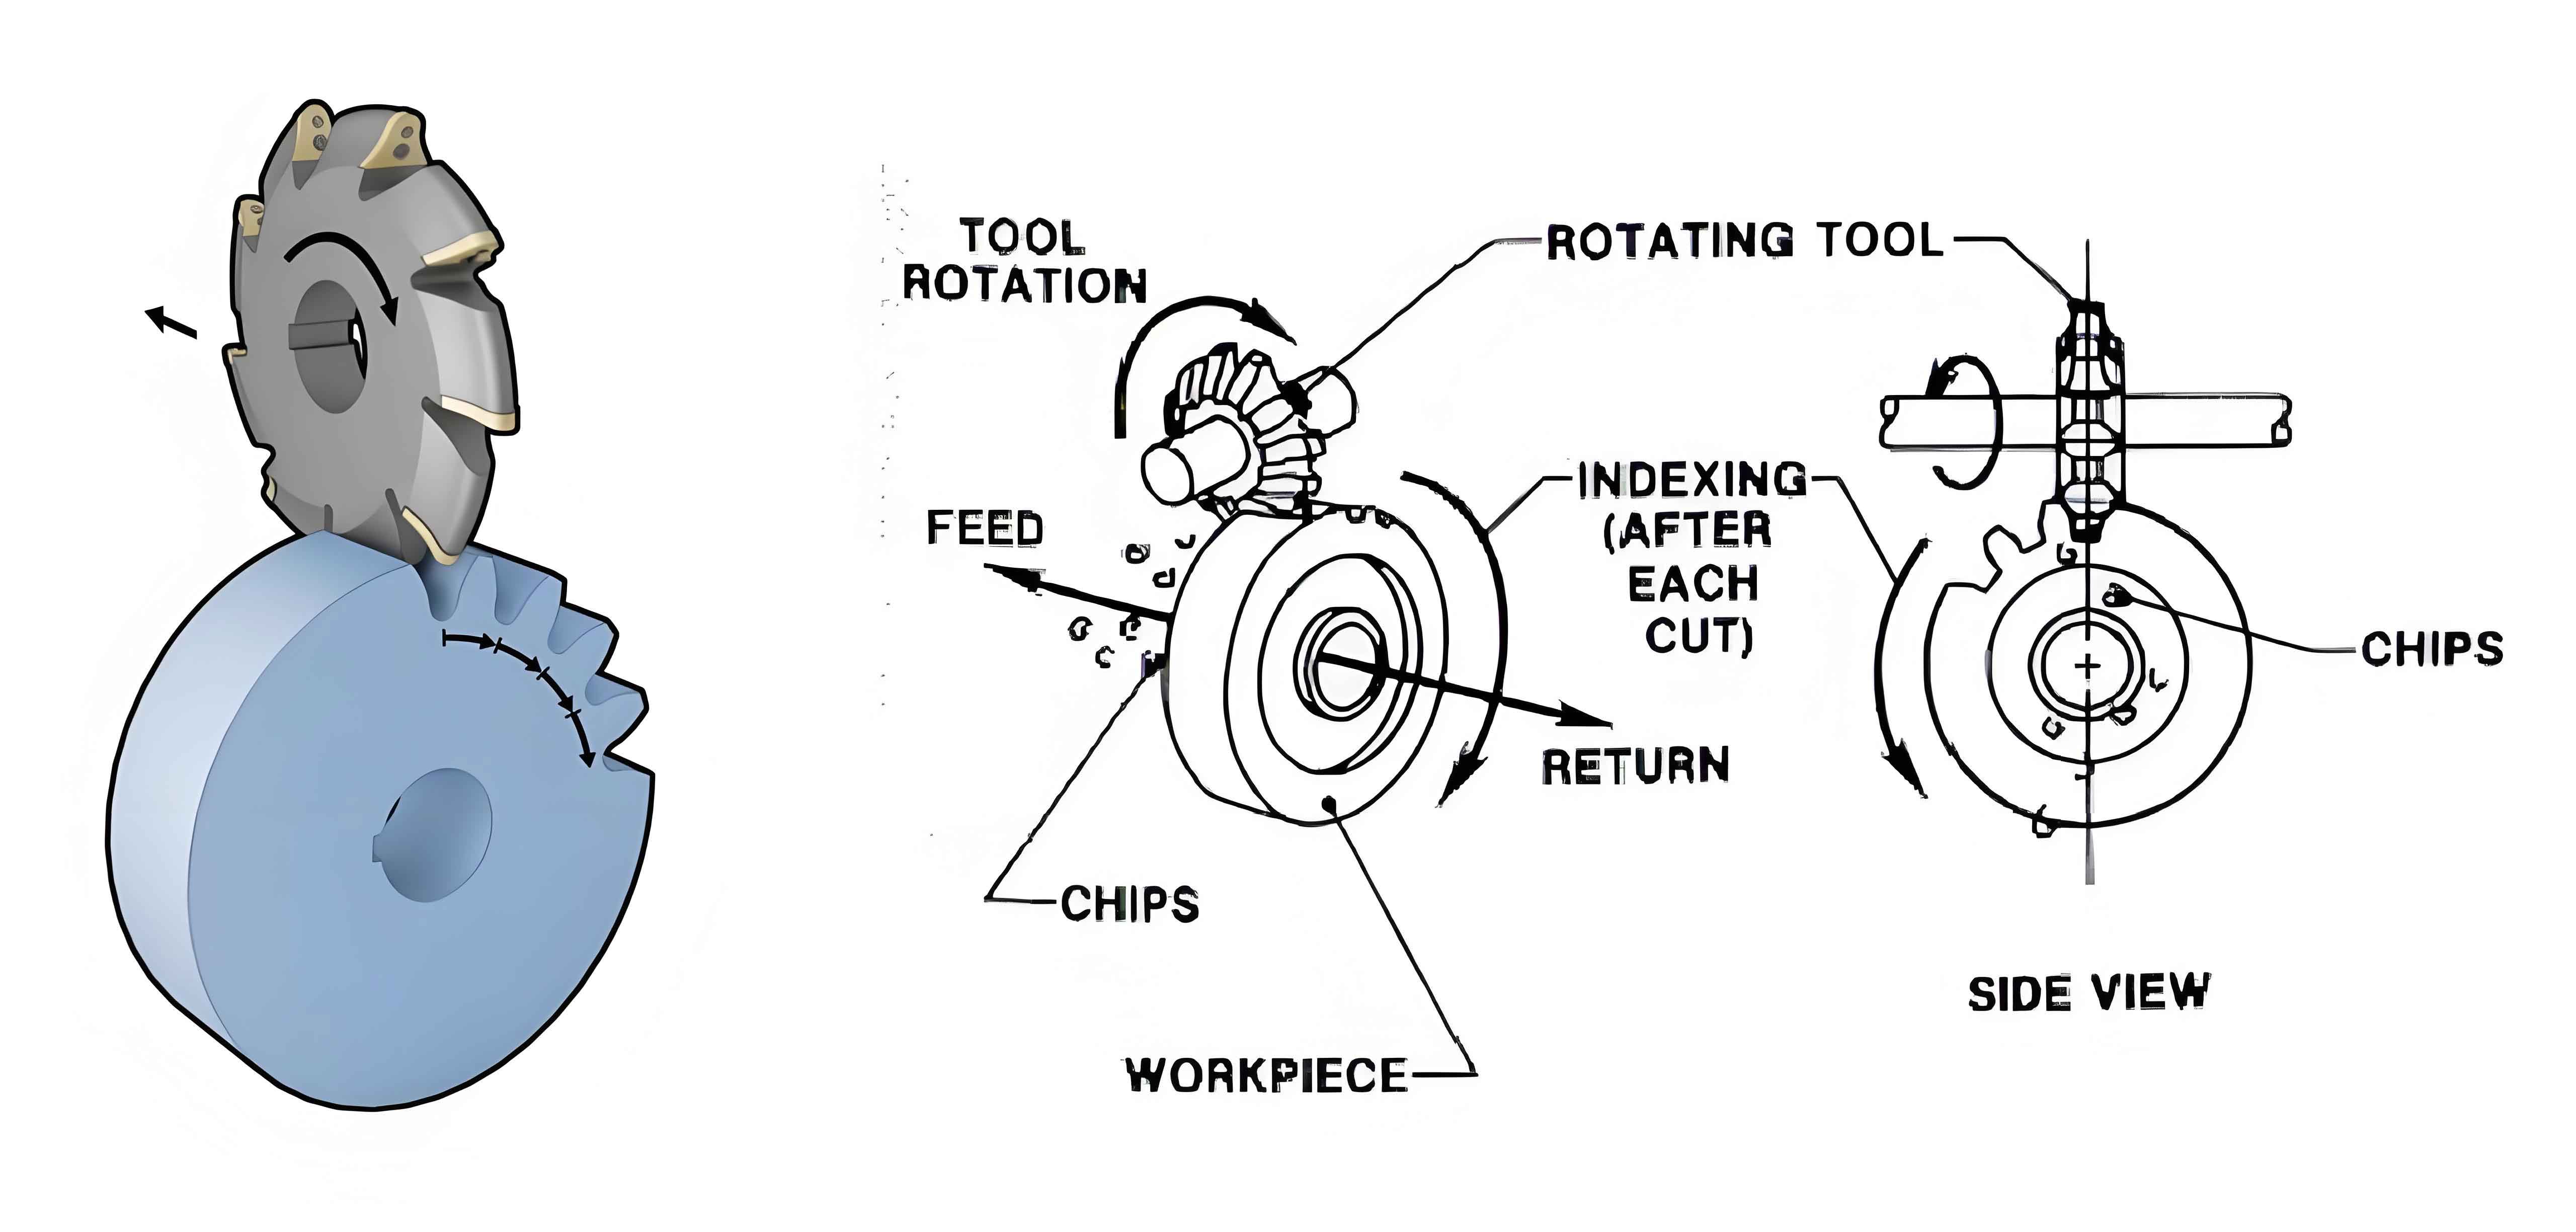
Currently, helicopter and aerospace engine transmission systems in China utilize Gleason spiral bevel gears processed by the SGM method. Therefore, this paper focuses on studying and analyzing the residual stress in the processing of these gears using this method.
3.1 Establishment of Gear Milling Simulation Model
During the simulation of spiral bevel gear milling, the radial tool position, angular tool position, vertical wheel position, bed position, and axial wheel position need to be calculated first.
Using CATIA three-dimensional modeling software, combined with actual dimensions, partial structural models of spiral bevel gear blanks and corresponding concave and convex gear milling tools are created. Based on the calculated adjustment parameters for large wheel processing, the assembly is imported into the ABAQUS finite element analysis software.
3.2 Material Parameters and Failure Settings
During processing simulations, the gear material is 45# steel with a density of 7.85g/cm³, a Poisson’s ratio of 0.3, and an elastic modulus of 2.1×10^5 MPa. Its thermal conductivity, coefficient of linear expansion, and specific heat capacity are shown in Tables 1, 2, and 3, respectively. The tool is set as a rigid body.
Table 1. Thermal Conductivity
| Temperature (℃) | Thermal Conductivity (W/(m·℃)^-1) |
|---|---|
| 20 | 50.24 |
| 100 | 46.06 |
| 400 | 41.87 |
| 700 | 31.82 |
Table 2. Coefficient of Linear Expansion
| Temperature (℃) | Coefficient of Linear Expansion (10^-6/℃) |
|---|---|
| 20 | 9.1 |
| 20~200 | 12.32 |
| 200~400 | 13.71 |
| 400~600 | 14.67 |
Table 3. Specific Heat Capacity
| Temperature (℃) | Specific Heat Capacity (J/(kg·℃)^-1) |
|---|---|
| 20 | 0.461 |
| 100 | 0.544 |
| 300 | 0.586 |
The Johnson-Cook failure model, which considers stress state, strain rate, and temperature, has greater adaptability. Due to its comprehensive consideration of factors and easily obtainable parameters, the J-C failure model is widely used in commercial finite element programs. Therefore, the J-C failure theory and shear failure theory are referenced for material failure theories in this study. Parameters are detailed in Reference.
3.3 Simulation Process Design
These formulas provide a way to include each motion axis and tool adjustment parameter. The mesh division and boundary condition definitions of the model in ABAQUS, respectively. To improve calculation accuracy and reduce computation time, the gear blank is cut and divided to facilitate reasonable mesh density settings. Boundary conditions are set by constraining the freedom of movement on the outer lateral surface of the gear blank. The entire simulation process involves three motions: rotation of the gear blank around its central axis, rotation of the tool around the tool axis, and rotation of the tool axis around the central axis of the gear blank. The ratio of their rotational rates satisfies the machine tool roll ratio. Additionally, to reduce the cutting depth and approximate the actual processing process, a V-groove is cut along the tool movement direction in the cutting area. To reduce calculation time and improve efficiency, the concave and convex milling tools of the spiral bevel gear are merged in the simulation.
During the simulation analysis, cutting speed, cutting depth, and feed rate are considered variables. Based on actual processing experience, the cutting speed is 40m/min, the cutting depth is generally 2mm, and the feed rate is 0.5 rad/s. Near these empirical values, variables are set, and an orthogonal test scheme is used for optimization combinations, resulting in a total of 9 sets of experiments. The combination is shown in Table 4.
Table 4. Orthogonal Test Scheme Combination Table
| Test No. | Cutting Speed (rad/s) | Feed Rate (rad/s) | Cutting Depth (mm) |
|---|---|---|---|
| 1 | 3.8277 | 0.43 | 1.5 |
| 2 | 3.8277 | 0.52 | 1.5 |
| 3 | 3.8277 | 0.6 | 1.5 |
| 4 | 4.3745 | 0.42 | 2 |
| 5 | 4.3745 | 0.5 | 1.5 |
| 6 | 4.3745 | 0.63 | 3 |
| 7 | 4.9213 | 0.4 | 1.5 |
| 8 | 4.9213 | 0.53 | 3 |
| 9 | 4.9213 | 0.62 | 2 |
4. Simulation Results and Analysis
The simulation outcomes for the ninth experimental trial within the orthogonal testing scheme. on the other hand, demonstrates how stress is extracted by acquiring data from 20 points at a specific depth layer. The graphical representation portrays the varying trends of simulated stress along the depth for all nine experimental trials. The stress analyzed herein specifically refers to the tangential stress exerted on gear milling cutter. To minimize computational errors, the residual stress at each depth is determined by averaging the stresses of 20 grid points situated in the middle of the respective depth layer. Table 5 compiles the stress values obtained from various depths across all nine simulation setups, following a series of averaging calculations. Please note that the table presents approximate , whereas the accuracy for plotting the graphs is higher. Depth measurements are in millimeters, and stress measurements are in megapascals.
It is evident that the residual stress values converge among several test trials after reaching a depth of 3mm. Hence, the differences in the mean stress values at varying depths are predominantly influenced by the stress state within the topmost 3mm. Additionally, assessing the mean stress across different layers not only minimizes errors but also reflects the overall trend of surface residual stress.
Table 6 presents the range analysis of the orthogonal test scheme. It illustrates the impact of each cutting parameter on the residual stress by examining the orthogonal values of the residual stress, derived using the range analysis method of orthogonal testing. Sequentially exhibit the variation trends of residual stress with respect to cutting speed, cutting depth, and feed rate, respectively. It’s worth noting that with advancements in machining technology, both cutting speed and feed rate have increased. Thus, the trends depicted represent the influence within a localized range of amplitudes.
Looking at the mean residual stress values in Table 6, a residual compressive stress is observed within the depth range from the gear surface to 7mm. Comparing Ⅰ1, Ⅱ1, and Ⅲ1 indicates that as the cutting speed increases, the residual compressive stress on the gear surface first rises and then decreases. From Ⅰ2, Ⅱ2, and Ⅲ2, it is apparent that as the feed rate increases, the residual compressive stress on the gear surface initially decreases and then increases. Similarly, by analyzing Ⅰ3, Ⅱ3, and Ⅲ3, it is evident that as the cutting depth increases, the residual compressive stress on the gear surface gradually intensifies.
Moreover, the range values of the three processing parameters in Table 6 determine their influence on residual stress in descending order: cutting depth, cutting speed, and feed rate. This suggests that the cutting depth significantly affects the surface residual stress during gear processing, whereas the feed rate has a relatively minor impact. Therefore, when aiming to enhance machining efficiency, it is not advisable to prioritize a larger cutting depth.
Furthermore, The trend of stress along the tangential direction at the middle 20 grid points for the nine experimental trials. To reduce errors, the stress is averaged across 12 grid points from 12 layers along the radial depth at the same point. The stress fluctuations along the tangential direction are relatively large and uneven in Groups 1, 6, and 8, while they are relatively small and uniform in Groups 3 and 5. Notably, Groups 1, 6, and 8 share a cutting depth of 3mm, whereas Groups 3 and 5 have a cutting depth of 1.5mm. Therefore, an increase in cutting depth exacerbates the unevenness of stress distribution. Since uneven residual compressive stress can adversely affect the part’s performance, larger cutting depths should not be prioritized in situations where uniformity of the part’s residual stress is critical.