
Surface integrity as a process-control problem
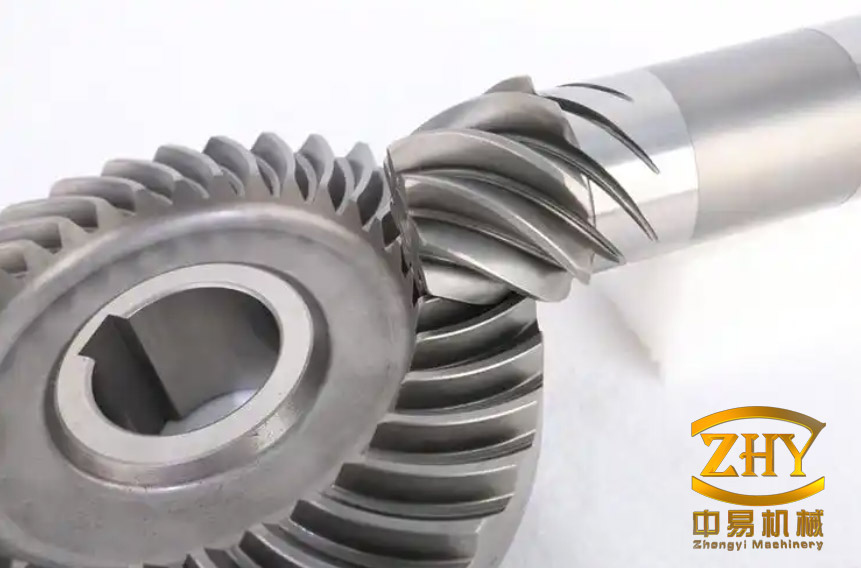
Spiral bevel gears transmit torque between intersecting shafts and are widely used in aerospace, automotive and heavy-machinery drives. Their curved teeth engage gradually, which distributes load and supports high-speed, high-torque operation. The same geometry makes the tooth flank difficult to finish: grinding is often the last manufacturing step, and it must hold tooth form while avoiding surface damage.
Residual stress is a central part of that surface integrity. A compressive layer can inhibit crack initiation and improve fatigue resistance, while tensile stress near the surface can promote crack growth and distortion. The relevant quantity is not a single surface value. Grinding produces a stress profile that changes with depth: compression near the surface, a peak compressive magnitude below it, and a transition to tension deeper in the material. Process variables such as wheel speed, depth of cut and workpiece feed shift both the peak magnitude and the depth over which it develops.
The practical question is therefore how the main grinding parameters move the compressive and tensile parts of the profile together. A local finite-element model combined with a statistical optimization scheme can answer that question within a defined process window, while also showing where the trade-offs lie.
Generating motion and the multi-abrasive model
Spiral bevel gear teeth are generated by the imaginary generating-gear principle. A cutter or grinding wheel is mounted eccentrically on a machine cradle and swings with it; the cutting surface represents a tooth of an imaginary generating gear that meshes with the workpiece. Grinding follows the same kinematic idea as milling, with a grinding wheel replacing the cutter head.
At the grit scale, grinding is not a single controlled scratch. Many abrasive grains contact the tooth surface at random positions and remove material through overlapping cuts. To represent that stochastic contact, a multi-abrasive model can use conical grits whose coordinates are generated randomly. A virtual lattice method avoids the main geometric problem: if grits are placed freely, they overlap and create unphysical clusters. The lattice divides the contact area into cells, confines each grit to one cell and then offsets it randomly inside that cell. The resulting distribution is random but spatially controlled.
For computational efficiency, the model can be reduced to a local tooth-surface segment rather than the complete gear. A representative volume of 2 mm × 1.5 mm × 0.5 mm captures the local contact scale while keeping the explicit grit count manageable. The abrasive is treated as rigid, the workpiece as an elastoplastic body, and the grit–workpiece interface uses a penalty friction model with a friction coefficient of 0.3. These choices retain the essential mechanical and thermal loading of the local contact without resolving the entire wheel and gear.
Thermomechanical material response
The workpiece material in the analysed case is AISI 4340 steel, a high-strength, tough and hardenability-controlled steel used for highly loaded gears. The abrasive and workpiece properties used in the finite-element model are summarised in the table below.
| Phase | Density (kg/m3) | Elastic modulus | Poisson ratio | Thermal conductivity (W m−1 °C−1) | Strength |
|---|---|---|---|---|---|
| AISI 4340 workpiece | 7,830 | 200 GPa | 0.29 | 38 | Yield 792 MPa; tensile 980 MPa |
| Abrasive grit | 3,480 | 706 GPa | 0.15 | 79.54 | — |
Grinding involves high strain, high strain rate and rapid heating, so the flow stress is described with the Johnson–Cook model:
\[
\sigma=(A+B\varepsilon^{n})\left(1+C\ln\frac{\dot{\varepsilon}}{\dot{\varepsilon}_{0}}\right)\left[1-\left(\frac{T-T_{0}}{T_{m}-T_{0}}\right)^{m}\right]
\]
Here \(\sigma\) is the equivalent stress, \(\varepsilon\) the equivalent plastic strain, \(\dot{\varepsilon}\) and \(\dot{\varepsilon}_{0}\) the strain rate and reference strain rate, \(T\) the workpiece temperature, \(T_{0}\) room temperature and \(T_{m}\) the melting temperature. For AISI 4340, the parameters are \(A=792\) MPa, \(B=510\) MPa, \(n=0.26\), \(C=0.014\) and \(m=1.03\). Damage is tracked with the Johnson–Cook failure criterion, using \(D_{1}=0.05\), \(D_{2}=3.44\), \(D_{3}=-2.12\), \(D_{4}=0.002\) and \(D_{5}=0.61\).
The simulation separates grinding from cooling. The workpiece base is fixed during grinding. After the grinding pass, the tool body and contact are removed, the thermal boundary conditions are reset and the cooling stage is solved. Residual stress is then extracted as the in-plane normal stress along the grinding direction. To reduce sensitivity to individual grit paths, 98 equally spaced nodes are sampled on each depth layer and averaged.
Residual stress profile after grinding
The calculated profile follows a consistent pattern. The ground surface is in compression, but the largest compressive magnitude lies below the surface. As depth increases, the compressive stress decreases, crosses zero and becomes tensile; at greater depth the tensile stress decays toward zero. The plotted depth window extends to 0.32 mm, over which this transition is visible.
The mechanism is a competition between mechanical loading and thermal history. The grits exert normal and tangential forces that plastically compress the near-surface material. At the same time, frictional and plastic work generate heat, and the surface cools faster than the subsurface after the pass. Constraint from the surrounding material and elastic recovery then redistribute the stress. The result is a subsurface compression peak rather than a maximum exactly at the surface.
Increasing the depth of cut strengthens both sides of this loading. A larger \(a_p\) increases the contact area and the grinding force, so the mechanical compression of the surface layer grows. It also increases heat generation, which raises the thermal contribution. In the single-factor series at a wheel speed of 25 m/s and a feed of 4.5 m/min, the peak compressive magnitude increased from about 279 MPa at \(a_p=0.01\) mm to about 397 MPa at \(a_p=0.04\) mm, while the peak tensile stress rose from about 9.1 MPa to 32.0 MPa. The direction of the trend is clear, but the absolute values remain specific to this material model and contact geometry.
Orthogonal array and grey relational ranking
To rank the three grinding factors, a 16-run, three-factor, four-level orthogonal array was used. The factors were wheel speed \(v_s\), depth of cut \(a_p\) and workpiece feed \(v_w\), with the levels shown below.
| Factor | Level 1 | Level 2 | Level 3 | Level 4 |
|---|---|---|---|---|
| Grinding speed \(v_s\) (m/s) | 10 | 15 | 20 | 25 |
| Depth of cut \(a_p\) (mm) | 0.01 | 0.02 | 0.03 | 0.04 |
| Feed \(v_w\) (m/min) | 3.0 | 3.5 | 4.0 | 4.5 |
Across the 16 runs, the maximum compressive stress \(S_{1}\) ranged from −235.9 MPa to −363.6 MPa, and the maximum tensile stress \(S_{2}\) ranged from 9.1 MPa to 26.7 MPa. Grey relational analysis converts these two responses into a single grade. The compressive magnitude is treated as larger-is-better; the tensile magnitude is treated as smaller-is-better. Each response is normalised to a 0–1 range, a grey relational coefficient is calculated with a distinguishing coefficient of 0.5, and the two coefficients are averaged to give the grey relational grade \(G\).
The mean grade at each factor level is more informative than a single run because it averages over the other factors. The results show a clear ranking:
| Factor (levels in order) | Level 1 | Level 2 | Level 3 | Level 4 | Range | Rank |
|---|---|---|---|---|---|---|
| Grinding speed (10/15/20/25 m/s) | 0.5776 | 0.5890 | 0.6117 | 0.6248 | 0.0472 | 2 |
| Depth of cut (0.01/0.02/0.03/0.04 mm) | 0.6033 | 0.5764 | 0.5728 | 0.6504 | 0.0776 | 1 |
| Feed (3.0/3.5/4.0/4.5 m/min) | 0.5842 | 0.5920 | 0.6109 | 0.6159 | 0.0317 | 3 |
The range of the level means ranks depth of cut first, grinding speed second and feed third. The level-average grade is highest at 25 m/s, 0.04 mm and 4.5 m/min. This is a level-average result, not a single run in the orthogonal array. The highest individual grade in the 16-run array is 0.7155 at 25 m/s, 0.01 mm and 4.5 m/min, where the tensile stress is at its lowest, 9.1 MPa. The difference matters: increasing depth to 0.04 mm raises the compressive magnitude but also raises the tensile stress. The grade therefore represents a weighted compromise, not a Pareto-dominant process point.
The depth-of-cut level mean is also non-monotonic: it falls from 0.6033 at 0.01 mm to 0.5728 at 0.03 mm, then rises to 0.6504 at 0.04 mm. Such behaviour indicates interaction and nonlinearity, so linear interpolation between these levels would be unsafe.
Response-surface fit and confirmation runs
A second-order response-surface model was fitted to the 16 grey relational grades, with insignificant terms removed. The fit is strong within the sampled domain: the analysis of variance gives \(F=35.73\) and \(p<0.0001\), with \(R^{2}=95.97\%\) and adjusted \(R^{2}=93.29\%\). This means the model reproduces the grade values well, not that it predicts the underlying residual stresses independently of the finite-element runs.
Additional finite-element runs compared the level-average combination with neighbouring lower-speed, lower-depth and lower-feed cases. These are confirmation simulations, not physical grinding trials.
| Case | \(v_s\) (m/s) | \(a_p\) (mm) | \(v_w\) (m/min) | \(S_{1}\) (MPa) | \(S_{2}\) (MPa) |
|---|---|---|---|---|---|
| Level-average combination | 25 | 0.04 | 4.5 | −396.5 | 32.0 |
| Lower speed | 20 | 0.04 | 4.5 | −367.0 | 27.6 |
| Lower depth | 25 | 0.03 | 4.5 | −372.3 | 29.2 |
| Lower feed | 25 | 0.04 | 4.0 | −361.9 | 23.0 |
Relative to the neighbouring cases, the level-average combination raises the compressive magnitude by roughly 24–35 MPa. It also raises the tensile stress by roughly 3–9 MPa, reaching 32.0 MPa. The trade-off is explicit: the combination favours a strong compressive layer while accepting a larger tensile balancing stress.
What the ranking means for process control
Depth of cut dominates because it changes both the size of the loaded contact zone and the volume of material heated per pass. A larger depth increases the grinding force, the plastic strain and the heat input at the same time. Wheel speed has a secondary effect through strain rate, grit engagement frequency and heat partitioning. Feed changes the uncut thickness and the thermal exposure time per unit length; its level range is the smallest of the three.
For a gear whose fatigue life benefits mainly from subsurface compression, the high-speed, high-depth, high-feed region is attractive. For a crack-sensitive surface where tensile stress must remain low, the same data point in the other direction: lower depth or lower feed reduces the tensile peak, but also reduces the compressive benefit. A practical process window should therefore be selected from the compressive–tensile trade-off rather than from a single “optimal” grade.
The subsurface maximum has a measurement implication. Surface-only residual stress measurements can miss the peak compressive magnitude and can mislead a process comparison. Depth-resolved measurements, such as layer removal with X-ray diffraction or hole drilling, are needed to confirm the predicted profile.
Model scope and limitations
The analysis applies to AISI 4340 steel, rigid conical grits, a fixed friction coefficient of 0.3 and a local 2 mm × 1.5 mm × 0.5 mm tooth-surface segment. It does not resolve the full gear, wheel wear, grit fracture, actual wheel topography or the full cooling environment. The grit distribution is random but controlled by a virtual lattice, not measured from a specific wheel. The Johnson–Cook parameters and failure parameters are material-model inputs, and their high-temperature, high-strain-rate calibration affects the predicted stress magnitudes.
The confirmation cases are numerical, not experimental. Agreement among finite-element runs supports internal consistency and the response-surface fit, but it does not replace physical residual stress measurement. The identified optimum is valid within 10–25 m/s, 0.01–0.04 mm and 3.0–4.5 m/min; extrapolation to industrial grinding conditions requires experimental calibration.
Bottom line
Grinding of spiral bevel gears produces a compressive surface layer with a peak compressive magnitude below the surface, followed by a transition to tension and decay toward zero at greater depth. Within the tested window, depth of cut has the strongest influence on the grey relational grade, followed by grinding speed and feed. The level-average optimum is 25 m/s, 0.04 mm and 4.5 m/min, but it raises both compressive and tensile stress. The result is best treated as a process window for compressive benefit, with the tensile penalty made explicit, rather than as a universal set point for every gear application.