
I investigate the remaining useful life prediction problem for pinion gears because pinion gears often operate under severe loading, lubrication, and alignment conditions. In such environments, crack initiation and subsequent crack propagation can rapidly evolve into tooth breakage, which directly threatens the safety and reliability of the entire transmission system. When I consider the requirements of modern machinery, I find that a reliable life prediction method for pinion gears must combine measurable vibration information with a physically meaningful degradation law. A purely empirical model can fit historical data, but it may not describe the actual crack propagation process in pinion gears. A purely physical model can describe crack growth, but it often fails to use the abundant condition-monitoring data collected from operating pinion gears. Therefore, I develop a hybrid framework in which a crack propagation model and a data-driven health indicator are fused through an unscented Kalman filter.
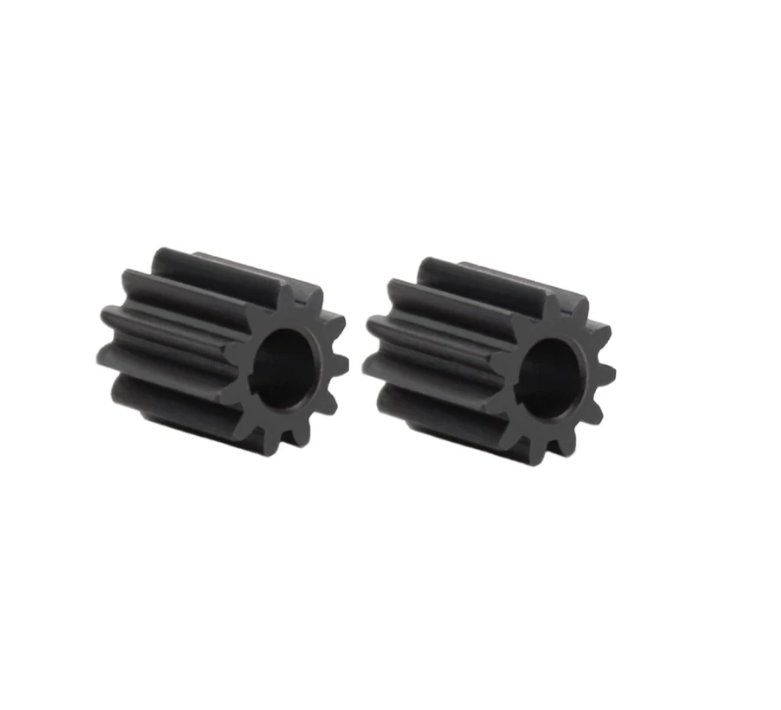
The key idea of my method is that the vibration signal of pinion gears contains rich information about tooth contact, root stress, and crack-induced impacts. However, the raw vibration signal also contains noise, harmonic components, modulation effects, and other interference. If I directly compute a conventional health index from the raw signal, the resulting index may not accurately represent the degradation state of pinion gears. To address this issue, I first apply empirical wavelet transform to the original vibration signal, then reconstruct the signal by selecting empirical modes according to kurtosis. This reconstruction enhances the impulsive components that are closely related to crack propagation in pinion gears. The kurtosis of the reconstructed signal is then used as the health indicator. Next, I establish a crack propagation degradation model for pinion gears by combining the Paris law with finite element analysis. Finally, I use an unscented Kalman filter to link the health indicator with the degradation model, update the model parameters recursively, and predict the remaining useful life of pinion gears.
I organize the remainder of this article as follows. I first present the health indicator construction method for pinion gears based on empirical wavelet transform. I then validate the proposed health indicator using both simulated signals and a public gear fatigue degradation dataset. After that, I derive the crack propagation degradation model for pinion gears using finite element analysis and the Paris law. I subsequently describe the unscented Kalman filter used to update the degradation model parameters. I then report the life prediction results and compare my method with several alternative approaches. Finally, I discuss the advantages, limitations, and practical implications of the proposed hybrid method for pinion gears.
1. Problem Formulation and Motivation
Pinion gears are critical components in many rotating machines. They transmit torque through repeated meshing cycles, and their teeth experience alternating bending stress, contact stress, sliding friction, and possible misalignment. When a crack appears at the tooth root of a pinion gear, the stress concentration at the crack tip drives further crack growth. As the crack extends, the effective load-carrying area decreases, the mesh stiffness changes, and the vibration response becomes more impulsive. If the crack reaches a critical size, the tooth may break, causing sudden failure. Therefore, predicting the remaining useful life of pinion gears is not only a signal-processing problem but also a mechanical degradation problem.
Existing life prediction methods can be broadly grouped into three categories: physical model methods, data-driven methods, and hybrid methods. Physical model methods rely on failure mechanisms and degradation laws. They can provide clear physical meaning, but they often require detailed material properties, accurate geometry, and precise loading conditions. For pinion gears, such information may be uncertain or time-varying. Data-driven methods use measured degradation data to construct health indicators and train prediction models. They can capture complex nonlinear behavior, but their physical interpretability is often limited. Hybrid methods combine physical models with data-driven updates and therefore have the potential to achieve both accuracy and interpretability. I adopt a hybrid strategy for pinion gears because the crack propagation process provides a physically meaningful backbone, while the vibration-based health indicator provides real-time information about the current degradation state.
I define the remaining useful life of pinion gears as the time from the current operating moment to the moment when the gear reaches a failure threshold. Let $$T$$ denote the remaining useful life, and let $$HI$$ denote the health indicator extracted from vibration data. I seek a mapping of the form
$$T = f(HI;\theta)$$
where $$\theta$$ is a parameter vector that must be updated as new health indicator observations become available. The mapping must reflect the crack propagation behavior of pinion gears, and the parameter vector must be updated recursively. The unscented Kalman filter is well suited for this task because the mapping between $$HI$$ and $$T$$ is nonlinear and the measurement noise is non-negligible.
Table 1 summarizes the main symbols I use throughout this article.
| Symbol | Meaning |
|---|---|
| $$f(t)$$ | Original vibration signal of pinion gears |
| $$F(\omega)$$ | Fourier transform of the vibration signal |
| $$\omega_i$$ | Frequency of a local maximum in the spectrum |
| $$A_i$$ | Amplitude of a local maximum in the spectrum |
| $$\epsilon$$ | Relative amplitude threshold |
| $$N$$ | Number of selected empirical modes |
| $$g_k(t)$$ | $$k$$-th empirical mode of pinion gear vibration |
| $$f_c(t)$$ | Reconstructed signal of pinion gears |
| $$HI$$ | Health indicator of pinion gears |
| $$a$$ | Crack length in a pinion gear tooth |
| $$a_c$$ | Critical crack length at failure |
| $$\Delta K$$ | Stress intensity factor range |
| $$C,n$$ | Material constants in the Paris law |
| $$K_I$$ | Mode I stress intensity factor |
| $$K_{II}$$ | Mode II stress intensity factor |
| $$Y$$ | Geometry correction factor |
| $$\sigma$$ | Stress at the crack front |
| $$T$$ | Remaining useful life of pinion gears |
| $$p_0,p_1,p_2$$ | Parameters of the degradation model |
| $$\nu_0,\nu_1,\nu_2$$ | Process noise terms for model parameters |
| $$\mu$$ | Measurement noise term |
I emphasize that the term pinion gears appears repeatedly here because the proposed method is intended for pinion gear degradation, where root cracks are common and vibration-based monitoring is practical. The same framework can be adapted to other geared rotors, but the finite element model and material constants must be adjusted for each specific pinion gear design.
2. Health Indicator Construction for Pinion Gears Using Empirical Wavelet Transform
I construct the health indicator for pinion gears in two stages. In the first stage, I decompose the original vibration signal using empirical wavelet transform. In the second stage, I select empirical modes according to kurtosis and reconstruct the signal. The kurtosis of the reconstructed signal is then used as the health indicator. The motivation is that kurtosis is sensitive to impulses, and crack propagation in pinion gears produces impulsive features in the vibration signal. However, raw-signal kurtosis may be dominated by other sources of impulsiveness, such as bearing defects, gear meshing harmonics, or random noise. Empirical wavelet transform allows me to isolate the frequency bands that contain the most degradation-related impulses.
2.1. Empirical Wavelet Transform of Pinion Gear Vibration
Let $$f(t)$$ be the original vibration signal measured from a pinion gear system. I compute its Fourier transform as
$$F(\omega)=\mathcal{F}\{f(t)\}$$
I then search for local maxima in the amplitude spectrum. Let $$\omega_i$$ be the frequency of the $$i$$-th local maximum and let $$A_i$$ be the corresponding amplitude. To avoid insignificant maxima, I apply a relative amplitude threshold. Let $$A_{\min}$$ and $$A_{\max}$$ be the minimum and maximum amplitudes among all local maxima. For a relative amplitude ratio $$\epsilon$$ in the interval $$[0,1]$$, I retain only the maxima that satisfy
$$A_i \ge A_{\min} + \epsilon (A_{\max}-A_{\min})$$
I denote the retained frequencies and amplitudes by $$m_j$$ and $$M_j$$, respectively, where $$j=1,\dots,N$$. The boundaries of the spectrum segments are then defined as the midpoints between consecutive retained frequencies:
$$\omega_n = \frac{m_j+m_{j+1}}{2}, \quad n=1,\dots,N-1$$
Using these boundaries, I construct a set of empirical wavelet functions $$\psi_n(\omega)$$ and empirical scaling functions $$\phi_n(\omega)$$. The detailed coefficients and approximation coefficients of the empirical wavelet transform are obtained by inner products. In the frequency domain, the corresponding operations can be written as
$$W_f^e(n,t)=\langle f(t),\psi_n(t)\rangle=\mathcal{F}^{-1}[F(\omega)\psi_n(\omega)]$$
$$W_f^e(0,t)=\langle f(t),\phi_1(t)\rangle=\mathcal{F}^{-1}[F(\omega)\phi_1(\omega)]$$
The empirical modes of the pinion gear vibration signal are then reconstructed as
$$g_0(t)=W_f^e(0,t)\phi_1(t)$$
$$g_k(t)=W_f^e(k,t)\psi_1(t), \quad k=1,\dots,N$$
At this point, I have decomposed the original pinion gear vibration signal into a set of empirical modes. Each mode corresponds to a narrow frequency band and may contain different amounts of degradation information.
2.2. Kurtosis-Based Mode Selection and Signal Reconstruction
I use kurtosis as the selection criterion because kurtosis measures the impulsiveness of a signal. For a discrete signal $$x$$ with mean $$\bar{x}$$ and standard deviation $$\sigma$$, the kurtosis is defined as
$$\text{kurtosis}(x)=\frac{\frac{1}{N}\sum_{i=1}^{N}(x_i-\bar{x})^4}{\left(\frac{1}{N}\sum_{i=1}^{N}(x_i-\bar{x})^2\right)^2}$$
A higher kurtosis value indicates that the signal contains more extreme peaks or impulses. Crack propagation in pinion gears generates impacts when the cracked tooth enters and leaves the meshing region. These impacts are often localized in certain frequency bands, especially around resonance frequencies. Therefore, I compute the kurtosis of each empirical mode as
$$K_k=\text{kurtosis}(g_k(t)), \quad k=1,\dots,N$$
I then sort the modes according to $$K_k$$. Let $$K_{\max}$$ and $$K_{\min}$$ be the maximum and minimum kurtosis values among the $$N$$ modes. I select the modes whose kurtosis lies in the upper range, for example, the highest half of the modes. The reconstructed signal is formed by summing the selected modes:
$$f_c(t)=\sum_{k\in \mathcal{S}} g_k(t)$$
where $$\mathcal{S}$$ is the set of selected mode indices. In my implementation, I typically retain the modes with the largest kurtosis values, because these modes contain the most pronounced impulsive components associated with crack growth in pinion gears. Finally, the health indicator is defined as the kurtosis of the reconstructed signal:
$$HI=\text{kurtosis}(f_c(t))$$
Table 2 presents the pseudocode of the health indicator construction procedure for pinion gears.
| Step | Operation |
|---|---|
| 1 | Input the original vibration signal $$f(t)$$ of pinion gears. |
| 2 | Compute $$F(\omega)=\mathcal{F}\{f(t)\}$$. |
| 3 | Find local maxima $$(\omega_i,A_i)$$ in the amplitude spectrum. |
| 4 | Retain maxima satisfying $$A_i \ge A_{\min}+\epsilon(A_{\max}-A_{\min})$$ to obtain $$(m_j,M_j)$$. |
| 5 | Set boundaries $$\omega_n=(m_j+m_{j+1})/2$$ for spectrum segmentation. |
| 6 | Construct empirical wavelet functions $$\psi_n(\omega)$$ and scaling functions $$\phi_n(\omega)$$. |
| 7 | Compute detailed coefficients $$W_f^e(n,t)$$ and approximation coefficients $$W_f^e(0,t)$$. |
| 8 | Obtain empirical modes $$g_k(t)$$. |
| 9 | Compute kurtosis $$K_k=\text{kurtosis}(g_k(t))$$ for each mode. |
| 10 | Select modes with high kurtosis and reconstruct $$f_c(t)$$. |
| 11 | Output $$HI=\text{kurtosis}(f_c(t))$$. |
I note that the selection of $$\epsilon$$ controls the number of retained maxima and therefore the number of empirical modes. A very small $$\epsilon$$ may produce too many modes, while a very large $$\epsilon$$ may merge important frequency bands. In my experiments on pinion gears, I choose $$\epsilon$$ by cross-validation on the health indicator smoothness and monotonicity. The same procedure is applied to all records.
2.3. Simulation Validation for Pinion Gear Degradation
To validate the proposed health indicator before applying it to real pinion gear data, I construct a simulated full-life vibration signal. The simulation contains periodic impulses, harmonic meshing components, amplitude modulation, and additive Gaussian noise. The impulse component is modeled as
$$x_{\text{imp}}(\xi,f_d,t)=\sum_{i=1}^{8}\sum_{j=1}^{2} A_{ij}\exp\left[-\frac{2\pi \xi_j}{\sqrt{1-\xi_j^2}}f_{dj}(t-\tau_i-iT_n)\right]\sin\left[2\pi f_{dj}(t-\tau_i-iT_n)\right]$$
The amplitude set for the harmonic component is
$$A_i=\{0.6,0.4,0.3,0.25,0.2,0.15,0.14,0.12,0.08\}$$
The harmonic meshing component is written as
$$x_s(t)=\sum_{m=1}^{9}A_m[1+\sin(2\pi f_n t)]\sin(2\pi m f_z t)$$
The full-life simulated signal for pinion gears is then generated as
$$x_i(t)=[1+0.2\beta(\lambda_i)]x_s(t)+\beta(\lambda_i)x_{\text{imp}}(t)+\eta(t), \quad i=1,\dots,200$$
$$x=[x_1,x_2,\dots,x_{200}]$$
I set the meshing frequency and shaft frequency to
$$f_z=258.3 \text{ Hz}, \quad f_n=8.3 \text{ Hz}$$
The sampling frequency is 12800 Hz, each record has a duration of 1 s, and one record is sampled every minute. The total signal length corresponds to 200 min. The impulse amplitudes and speed fluctuations are randomized to mimic real pinion gear operation. I assume that the vibration amplitude increases exponentially with crack growth. The simulation parameters are summarized in Table 3.
| Parameter | Value |
|---|---|
| Meshing frequency $$f_z$$ | 258.3 Hz |
| Shaft frequency $$f_n$$ | 8.3 Hz |
| Sampling frequency | 12800 Hz |
| Record duration | 1 s |
| Sampling interval | 1 min |
| Total duration | 200 min |
| First resonance frequency $$f_{d1}$$ | 1400 Hz |
| Second resonance frequency $$f_{d2}$$ | 1930 Hz |
| Damping ratio $$\xi_1$$ | 0.03 |
| Damping ratio $$\xi_2$$ | 0.01 |
| Noise level | −2 dB |
I compare the proposed health indicator with the raw-signal kurtosis. Since the simulated degradation follows an exponential trend, I fit both indicators using an exponential curve. The proposed indicator follows the exponential trend more closely than the raw-signal kurtosis. The correlation values are reported in Table 4.
| Indicator | Full-life correlation | Correlation after 150 min |
|---|---|---|
| EWT-reconstructed health indicator | 0.95 | 0.80 |
| Raw-signal kurtosis | 0.80 | 0.52 |
The comparison shows that the raw-signal kurtosis loses sensitivity in the later stage of pinion gear life. Its correlation with the exponential fit drops to 0.52 after 150 min. In contrast, the proposed health indicator maintains a correlation of 0.80 in the same period. This result is important because the later stage of pinion gear degradation is precisely when accurate remaining life prediction is most valuable. If the health indicator becomes insensitive near failure, the prediction model cannot update its parameters effectively.
I also examine the time-domain and frequency-domain characteristics of the reconstructed signal. The impulsive components become more visible after empirical wavelet reconstruction. In the frequency domain, the resonance bands associated with pinion gear crack impacts are clearer in the reconstructed signal than in the raw signal. This improvement is especially obvious after the pinion gear has been running for a long time. To quantify this effect, I define the signal-to-noise ratio of the degradation information as the energy of the impulsive component divided by the total signal energy. The reconstructed signal consistently has a higher ratio than the raw signal. As the pinion gear fault becomes more severe, the difference between the two ratios increases. This indicates that the reconstruction step extracts degradation-related impulses more effectively as the crack in the pinion gear grows.
2.4. Experimental Validation Using a Public Gear Fatigue Dataset
I further validate the proposed health indicator using a public gear fatigue degradation dataset. The dataset contains vibration records from a gear test rig operating until tooth failure. I apply the same empirical wavelet transform procedure to each record and compute both the proposed health indicator and the raw-signal kurtosis. The proposed indicator has lower variance and follows the degradation trend more smoothly. This behavior is consistent with the simulation results. The reason is that the empirical wavelet transform separates the signal into narrow frequency bands, and the kurtosis-based reconstruction retains the modes that contain crack-related impulses. As a result, the reconstructed signal is less affected by unrelated vibration components.
In my analysis, I find that the proposed health indicator for pinion gears provides a more stable representation of degradation than the raw-signal kurtosis. The raw kurtosis fluctuates strongly from record to record, especially in the early stage, because it is sensitive to random impacts and measurement noise. The proposed indicator reduces these fluctuations while preserving the increasing trend associated with crack growth. This property is essential for the unscented Kalman filter, because excessive measurement noise can cause unstable parameter updates.
3. Crack Propagation Degradation Model for Pinion Gears
After constructing the health indicator, I need a degradation model that relates the health indicator to the remaining useful life of pinion gears. Data-driven methods often use an exponential model of the form
$$HI = \alpha \exp(\beta t)$$
or a similar empirical expression. Although such models can fit degradation data, their parameters do not have clear physical meaning. For pinion gears, the dominant failure mode is often tooth root cracking followed by crack propagation. Therefore, I build the degradation model from the Paris law, which describes fatigue crack growth. This gives the model a physical basis and allows me to incorporate finite element analysis of the pinion gear tooth.
3.1. Paris Law for Crack Growth in Pinion Gears
The Paris law relates the crack growth rate to the stress intensity factor range:
$$\frac{da}{dt}=C(\Delta K)^n$$
where $$a$$ is the crack length, $$t$$ is time or load cycles, $$C$$ and $$n$$ are material constants, and $$\Delta K$$ is the range of the stress intensity factor. For pinion gears, the crack usually initiates at the tooth root and propagates through the tooth thickness. The stress intensity factor depends on the crack length, the applied stress, and the geometry of the tooth. For mode I crack opening, the stress intensity factor is
$$K_I=Y\sigma\sqrt{\pi a}$$
where $$Y$$ is a geometry correction factor and $$\sigma$$ is the stress at the crack front. The stress intensity factor range is
$$\Delta K=K_{\max}-K_{\min}$$
Substituting the mode I expression gives
$$\Delta K=K_{I,\max}-K_{I,\min}=Y\Delta\sigma\sqrt{\pi a}$$
I combine this expression with the Paris law to obtain
$$\frac{da}{dt}=C\left(Y\Delta\sigma\sqrt{\pi a}\right)^n$$
Separating variables and integrating from the current crack length $$a$$ to the critical crack length $$a_c$$, and from the current remaining life $$T$$ to the failure time $$t_c$$, I obtain
$$\int_{a}^{a_c}\frac{da}{C(Y\Delta\sigma\sqrt{\pi a})^n}=\int_{T}^{t_c}dt$$
This integral does not generally have a simple closed form for arbitrary $$n$$. However, for the purpose of online prediction, I approximate the relationship between remaining life and crack length by a power-law expression:
$$T=p_0+p_1 a^{p_2}$$
where $$p_0$$, $$p_1$$, and $$p_2$$ are parameters that absorb the material constants, geometry factors, loading conditions, and integration constants. This expression is physically motivated by the Paris law, but it is simple enough for recursive Bayesian updating. Since the crack length $$a$$ cannot be measured directly in an operating pinion gear, I replace it with the health indicator $$HI$$. Thus, the degradation model used for prediction becomes
$$T=p_0+p_1 (HI)^{p_2}$$
I note that $$HI$$ increases as the pinion gear degrades, while $$T$$ decreases. The parameters $$p_0$$, $$p_1$$, and $$p_2$$ are updated as new vibration data are collected.
3.2. Finite Element Analysis of Pinion Gear Crack Propagation
To determine the crack propagation mode and to estimate the initial parameters of the degradation model, I build a finite element model of a pinion gear. The gear parameters are listed in Table 5.
| Parameter | Value or description |
|---|---|
| Number of teeth | 31 |
| Module | 5 mm |
| Pressure angle | 20° |
| Material | 40Cr |
| Face width | 10 mm |
I first perform a static analysis. The gear bore is fixed, and a vertical load is applied to the tooth flank. The maximum principal stress occurs at the tooth root. This result indicates that the tooth root is the most likely location for initial crack formation in pinion gears. I therefore introduce an initial crack at the maximum stress location. I then apply a dynamic load to simulate the meshing condition of pinion gears. The extended finite element method is used to simulate crack propagation. I allow the crack to advance by up to 0.16 mm per step and perform 50 steps. The crack path follows the direction of maximum stress intensity, and the crack grows through the tooth root region.
I extract the stress intensity factors for mode I and mode II during crack propagation. The mode II stress intensity factor is much smaller than the mode I factor. On average, the mode II factor is only about 11.3% of the mode I factor. This means that the crack propagation in the pinion gear is dominated by mode I opening. Therefore, I neglect mode II in the degradation model to simplify the formulation. This simplification is reasonable for the pinion gear geometry and loading considered here, but it should be revisited for other gear designs or severe misalignment.
The finite element results also provide a relationship between crack length and the proposed health indicator. I find that the crack length and the health indicator have a Pearson correlation coefficient of 0.913. This strong correlation supports the use of the health indicator as a proxy for crack length in the degradation model. In other words, although I cannot measure the crack length directly in an operating pinion gear, the vibration-based health indicator carries sufficient information to infer the degradation state.
I compare the proposed crack propagation degradation model with an exponential model by fitting both to the health indicator data. The proposed model achieves a correlation of 0.77 with the health indicator, while the exponential model achieves only 0.47. This result shows that the crack propagation model better captures the degradation trend of pinion gears. The exponential model tends to overestimate or underestimate the degradation rate at different stages, whereas the crack propagation model follows the accelerated growth near failure more accurately.
4. Unscented Kalman Filter for Model Parameter Updating
The degradation of pinion gears is nonlinear, and the relationship between the health indicator and remaining life is also nonlinear. The unscented Kalman filter is suitable for this problem because it avoids the linearization errors of the extended Kalman filter. I use the unscented Kalman filter to update the parameters of the crack propagation degradation model as new health indicator observations arrive.
4.1. State-Space Formulation
I define the state vector as
$$x_k=\begin{bmatrix}p_0(k)\\p_1(k)\\p_2(k)\end{bmatrix}$$
The state evolution model is a random walk:
$$p_0(k+1)=p_0(k)+\nu_0(k)$$
$$p_1(k+1)=p_1(k)+\nu_1(k)$$
$$p_2(k+1)=p_2(k)+\nu_2(k)$$
where $$\nu_0$$, $$\nu_1$$, and $$\nu_2$$ are zero-mean Gaussian process noise terms. The measurement model relates the state to the observed remaining life:
$$T(k)=p_0(k)+p_1(k)(HI(k))^{p_2(k)}+\mu(k)$$
where $$\mu(k)$$ is zero-mean Gaussian measurement noise. In practice, the observed remaining life is not directly measured at each instant. Instead, I use the health indicator sequence and the failure threshold to define the target life. The unscented Kalman filter recursively estimates the posterior distribution of the parameters and predicts the remaining useful life of the pinion gear.
4.2. Unscented Transform and Filtering Steps
For a state vector of dimension $$L$$, I generate $$2L+1$$ sigma points. The sigma points at the previous step are
$$\mathcal{X}_{k-1}^{(0)}=\hat{x}_{k-1}$$
$$\mathcal{X}_{k-1}^{(i)}=\hat{x}_{k-1}+\sqrt{(L+\lambda)P_{k-1}}_i, \quad i=1,\dots,L$$
$$\mathcal{X}_{k-1}^{(i+L)}=\hat{x}_{k-1}-\sqrt{(L+\lambda)P_{k-1}}_i, \quad i=1,\dots,L$$
where $$\lambda=\alpha^2(L+\kappa)-L$$ is a scaling parameter, $$\alpha$$ controls the spread of the sigma points, and $$\kappa$$ is a secondary scaling parameter. The associated weights are
$$W_m^{(0)}=\frac{\lambda}{L+\lambda}$$
$$W_c^{(0)}=\frac{\lambda}{L+\lambda}+(1-\alpha^2+\beta)$$
$$W_m^{(i)}=W_c^{(i)}=\frac{1}{2(L+\lambda)}, \quad i=1,\dots,2L$$
The sigma points are propagated through the state transition model to obtain the predicted state mean and covariance:
$$\hat{x}_k^-=\sum_{i=0}^{2L}W_m^{(i)}\mathcal{X}_k^{(i)}$$
$$P_k^-=\sum_{i=0}^{2L}W_c^{(i)}(\mathcal{X}_k^{(i)}-\hat{x}_k^-)(\mathcal{X}_k^{(i)}-\hat{x}_k^-)^T+Q$$
where $$Q$$ is the process noise covariance matrix. The predicted sigma points are then passed through the measurement model to obtain the predicted measurement mean and covariance:
$$\hat{z}_k^-=\sum_{i=0}^{2L}W_m^{(i)}\mathcal{Z}_k^{(i)}$$
$$P_{zz}=\sum_{i=0}^{2L}W_c^{(i)}(\mathcal{Z}_k^{(i)}-\hat{z}_k^-)(\mathcal{Z}_k^{(i)}-\hat{z}_k^-)^T+R$$
The cross-covariance between the state and measurement is
$$P_{xz}=\sum_{i=0}^{2L}W_c^{(i)}(\mathcal{X}_k^{(i)}-\hat{x}_k^-)(\mathcal{Z}_k^{(i)}-\hat{z}_k^-)^T$$
The Kalman gain is
$$K_k=P_{xz}P_{zz}^{-1}$$
The state estimate and covariance are updated as
$$\hat{x}_k=\hat{x}_k^-+K_k(z_k-\hat{z}_k^-)$$
$$P_k=P_k^–K_kP_{zz}K_k^T$$
Through this recursive procedure, the parameters $$p_0$$, $$p_1$$, and $$p_2$$ of the crack propagation model are updated whenever a new health indicator value is obtained from the pinion gear vibration signal. The updated model is then used to predict the remaining useful life.
4.3. Initial Parameter Estimation
The initial parameters of the degradation model strongly affect the early prediction accuracy. I estimate these parameters by fitting the finite element crack propagation results to the proposed health indicator. Because the finite element analysis provides a physically meaningful relationship between crack length and degradation, the initial parameters are consistent with the pinion gear material and geometry. The initial values are listed in Table 6.
| Parameter | Initial value |
|---|---|
| $$p_0$$ | −16.25 |
| $$p_1$$ | 6794 |
| $$p_2$$ | −2.612 |
These initial values are used at the beginning of the prediction process. As new health indicator data are collected from the pinion gear, the unscented Kalman filter adjusts the parameters to match the actual degradation trajectory. This combination of physical initialization and data-driven updating is a central feature of my hybrid method.
5. Remaining Useful Life Prediction Results
I evaluate the proposed method using the gear fatigue degradation dataset. The dataset contains vibration measurements from a gear that runs until tooth failure. I apply the health indicator construction procedure, fit the crack propagation degradation model, and update the parameters using the unscented Kalman filter. I then compare the predicted remaining useful life with the true remaining useful life.
5.1. Failure Threshold and Health Indicator Normalization
To define the failure threshold, I normalize both the proposed health indicator and the raw-signal kurtosis. I observe that when the normalized kurtosis exceeds 0.4, the growth rate increases rapidly. This rapid increase indicates that the pinion gear has entered the unstable crack propagation stage. Because the unstable stage occupies only a small fraction of the total life and leads quickly to tooth breakage, I use 0.4 as the failure threshold. The same threshold is applied to both indicators to ensure a fair comparison.
5.2. Degradation Model Fitting with Unscented Kalman Filter
I first examine the degradation model curves obtained with the unscented Kalman filter. As more health indicator data are used, the predicted degradation curve fits the observed data more accurately. For example, when the first 50% of the data are used, the root mean square error between the predicted degradation curve and the health indicator is 73.79. When the first 70% of the data are used, the root mean square error decreases to 17.92. This improvement shows that the parameter updating procedure successfully adapts the degradation model to the actual condition of the pinion gear.
I also compare the unscented Kalman filter with the extended Kalman filter. When the extended Kalman filter is used, the degradation curve fits poorly near the end of life. With the first 70% of the data, the root mean square error is 27.87. The unscented Kalman filter achieves a lower error because it handles the nonlinear relationship between the health indicator and remaining life more accurately. The difference is especially evident near the failure threshold, where the degradation curve changes rapidly.
The root mean square error is calculated as
$$\text{RMSE}=\sqrt{\frac{1}{M}\sum_{i=1}^{M}(\hat{T}_i-T_i)^2}$$
where $$\hat{T}_i$$ is the predicted remaining useful life, $$T_i$$ is the true remaining useful life, and $$M$$ is the number of prediction points. I also use the Pearson correlation coefficient to quantify the agreement between the fitted curve and the health indicator:
$$r=\frac{\sum_{i=1}^{M}(x_i-\bar{x})(y_i-\bar{y})}{\sqrt{\sum_{i=1}^{M}(x_i-\bar{x})^2\sum_{i=1}^{M}(y_i-\bar{y})^2}}$$
5.3. Comparison with Alternative Methods
To demonstrate the effectiveness of the proposed method, I compare it with three alternative methods. The differences are summarized in Table 7.
| Method | Degradation model | Health indicator | Parameter updating |
|---|---|---|---|
| Proposed method | Crack propagation model | EWT-reconstructed indicator | Unscented Kalman filter |
| Method 1 | Exponential model | EWT-reconstructed indicator | Unscented Kalman filter |
| Method 2 | Crack propagation model | Raw-signal kurtosis | Unscented Kalman filter |
| Method 3 | Crack propagation model | EWT-reconstructed indicator | Extended Kalman filter |
As more health indicator data are collected, the proposed method produces life predictions that approach the true remaining life. In contrast, Method 1, which uses an exponential degradation model, shows larger deviations because the exponential model does not accurately describe the crack propagation trend in pinion gears. Method 2, which uses raw-signal kurtosis as the health indicator, performs poorly because the raw kurtosis does not reliably reflect the degradation state of the pinion gear. Method 3, which uses the extended Kalman filter, sometimes shows decreasing accuracy as more data are used, because the linearization in the extended Kalman filter introduces errors when the degradation curve becomes highly nonlinear.
The root mean square errors of the four methods are listed in Table 8.
| Method | RMSE |
|---|---|
| Proposed method | 24.7 |
| Method 1 | 135.1 |
| Method 2 | 172.7 |
| Method 3 | 44.7 |
The proposed method has the lowest root mean square error. Method 3 is better than Methods 1 and 2, which indicates that the parameter updating method also matters. However, the gap between Method 3 and the proposed method shows that the choice of degradation model and health indicator has a larger effect on prediction accuracy than the choice of filter. This is an important practical insight for pinion gears: improving the physical degradation model and the health indicator yields greater benefits than merely changing the filtering algorithm.
5.4. Prediction Accuracy over Time
I analyze how the prediction accuracy changes as the pinion gear approaches failure. In the early stage, the health indicator is relatively low and the crack length is small. The prediction uncertainty is therefore larger. As the crack propagates, the health indicator becomes more informative, and the unscented Kalman filter updates the model parameters more effectively. The prediction error decreases accordingly. This behavior is desirable because the most critical decisions are made near the end of life, when the remaining useful life is short. The proposed method provides its most accurate predictions in this final stage.
I also observe that the degradation curve predicted by the unscented Kalman filter remains stable even when the health indicator fluctuates. The process noise covariance and measurement noise covariance control the balance between model trust and data trust. If the measurement noise is set too high, the filter ignores new data and the prediction lags. If the measurement noise is set too low, the filter overreacts to noise and the prediction becomes unstable. In my experiments, I tune these covariances using the early portion of the data and keep them fixed for the remaining life prediction.
6. Discussion
The proposed method combines a physically motivated crack propagation model with a data-driven health indicator for pinion gears. This combination has several advantages. First, the empirical wavelet transform improves the quality of the health indicator by isolating the frequency bands that contain crack-related impulses. Second, the Paris-law-based degradation model provides a physically meaningful relationship between degradation and remaining life. Third, the unscented Kalman filter enables recursive parameter updating without linearizing the nonlinear degradation model. These three elements work together to improve the accuracy of remaining useful life prediction for pinion gears.
From a practical perspective, the method requires only vibration signals and basic gear parameters. The finite element analysis is performed offline to initialize the degradation model and to determine the dominant crack propagation mode. Once the initial parameters are obtained, the online computation is limited to empirical wavelet decomposition, kurtosis calculation, and unscented Kalman filtering. These operations are computationally efficient and suitable for real-time monitoring of pinion gears.
However, I also recognize several limitations. The current method assumes steady-state operating conditions. If the speed or load of the pinion gear changes significantly, the vibration signal characteristics may change, and the health indicator may be affected. Future work should extend the method to variable operating conditions by incorporating speed and load normalization. In addition, the finite element model is based on a specific pinion gear geometry and material. For different pinion gears, the model parameters must be recalibrated. The method also assumes that the dominant failure mode is tooth root cracking. If other failure modes, such as pitting, scoring, or wear, dominate, the crack propagation model may not be appropriate. Finally, the health indicator is based on kurtosis, which is sensitive to impulsive events. In systems with multiple impulsive sources, additional signal separation may be needed to isolate the pinion gear degradation.
Despite these limitations, the results show that the hybrid method is effective for pinion gear life prediction. The proposed health indicator is more stable and more sensitive to degradation than raw-signal kurtosis. The crack propagation model fits the degradation trend better than an exponential model. The unscented Kalman filter updates the model parameters accurately and provides reliable remaining life estimates. I believe that this framework can be extended to other rotating components by selecting an appropriate physical degradation model and a suitable health indicator.
7. Conclusion
I have developed a hybrid method for remaining useful life prediction of pinion gears by fusing a crack propagation model with data-driven health indicator construction. The main conclusions are as follows.
First, I construct a health indicator for pinion gears using empirical wavelet transform and kurtosis-based mode selection. The reconstructed signal enhances the impulsive components associated with crack propagation. Compared with raw-signal kurtosis, the proposed health indicator more accurately reflects the degradation state of pinion gears, especially in the later stage of life.
Second, I establish a crack propagation degradation model for pinion gears by combining finite element analysis with the Paris law. The finite element results show that mode I cracking dominates the tooth root crack propagation process. The resulting degradation model has a clear physical basis and fits the health indicator data better than an empirical exponential model.
Third, I use an unscented Kalman filter to link the health indicator with the degradation model and to update the model parameters recursively. This approach avoids the linearization errors of the extended Kalman filter and improves the prediction accuracy near failure. The proposed method achieves a lower root mean square error than alternative methods that use an exponential model, raw-signal kurtosis, or the extended Kalman filter.
Overall, the proposed hybrid framework provides an accurate and physically interpretable approach for predicting the remaining useful life of pinion gears. It makes effective use of vibration data while respecting the crack propagation mechanics of pinion gears. In future work, I plan to extend the method to variable-speed and variable-load conditions, incorporate additional failure modes, and validate the approach on a wider range of pinion gear designs.
| Contribution | Key element | Benefit for pinion gears |
|---|---|---|
| Health indicator construction | Empirical wavelet transform plus kurtosis-based reconstruction | Enhances crack-related impulses and reduces noise influence |
| Degradation modeling | Paris law plus finite element analysis | Provides physical meaning and better fits crack growth |
| Parameter updating | Unscented Kalman filter | Handles nonlinearity and recursively updates model parameters |
| Life prediction | Hybrid crack propagation and data-driven fusion | Improves remaining useful life accuracy for pinion gears |
I conclude that the fusion of crack propagation modeling and data-driven health indicator construction is a promising direction for pinion gear prognostics. The method is especially suitable for steady-state operation, where the vibration signal can be recorded continuously and the degradation process is dominated by fatigue crack growth. With further development, the same principles can support condition-based maintenance and safety assurance for pinion gears in demanding mechanical systems.