
The pursuit of higher performance in compact robotic actuators, particularly for legged platforms, has placed significant emphasis on the joint module’s core component: the speed reducer. Among various options, the cycloidal drive, also known as a cycloidal speed reducer, stands out due to its exceptional torque density, high shock load capacity, compact structure, and high single-stage reduction ratio. These attributes make it an ideal choice for applications where space and weight are at a premium, yet high output torque and reliability are demanded. A critical performance metric for such drives, especially in battery-powered mobile robots, is its transmission efficiency. Higher efficiency translates directly into longer operational times, reduced heat generation, and improved dynamic response. Therefore, a comprehensive understanding of the factors influencing the efficiency of a cycloidal drive and methodologies for its enhancement is of paramount importance for advanced mechanical design.
This article presents a detailed analysis of the transmission efficiency of a cycloidal drive. It begins by establishing a multi-tooth load-bearing contact model that crucially incorporates the effects of friction and manufacturing-generated backlash. Subsequently, a holistic power loss model is developed, accounting for all major sources of dissipation. This model is then employed to systematically investigate the influence of both design and operational parameters on overall efficiency. Finally, a multi-objective optimization framework is proposed and demonstrated to identify parameter sets that optimally balance high efficiency with a compact design.
1. Mechanical Model and Force Distribution in a Cycloidal Drive
Traditional force analyses of cycloidal drives often neglect friction during the initial load distribution calculation, introducing it only during efficiency computations. This simplification can lead to inaccuracies in determining the actual number of contacting tooth pairs and the force on each, which in turn affects the accuracy of the efficiency model. Therefore, our analysis integrates friction from the foundational force equilibrium stage.
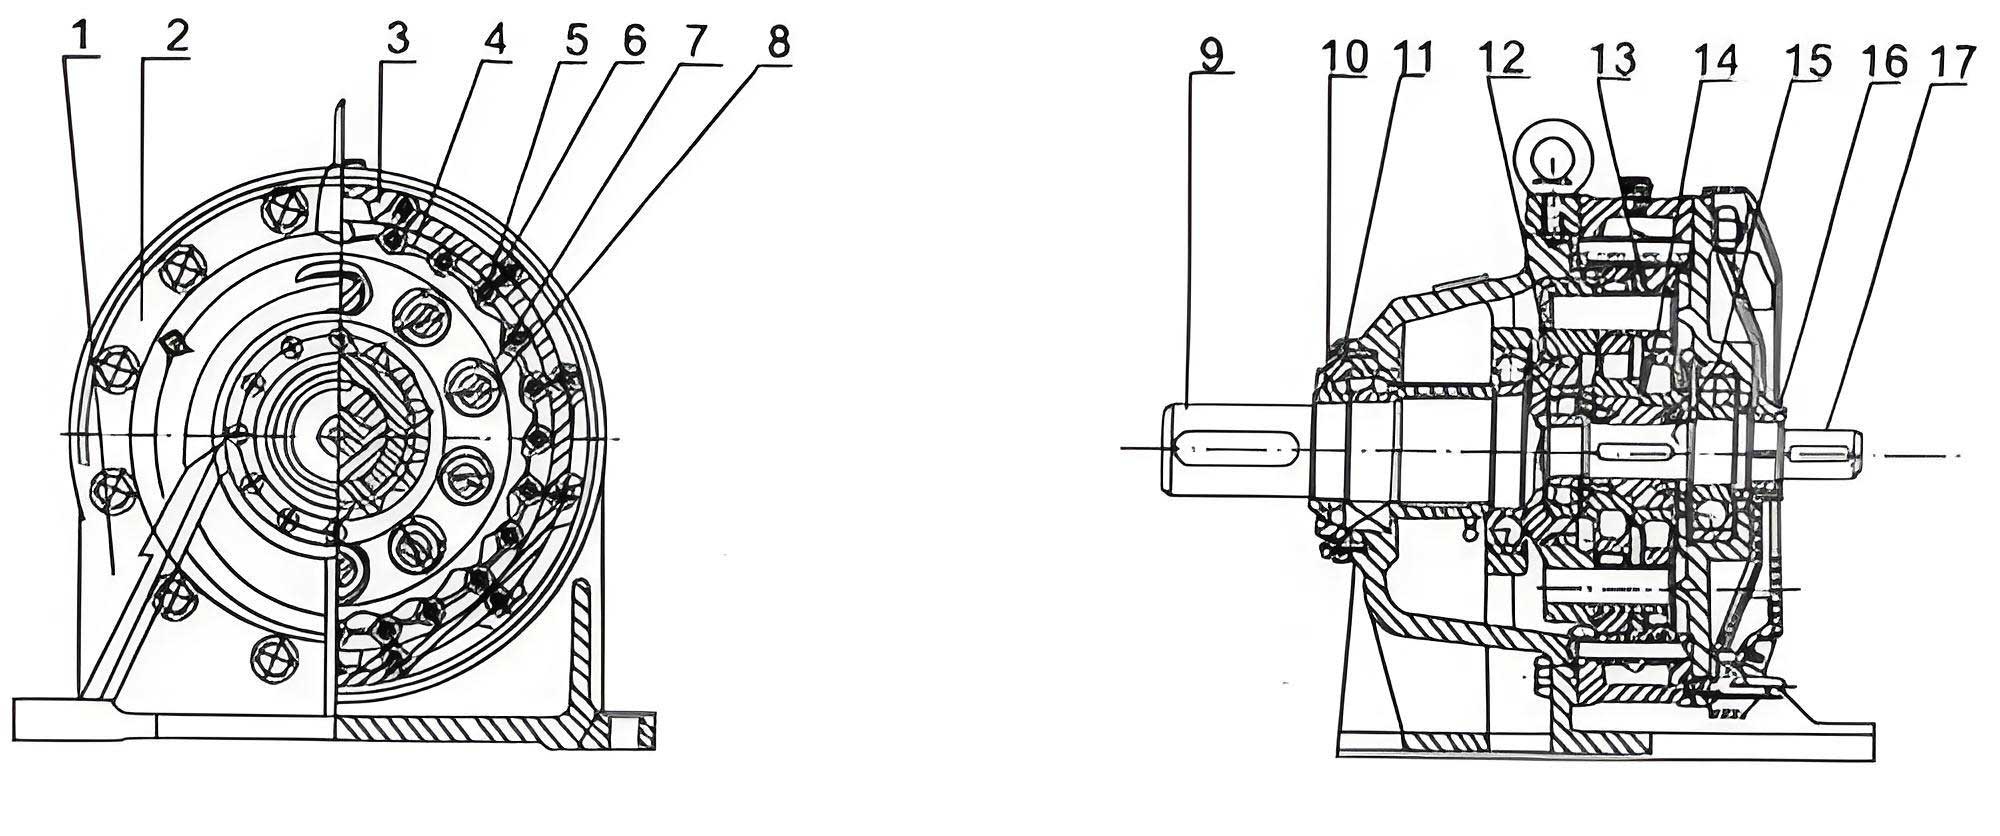
The kinematic principle of a cycloidal drive involves an input eccentric cam that causes a cycloid disk to undergo a compound epicyclic motion relative to a stationary ring of needle rollers (pin teeth). For force analysis, the method of inverted mechanism is commonly used, where the carrier (eccentricity) is considered fixed, transforming the mechanism into an equivalent gear train. The geometry of the meshing between the cycloid disk and a needle roller (pin tooth) is shown in Figure 1. The key parameters are: eccentricity $e$, pin tooth distribution circle radius $R_p$, pin tooth (roller) radius $r_{rt}$, pin pin radius $r_{rp}$, and number of cycloid disk lobes $Z_c$.
Under load, multiple lobes of the cycloid disk contact the needle rollers simultaneously. When a load torque $M_p$ is applied to the cycloid disk (considering it is one of a pair), contact deformations occur. The total deformation $\delta_i$ at the contact point of the $i$-th tooth pair along the common normal direction consists of Hertzian contact deformation and bending deflection of the pin pin. For a small rotation $\beta$ of the disk, this deformation is proportional to the distance from the meshing point’s normal to the instantaneous center of rotation.
$$ \delta_i = l_{ci} \beta $$
where $l_{ci}$ is the perpendicular distance from the cycloid disk’s center $O_c$ to the common normal line at the $i$-th contact point.
In an ideal, zero-backlash scenario, the force on each tooth pair would be proportional to this deformation: $F_i \propto l_{ci}\beta$. The maximum force $F_{max}$ occurs at the tooth pair where $l_{ci}$ is maximum, approximately equal to the pitch radius $r_c$. Thus:
$$ \frac{F_{max}}{F_i} = \frac{\beta r_c}{\beta l_{ci}} = \frac{r_c}{l_{ci}} \quad \text{or} \quad F_i = F_{max} \frac{l_{ci}}{r_c} = F_{max} \frac{l_{pi}}{r_p} $$
Here, $l_{pi}$ is the distance from the pin circle center $O_p$ to the common normal.
For practical manufacturing and lubrication, the cycloid profile is always modified (typically by a combination of equidistant and profile shift modifications), introducing initial clearance $\Delta \phi_i$ at each potential contact point. This clearance limits the number of simultaneously engaged tooth pairs to fewer than half the number of pin teeth. The force on the $i$-th engaged pair can then be expressed as:
$$ F_i = F_{max} \frac{\delta_i – \Delta \phi_i}{\delta_{max}} $$
where $\delta_{max}$ is the total deformation (contact + bending) at the tooth pair承受 the maximum load.
The total deformation is derived from Hertzian contact theory and beam bending theory:
$$ \delta_{max} = W_{max} + f_{max} = C_1 F_{max}[C_3 + \ln(C_2 F_{max})] + C_4 F_{max} $$
The coefficients are:
$$ C_1 = \frac{2(1-\mu^2)}{\pi E B}, \quad C_2 = \frac{\pi E B (\rho_c + r_{rp})}{2(1-\mu^2)}, \quad C_4 = \frac{31}{64} \cdot \frac{L^3}{48EJ} $$
where $E$ is Young’s modulus, $\mu$ is Poisson’s ratio, $B$ is the cycloid disk width, $\rho_c$ is the curvature radius of the cycloid profile at the point of maximum load, $L$ is the pin pin’s supported length, and $J$ is its area moment of inertia.
The force equilibrium equations for the cycloid disk must include friction forces at all contact interfaces: between the cycloid disk and needle rollers ($F_{fi}$), between the needle rollers and their pins ($F’_{pf}$), between the cycloid disk’s output holes and the output roller pins ($Q_{fj}$), and at the eccentric bearing ($F_{fr}$). Establishing equilibrium in terms of forces and moments yields a system of equations that, when solved iteratively with the deformation-force relationship, provides the precise load distribution $F_i$ among the engaged tooth pairs.
2. Comprehensive Efficiency Analysis Model
The overall transmission efficiency $\eta$ of the cycloidal drive is defined as the ratio of output power $P_{out}$ to input power $P_{in}$, which is equivalent to one minus the ratio of total power loss $P_{loss}$ to input power:
$$ \eta = \frac{P_{out}}{P_{in}} = 1 – \frac{P_{loss}}{P_{in}} $$
A complete model must account for all significant sources of power dissipation:
- Meshing Loss ($P_1$): Loss due to friction at the cycloid disk/needle roller interface.
- Output Mechanism Loss ($P_2$): Loss due to friction at the cycloid disk hole/output roller pin interface.
- Bearing Loss ($P_3$): Loss in all rolling-element bearings (eccentric bearings, output bearings).
- Sealing Loss ($P_4$): Loss due to friction of shaft seals (significant at higher speeds).
- Churning/Lubrication Loss ($P_5$): Loss due to viscous drag of lubricant on rotating components (significant at higher speeds).
Thus, $P_{total\ loss} = P_1 + P_2 + P_3 + P_4 + P_5$.
2.1 Meshing Loss ($P_1$)
This loss occurs at the primary power transmission interface. It has two components: rolling friction between the cycloid disk lobe and the needle roller ($P_{1g}$), and sliding friction between the needle roller and its stationary pin ($P_{1h}$).
The relative velocity at the contact point $M$ is $v_i = \omega_c r_i$, where $\omega_c$ is the cycloid disk’s rotational speed and $r_i$ is the distance from the contact point to the pitch point $P$. The rolling friction force is $F_{tf} = \mu_1 F_i$, where $\mu_1$ is the rolling friction coefficient. The sliding friction inside the needle roller assembly is $F’_{pf} = \mu_2 F’_N \approx \mu_2 F_i$. The corresponding power losses for $N$ cycloid disks are:
$$ P_{1g} = N \mu_1 \sum_{i=m}^{n} F_i r_i \omega_c $$
$$ P_{1h} = N \mu_2 \sum_{i=m}^{n} F_i v’_i \quad \text{where} \quad v’_i = v_i \frac{r_{rp}}{r_{rt}} $$
Total meshing loss: $P_1 = P_{1g} + P_{1h}$.
2.2 Output Mechanism Loss ($P_2$)
Similar to the meshing loss, this loss originates from the interface between the cycloid disk’s output holes and the output roller pins (which are fixed to the output flange). It also consists of rolling ($P_{2g}$) and sliding ($P_{2h}$) components.
$$ P_{2g} = \mu_3 \sum_{j=p}^{q} Q_j R_w \omega_{cwt} $$
$$ P_{2h} = \mu_4 \sum_{j=p}^{q} Q_j v_{wj} $$
Total output loss: $P_2 = P_{2g} + P_{2h}$.
2.3 Bearing Loss ($P_3$)
Bearing power loss is calculated using established empirical formulas for friction torque. For standard ball/roller bearings, Palmgren’s formula is used:
$$ M_{bearing} = M_0 + M_1 $$
$$ M_0 = \begin{cases}
10^{-7} f_0 (\nu n_z)^{2/3} d_m^3, & \nu n_z \ge 2000 \\
160 \times 10^{-7} f_0 d_m^3, & \nu n_z < 2000
\end{cases} $$
$$ M_1 = f_1 F_r d_m $$
where $f_0, f_1$ are coefficients, $\nu$ is lubricant kinematic viscosity, $n_z$ is bearing speed, $d_m$ is mean diameter, and $F_r$ is radial load.
For the needle roller eccentric bearing, a modified formula is applied:
$$ M’_0 = 4.5 \times 10^{-7} \nu^{0.3} n_z^{0.6} d_m $$
$$ M’_1 = 0.12 F_r^{0.41} d_m $$
The total bearing loss is the sum of losses from all bearings ($N_1$ standard, $N_2$ needle roller), each multiplied by its angular speed $\omega_{zc}$:
$$ P_3 = 10^{-3} \left[ \sum_{k=1}^{N_1} (M_0^{(k)} + M_1^{(k)}) + \sum_{k=1}^{N_2} (M’_0^{(k)} + M’_1^{(k)}) \right] |\omega_{zc}| $$
2.4 Sealing and Lubrication Losses ($P_4$, $P_5$)
At higher operating speeds, these losses become significant and cannot be neglected. Seal (typically lip seal) loss is estimated as:
$$ P_4 = \frac{\pi d_0^2 F_0 n_y}{1910} $$
where $d_0$ is shaft diameter, $F_0$ is friction force per unit circumference, and $n_y$ is output speed.
Churning or lubrication loss arises from the viscous drag of the lubricant on the rotating cycloid disks. It has two parts: loss due to gear tooth surfaces ($P_{dp}$) and loss due to disk side faces ($P_{df}$).
$$ P_{dp} = 4 c_n \pi B \mu_v r_{c0}^2 (\omega_b – \omega_c)^2 $$
$$ P_{df} = c_m \pi \rho \nu^{0.5} r_{c0}^4 (\omega_b – \omega_c)^{2.5} $$
where $c_n, c_m$ are loss coefficients, $\mu_v$ is dynamic viscosity, $\nu$ is kinematic viscosity, $\rho$ is lubricant density, $r_{c0}$ is cycloid disk tip radius, and $\omega_b$ is the disk’s orbital speed. Total churning loss for two disks: $P_5 = 2(P_{dp} + P_{df})$.
3. Parametric Influence on Transmission Efficiency
Using the comprehensive efficiency model, the influence of various design and operational parameters can be systematically analyzed. The base parameters for a small cycloidal drive are used, varying one parameter at a time within its practical design range while holding others constant. The key findings are summarized below.
3.1 Influence of Operational Parameters
Input Speed ($n$): As speed increases from 1000 to 3000 rpm under constant load, overall efficiency decreases. This is primarily due to the increase in speed-dependent losses: bearing friction ($P_3$), seal friction ($P_4$), and lubricant churning ($P_5$), all of which have a positive correlation with rotational speed.
Load Torque ($M_p$): Under constant input speed, efficiency increases with increasing load torque, though the rate of increase diminishes. Higher load increases the meshing forces, but the frictional losses (which are load-dependent) do not increase linearly with useful output power. Essentially, the fixed losses (like some bearing and churning losses) become a smaller fraction of the total input power as useful output power rises, leading to higher efficiency.
3.2 Influence of Key Design Parameters
The impact of eight major design parameters on efficiency and its constituent losses was investigated. The results are synthesized in the table below, which ranks the parameters by their influence on overall transmission efficiency.
| Design Parameter | Typical Variation Range | Primary Effect on Losses | Impact on Overall Efficiency ($\eta$) | Relative Influence |
|---|---|---|---|---|
| Pin Pin Radius ($r_{rp}$) | 2 mm to 4 mm | Significant increase in meshing loss $P_1$. Minor decrease in bearing loss $P_3$. | Decrease by ~4.1% | High |
| Pin Distribution Radius ($R_p$) | 23 mm to 33 mm | Significant increase in meshing loss $P_1$. Minor decrease in bearing loss $P_3$. | Decrease by ~3.9% | High |
| Eccentricity ($e$) | 1.2 mm to 2.2 mm | Significant decrease in meshing loss $P_1$ and bearing loss $P_3$. Moderate increase in output loss $P_2$. | Increase by ~4.4% | High |
| Pin Roller Radius ($r_{rt}$) | 4 mm to 6 mm | Significant decrease in meshing loss $P_1$. | Increase by ~3.5% | High |
| Number of Pin Teeth ($Z_p$) | 10 to 15 | Moderate decrease in meshing loss $P_1$. Slight increase in output loss $P_2$. | Slight Increase (~1.5%) | Moderate |
| Output Pin Radius ($r_{wp}$) | 1.9 mm to 3.1 mm | Moderate increase in output mechanism loss $P_2$. | Decrease by ~1.3% | Moderate |
| Output Pin Distribution Radius ($R_w$) | 15 mm to 19 mm | Moderate decrease in output loss $P_2$ and bearing loss $P_3$. | Slight Increase (~0.7%) | Low |
| Cycloid Disk Width ($B$) | 3 mm to 6 mm | Minor decrease in meshing loss $P_1$ and bearing loss $P_3$. | Slight Increase (~0.5%) | Low |
Key Insights: The parameters that most strongly influence the meshing loss ($P_1$), which is typically the largest single loss component, have the highest impact on overall efficiency. These are $r_{rp}$, $R_p$, $e$, and $r_{rt}$. Increasing $e$ and $r_{rt}$ while decreasing $r_{rp}$ and $R_p$ generally favors higher efficiency, but these changes are constrained by other design requirements like strength, tooth profile integrity, and reduction ratio.
4. Multi-Objective Optimization of Design Parameters
To systematically find the best compromise between high efficiency and compact size, a multi-objective optimization problem is formulated. The goal is to minimize both power loss (maximize efficiency) and the overall volume of the cycloidal drive.
4.1 Design Variables and Constraints
Seven key design parameters are chosen as optimization variables: $x = [e, R_p, r_{rt}, r_{rp}, R_w, r_{wp}, B]^T$. They must satisfy multiple mechanical and geometric constraints derived from strength, contact stress, tooth undercutting avoidance, and assembly requirements. The main constraints are summarized below:
- Shortening Coefficient ($k_1$): Governs profile shape and load distribution.
$$ k_1 = \frac{e Z_p}{R_p}, \quad 0.42 \le k_1 \le 0.80 $$ - Pin Size Coefficient ($k_2$): Prevents interference between adjacent needle rollers.
$$ k_2 = \frac{R_p \sin(\pi / Z_p)}{r_{rt}}, \quad 1.5 \le k_2 \le 2.0 $$ - Undercutting Avoidance: Ensures a valid cycloid profile without sharp corners or undercut.
$$ \frac{r_{rp}}{R_p} < |a_{min}| $$
where $a_{min}$ is a function of $k_1$ and $Z_p$. - Tooth Width Ratio: For structural rigidity.
$$ 0.1 R_p \le B \le 0.2 R_p $$ - Strength Constraints: Bending stress on pins and contact stresses must be below material allowables: $\sigma_{max} \le [\sigma]$, $\sigma_H \le [\sigma_H]$.
4.2 Objective Functions
Two conflicting objectives are defined:
1. Minimize Power Loss (Maximize Efficiency):
$$ f_1(x) = g_1 = \frac{P_{loss}(x)}{P_{in}} = 1 – \eta(x) $$
2. Minimize Normalized Volume: The volume is approximated as the cylinder enclosing the pin gear.
$$ V(x) = \pi (R_p + r_{rt} + H_1)^2 (2B + H_2) $$
where $H_1$ and $H_2$ are constant housing wall and clearance thicknesses. The objective is to minimize the volume ratio relative to a baseline design $V_0$:
$$ f_2(x) = g_2 = \frac{V(x)}{V_0} $$
The optimization problem is thus: $\min \ [f_1(x), f_2(x)]^T$ subject to the constraint set $c_i(x) \le 0$.
4.3 Optimization Results and Discussion
The Non-dominated Sorting Genetic Algorithm II (NSGA-II) is employed to solve this problem. With a population size of 1000 over 200 generations, the algorithm produces a Pareto front—a set of optimal solutions where improving one objective necessarily worsens the other.
The Pareto front reveals the expected trade-off: achieving higher efficiency (lower $g_1$) generally requires a larger volume (higher $g_2$), and vice-versa. From the set of non-dominated solutions, a designer can select a point based on priority. For instance, one might choose a design that offers a significant efficiency gain with a minor volume increase.
An example optimized parameter set compared to the baseline is shown in the table below. The number of pin teeth $Z_p$ was fixed at 10 to maintain a specific reduction ratio.
| Parameter | Symbol | Baseline Value | Optimized Value | Remarks |
|---|---|---|---|---|
| Eccentricity | $e$ | 1.4 mm | 2.0 mm | Increased for higher efficiency. |
| Pin Distribution Radius | $R_p$ | 30.0 mm | 30.0 mm | Unchanged due to other constraints. |
| Pin Roller Radius | $r_{rt}$ | 5.0 mm | 5.6 mm | Increased for higher efficiency. |
| Pin Pin Radius | $r_{rp}$ | 3.0 mm | 2.0 mm | Decreased for higher efficiency. |
| Cycloid Disk Width | $B$ | 4.5 mm | 4.0 mm | Slightly decreased, aiding volume reduction. |
| Output Pin Dist. Radius | $R_w$ | 17.0 mm | 19.0 mm | Increased, slightly beneficial for efficiency. |
| Output Pin Radius | $r_{wp}$ | 2.6 mm | 1.9 mm | Decreased for volume reduction. |
| Calculated Efficiency $\eta$ | 82.75% | 87.90% | Improvement of +5.15% | |
| Normalized Volume $V/V_0$ | 1.0 (Baseline) | 0.956 | Volume reduction of 4.4% | |
The optimization successfully identifies a parameter set that simultaneously increases transmission efficiency by a substantial margin (5.15 percentage points) and reduces the overall volume by 4.4%. This demonstrates the effectiveness of the proposed model and optimization framework in guiding the design of high-performance, compact cycloidal drives. The selected point represents a favorable compromise, significantly boosting efficiency while achieving a more compact assembly.
5. Conclusion
This article has presented a thorough investigation into the transmission efficiency of the cycloidal drive. A multi-tooth contact mechanics model incorporating friction and backlash provides an accurate foundation for determining load distribution. Building upon this, a comprehensive efficiency model was developed that accounts for all major power loss sources: meshing, output mechanism friction, bearing friction, seal drag, and lubricant churning.
Parametric studies using this model clearly identify the key drivers of efficiency. Operational parameters show that efficiency decreases with speed but increases with load. Among design parameters, the pin pin radius ($r_{rp}$), pin distribution radius ($R_p$), eccentricity ($e$), and pin roller radius ($r_{rt}$) exert the strongest influence, primarily through their effect on meshing losses. Parameters related to the output mechanism and disk width have a more moderate effect.
Finally, by formulating a constrained multi-objective optimization problem with efficiency and volume as competing goals, a systematic design improvement methodology was demonstrated. The application of the NSGA-II algorithm yielded a Pareto-optimal set of designs, from which a specific solution was shown to achieve a significant simultaneous improvement in both efficiency (+5.15%) and compactness (-4.4% volume). This holistic approach—from detailed physical modeling to systematic optimization—provides a powerful tool for advancing the design of cycloidal drives towards ever-higher performance metrics required by next-generation robotic and precision mechanical systems.