
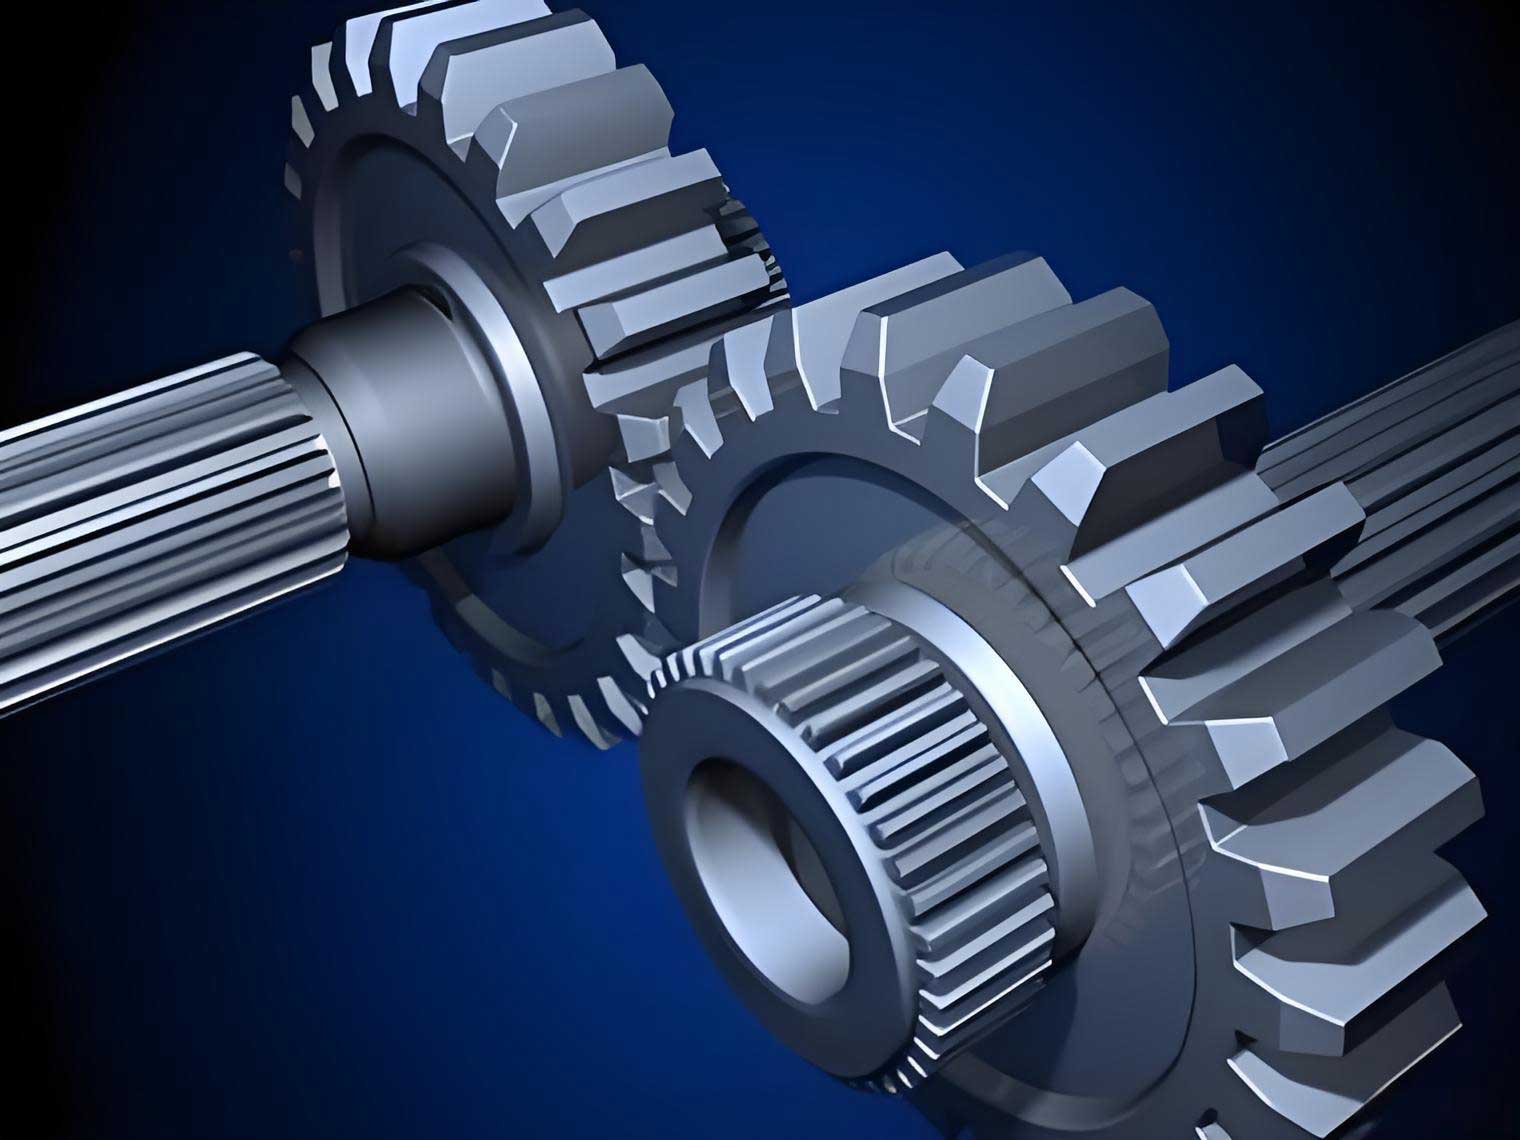
In mechanical engineering, gear transmission systems are pivotal due to their high precision and efficiency. Among these, spur gears are widely used for their simplicity and reliability. However, tooth surface wear remains a primary failure mode, altering tooth profile geometry and subsequently affecting contact conditions, dynamic characteristics, and service life. In this article, I explore the intricate relationship between tooth surface wear and contact load in spur gears, employing theoretical models and numerical simulations. The focus is on understanding how wear evolution modifies load distribution and stress patterns, which is crucial for enhancing the durability and performance of spur gears in practical applications. Throughout this discussion, the term “spur gears” will be frequently emphasized to underscore the specific gear type under investigation.
Wear in spur gears is a gradual process that results from repeated contact and sliding between meshing teeth. It fundamentally changes the involute profile, leading to variations in transmission error and load-sharing behavior. To analyze this, I adopt a modeling approach based on Hertzian contact theory and the Archard wear formula. These foundational theories allow for the quantification of wear depth and its impact on contact mechanics. By discretizing the tooth surface and simulating wear over multiple cycles, I can observe how wear patterns develop and influence the contact load distribution in spur gears. This investigation aims to provide insights that can inform design improvements and maintenance strategies for spur gear systems.
The core of the wear model lies in the Archard equation, which relates wear volume to sliding distance, contact load, and material properties. For spur gears, the wear depth at any point on the tooth profile can be expressed as:
$$h = \int_0^s kP ds$$
where \(h\) is the wear depth, \(s\) is the sliding distance, \(k\) is the wear coefficient (determined experimentally), and \(P\) is the contact stress. In discrete form, after \(n\) wear cycles, the wear depth is updated as:
$$h_n = h_{n-1} + kP_{n-1} s_{n-1}$$
This incremental approach accounts for changes in contact conditions due to wear. The wear direction is assumed normal to the tooth surface for both pinion and gear in spur gears. As wear accumulates, the curvature radii at contact points change, altering the Hertzian contact parameters and, consequently, the load distribution.
To compute the sliding distance \(s\) in spur gears, consider the relative motion between meshing teeth. At a given contact point, the sliding distances for the pinion and gear are:
$$s_p = \left| 2a \left(1 – \frac{V_{t2}}{V_{t1}}\right) \right|$$
$$s_g = \left| 2a \left(1 – \frac{V_{t1}}{V_{t2}}\right) \right|$$
Here, \(a\) is the Hertzian contact half-width, and \(V_{t1}\) and \(V_{t2}\) are the tangential velocities at the contact point for the pinion and gear, respectively, given by \(V_{t1} = R_1 \omega_1\) and \(V_{t2} = R_2 \omega_2\). \(R_1\) and \(R_2\) are the curvature radii, and \(\omega_1\) and \(\omega_2\) are the angular velocities. For spur gears, these velocities vary along the line of action, making sliding distance a function of mesh position.
Contact stress calculation is based on Hertz theory, where two spur gear teeth in contact are approximated as equivalent cylinders. The contact half-width \(a\) and maximum Hertz pressure \(P_{\text{max}}\) are:
$$a = \sqrt{\frac{4W R_e}{\pi E_e}}$$
$$P_{\text{max}} = \frac{2W}{\pi a}$$
where \(W\) is the load per unit width, \(R_e\) is the equivalent radius of curvature, and \(E_e\) is the equivalent elastic modulus. For spur gears, these are defined as:
$$\frac{1}{R_e} = \frac{1}{R_1} + \frac{1}{R_2}$$
$$\frac{1}{E_e} = \frac{1 – \nu_1^2}{E_1} + \frac{1 – \nu_2^2}{E_2}$$
with \(E_1, E_2\) as elastic moduli and \(\nu_1, \nu_2\) as Poisson’s ratios. The contact stress distribution across the width is elliptical:
$$P(x) = \frac{2W}{\pi a^2} \sqrt{a^2 – x^2}$$
where \(x\) is the distance from the contact center. For spur gears with a contact ratio between 1 and 2, load sharing between single and double tooth pairs must be considered. In double contact regions, the total load \(F_n\) is shared between two pairs, denoted \(F_{n1}\) and \(F_{n2}\). The load per unit width \(W\) for each pair is derived from tooth deflection and wear depth differences:
$$F_{n1} = \frac{F_n}{2} – \frac{C_T}{2} \left[ (h_p(y) + h_g(y)) – (h_p(y + P_b) + h_g(y + P_b)) \right]$$
$$F_{n2} = \frac{F_n}{2} + \frac{C_T}{2} \left[ (h_p(y) + h_g(y)) – (h_p(y + P_b) + h_g(y + P_b)) \right]$$
Here, \(C_T\) is the tooth deflection constant, \(h_p\) and \(h_g\) are wear depths on pinion and gear, \(P_b\) is the base pitch, and \(y\) is the distance along the line of action from the pitch point. This formulation highlights how wear in spur gears directly affects load partitioning.
To simulate wear, I discretize the tooth surface of spur gears into grids along the profile and width directions. Let the profile be divided into \(I\) segments and the width into \(J\) segments, creating grid points \(ij\). At each mesh cycle, contact stresses are computed for points within the contact zone, and wear depth is updated using the Archard formula. This numerical approach allows for tracking wear evolution over millions of cycles. The key parameters used in simulations are summarized in Table 1, which represents a typical spur gear pair.
| Parameter | Value |
|---|---|
| Gear Material | Alloy Steel (e.g., 20CrMnTi) |
| Elastic Modulus, \(E_1, E_2\) (GPa) | 206 |
| Poisson’s Ratio, \(\nu_1, \nu_2\) | 0.3 |
| Number of Teeth, Pinion \(z_1\) / Gear \(z_2\) | 28 / 56 |
| Module, \(m\) (mm) | 2.5 |
| Pressure Angle, \(\alpha\) (°) | 20 |
| Face Width, \(B\) (mm) | 30 |
| Addendum Coefficient, \(h_a^*\) | 1 |
| Dedendum Coefficient, \(c^*\) | 0.25 |
| Surface Roughness, \(R_a\) (μm) | 0.3 |
| Input Torque, \(T_p\) (Nm) | 120 |
| Input Speed, \(n\) (rpm) | 1500 |
| Center Distance, \(A\) (mm) | 105 |
| Tooth Deflection Constant, \(C_T\) (N/mm²) | 1 × 10⁴ |
| Wear Coefficient, \(k\) (mm²/N) | 5 × 10⁻¹⁶ |
Using these parameters, I performed numerical simulations for up to 30 million wear cycles. The wear depth distribution along the tooth profile of the pinion and gear in spur gears is shown in Table 2 and Table 3, respectively. These tables summarize wear depths at key points: root, pitch point, and tip, for different cycle counts.
| Location on Profile | Diameter (mm) | Wear Depth after 10M Cycles (μm) | Wear Depth after 20M Cycles (μm) | Wear Depth after 30M Cycles (μm) |
|---|---|---|---|---|
| Root (Point A) | 66 | 8.2 | 16.5 | 24.8 |
| Lower Double-Single Transition (Point B) | 68 | 4.1 | 8.3 | 12.5 |
| Pitch Point | 70 | 0.5 | 1.0 | 1.5 |
| Upper Single-Double Transition (Point C) | 72 | 3.8 | 7.7 | 11.6 |
| Tip (Point D) | 74 | 6.5 | 13.0 | 19.5 |
| Location on Profile | Diameter (mm) | Wear Depth after 10M Cycles (μm) | Wear Depth after 20M Cycles (μm) | Wear Depth after 30M Cycles (μm) |
|---|---|---|---|---|
| Tip (Point A) | 136 | 1.0 | 2.0 | 3.0 |
| Upper Double-Single Transition (Point B) | 138 | 0.6 | 1.2 | 1.8 |
| Pitch Point | 140 | 0.1 | 0.2 | 0.3 |
| Lower Single-Double Transition (Point C) | 142 | 0.5 | 1.0 | 1.5 |
| Root (Point D) | 144 | 0.8 | 1.6 | 2.4 |
The results indicate that wear depth in spur gears varies significantly along the profile. From root to tip, wear depth first decreases, reaches a minimum at the pitch point, and then increases. This trend is due to the sliding distance being highest near the root and tip, while nearly zero at the pitch point where pure rolling occurs. Notably, the pinion experiences greater wear than the gear because it undergoes more cycles per unit time. The transition points between single and double tooth contact show slight fluctuations in wear depth due to abrupt changes in contact stress. These findings align with prior studies on spur gears, confirming the reliability of the model.
To analyze the impact of wear on contact load, I computed the load per unit width along the pinion profile for different wear cycles. The load distribution is summarized in Table 4, highlighting key regions: double-tooth meshing zones near the root (A-B) and tip (C-D), and the single-tooth zone (B-C).
| Profile Region | Diameter Range (mm) | Load at 0 Cycles | Load after 10M Cycles | Load after 20M Cycles | Load after 30M Cycles |
|---|---|---|---|---|---|
| Double-tooth near root (A-B) | 66-68 | 60 | 55 | 58 | 62 |
| Single-tooth (B-C) | 68-72 | 120 | 122 | 125 | 128 |
| Double-tooth near tip (C-D) | 72-74 | 60 | 65 | 63 | 61 |
As wear progresses in spur gears, the load in double-tooth regions fluctuates. Specifically, in the root-side double-tooth zone (A-B), load initially decreases and then increases with wear depth. Conversely, in the tip-side double-tooth zone (C-D), load initially increases and then decreases. This behavior stems from the changing wear depths at corresponding contact points. When wear depth is higher at one point, the tooth becomes less stiff, carrying less load. Over cycles, the wear depths evolve, altering the stiffness balance. At the single-double transition points B and C, the load突变 reduces; for example, at point C after 30 million cycles, the load increases by approximately 71% compared to the unworn state, but the abrupt jump between single and double zones diminishes. This smoothing effect can influence noise and vibration in spur gears.
The maximum Hertzian contact stress also shows notable changes due to wear in spur gears. Table 5 presents the stress values at key points, illustrating how wear modifies the stress distribution.
| Point on Profile | Diameter (mm) | Stress at 0 Cycles | Stress after 10M Cycles | Stress after 20M Cycles | Stress after 30M Cycles |
|---|---|---|---|---|---|
| Root (A) | 66 | 750 | 720 | 735 | 745 |
| Transition (B) | 68 | 700 | 710 | 715 | 728 |
| Pitch Point | 70 | 650 | 655 | 660 | 665 |
| Transition (C) | 72 | 680 | 700 | 715 | 730 |
| Tip (D) | 74 | 600 | 620 | 615 | 610 |
The stress patterns reflect the load changes: in the root-side double-tooth zone, stress first decreases then increases, while in the tip-side zone, it first increases then decreases. The reduction in stress突变 at transitions can mitigate stress concentrations, potentially extending the fatigue life of spur gears. However, increased load fluctuations in double-tooth regions may accelerate wear or cause other dynamic issues.
To further understand the wear-load interaction in spur gears, I derived analytical expressions for key parameters. The equivalent radius of curvature \(R_e\) changes with wear because wear depths \(h_p\) and \(h_g\) alter the effective profile. For a pinion point with initial curvature radius \(R_1\), after wear, the radius becomes approximately \(R_1′ = R_1 – h_p \cos \phi\), where \(\phi\) is the pressure angle. Similarly, for the gear, \(R_2′ = R_2 + h_g \cos \phi\). Thus, the equivalent radius is:
$$R_e’ = \frac{R_1′ R_2′}{R_1′ + R_2′}$$
This affects the contact half-width \(a\) and maximum stress \(P_{\text{max}}\). Substituting into Hertz formulas, the load per unit width \(W\) in double-tooth regions can be expressed as a function of wear depths. Assuming linear tooth deflection, the load sharing equations become:
$$F_{n1} = \frac{F_n}{2} – \frac{C_T}{2} \Delta h$$
$$F_{n2} = \frac{F_n}{2} + \frac{C_T}{2} \Delta h$$
with \(\Delta h = (h_p(y) + h_g(y)) – (h_p(y+P_b) + h_g(y+P_b))\). This shows that load asymmetry in spur gears grows with wear depth difference \(\Delta h\). When \(\Delta h = 0\), loads are equal; otherwise, one pair carries more load. Over time, wear tends to equalize \(\Delta h\) due to higher wear at heavily loaded points, leading to the observed load fluctuations.
The sliding distance \(s\) also evolves with wear. Since \(a\) depends on \(R_e\) and \(W\), and \(V_t\) depends on \(R\), the sliding distance formulas become implicit functions of wear depth. For small wear, a Taylor expansion yields:
$$s_p \approx s_{p0} + \frac{\partial s_p}{\partial R_1} \Delta R_1 + \frac{\partial s_p}{\partial R_2} \Delta R_2$$
where \(\Delta R_1 = -h_p \cos \phi\) and \(\Delta R_2 = h_g \cos \phi\). This indicates that wear in spur gears modifies sliding distances, further influencing wear rates—a feedback effect that complicates long-term prediction.
In practice, the wear coefficient \(k\) for spur gears is not constant but may depend on lubrication, temperature, and surface conditions. To account for this, I considered a simplified model where \(k\) varies with contact pressure. For example, using a power-law relation \(k = k_0 P^m\), where \(k_0\) and \(m\) are constants. Incorporating this into the Archard integral gives:
$$h = k_0 \int_0^s P^{m+1} ds$$
This nonlinearity can lead to accelerated wear in high-stress regions of spur gears, such as near the root. However, for the simulations presented, a constant \(k\) was assumed, as typical for mild wear regimes.
The numerical method involves discretizing the spur gear tooth into \(I \times J\) grids. For each grid point \(ij\), at time step \(t\), the contact stress \(P_{ij}(t)\) is computed if the point lies in the contact zone. The wear increment is:
$$\Delta h_{ij} = k P_{ij}(t) s_{ij}(t) \Delta t$$
where \(\Delta t\) corresponds to one mesh cycle. The total wear depth is summed over cycles. This approach, while computationally intensive, captures the spatial and temporal evolution of wear in spur gears accurately. To optimize, I used a variable time step and parallel processing for large cycle counts.
Several factors influence wear in spur gears beyond the basic model. For instance, misalignment can cause uneven load distribution across the face width, leading to localized severe wear. Thermal effects from friction may alter material properties. Additionally, surface treatments like carburizing or coatings can reduce wear rates. Future work could integrate these aspects into the model for more comprehensive analysis of spur gears.
The implications of wear-induced load changes are significant for the design and maintenance of spur gears. For example, if wear causes load to shift toward the tip, bending stresses may increase, risking tooth fracture. Conversely, reduced load at the root might delay pitting but accelerate wear elsewhere. Designers of spur gears can use these insights to optimize profile modifications or select materials that minimize wear asymmetry. Predictive maintenance schedules can also be developed by monitoring load distribution changes through vibration or acoustic emissions.
In conclusion, this study demonstrates that tooth surface wear profoundly affects contact load in spur gears. Key findings include:
- Wear depth in spur gears varies along the profile, being highest at the root and tip, and lowest at the pitch point. The pinion experiences more wear than the gear.
- As wear depth increases, load fluctuations in double-tooth meshing regions become more pronounced, while the abrupt load changes at single-double transitions diminish.
- In the double-tooth zone near the root, contact load initially decreases and then increases with wear; near the tip, load initially increases and then decreases.
These results provide a theoretical foundation for understanding wear dynamics in spur gears and can guide efforts to enhance their longevity. By incorporating wear predictions into design algorithms, engineers can develop more robust spur gear systems that maintain performance over extended service periods. Further research should explore the coupling between wear, dynamics, and lubrication to fully capture the complex behavior of spur gears in real-world applications.