
Abstract
This paper focuses on the lubrication and temperature field analysis of herringbone gear, which are crucial components in aerospace and marine power transmission systems. Utilizing computational fluid dynamics (CFD) methods, the study investigates the lubrication performance and temperature distribution under various jet lubrication conditions, gear structures, and operating conditions. Tables and figures are employed to summarize and illustrate the key findings.
1. Introduction
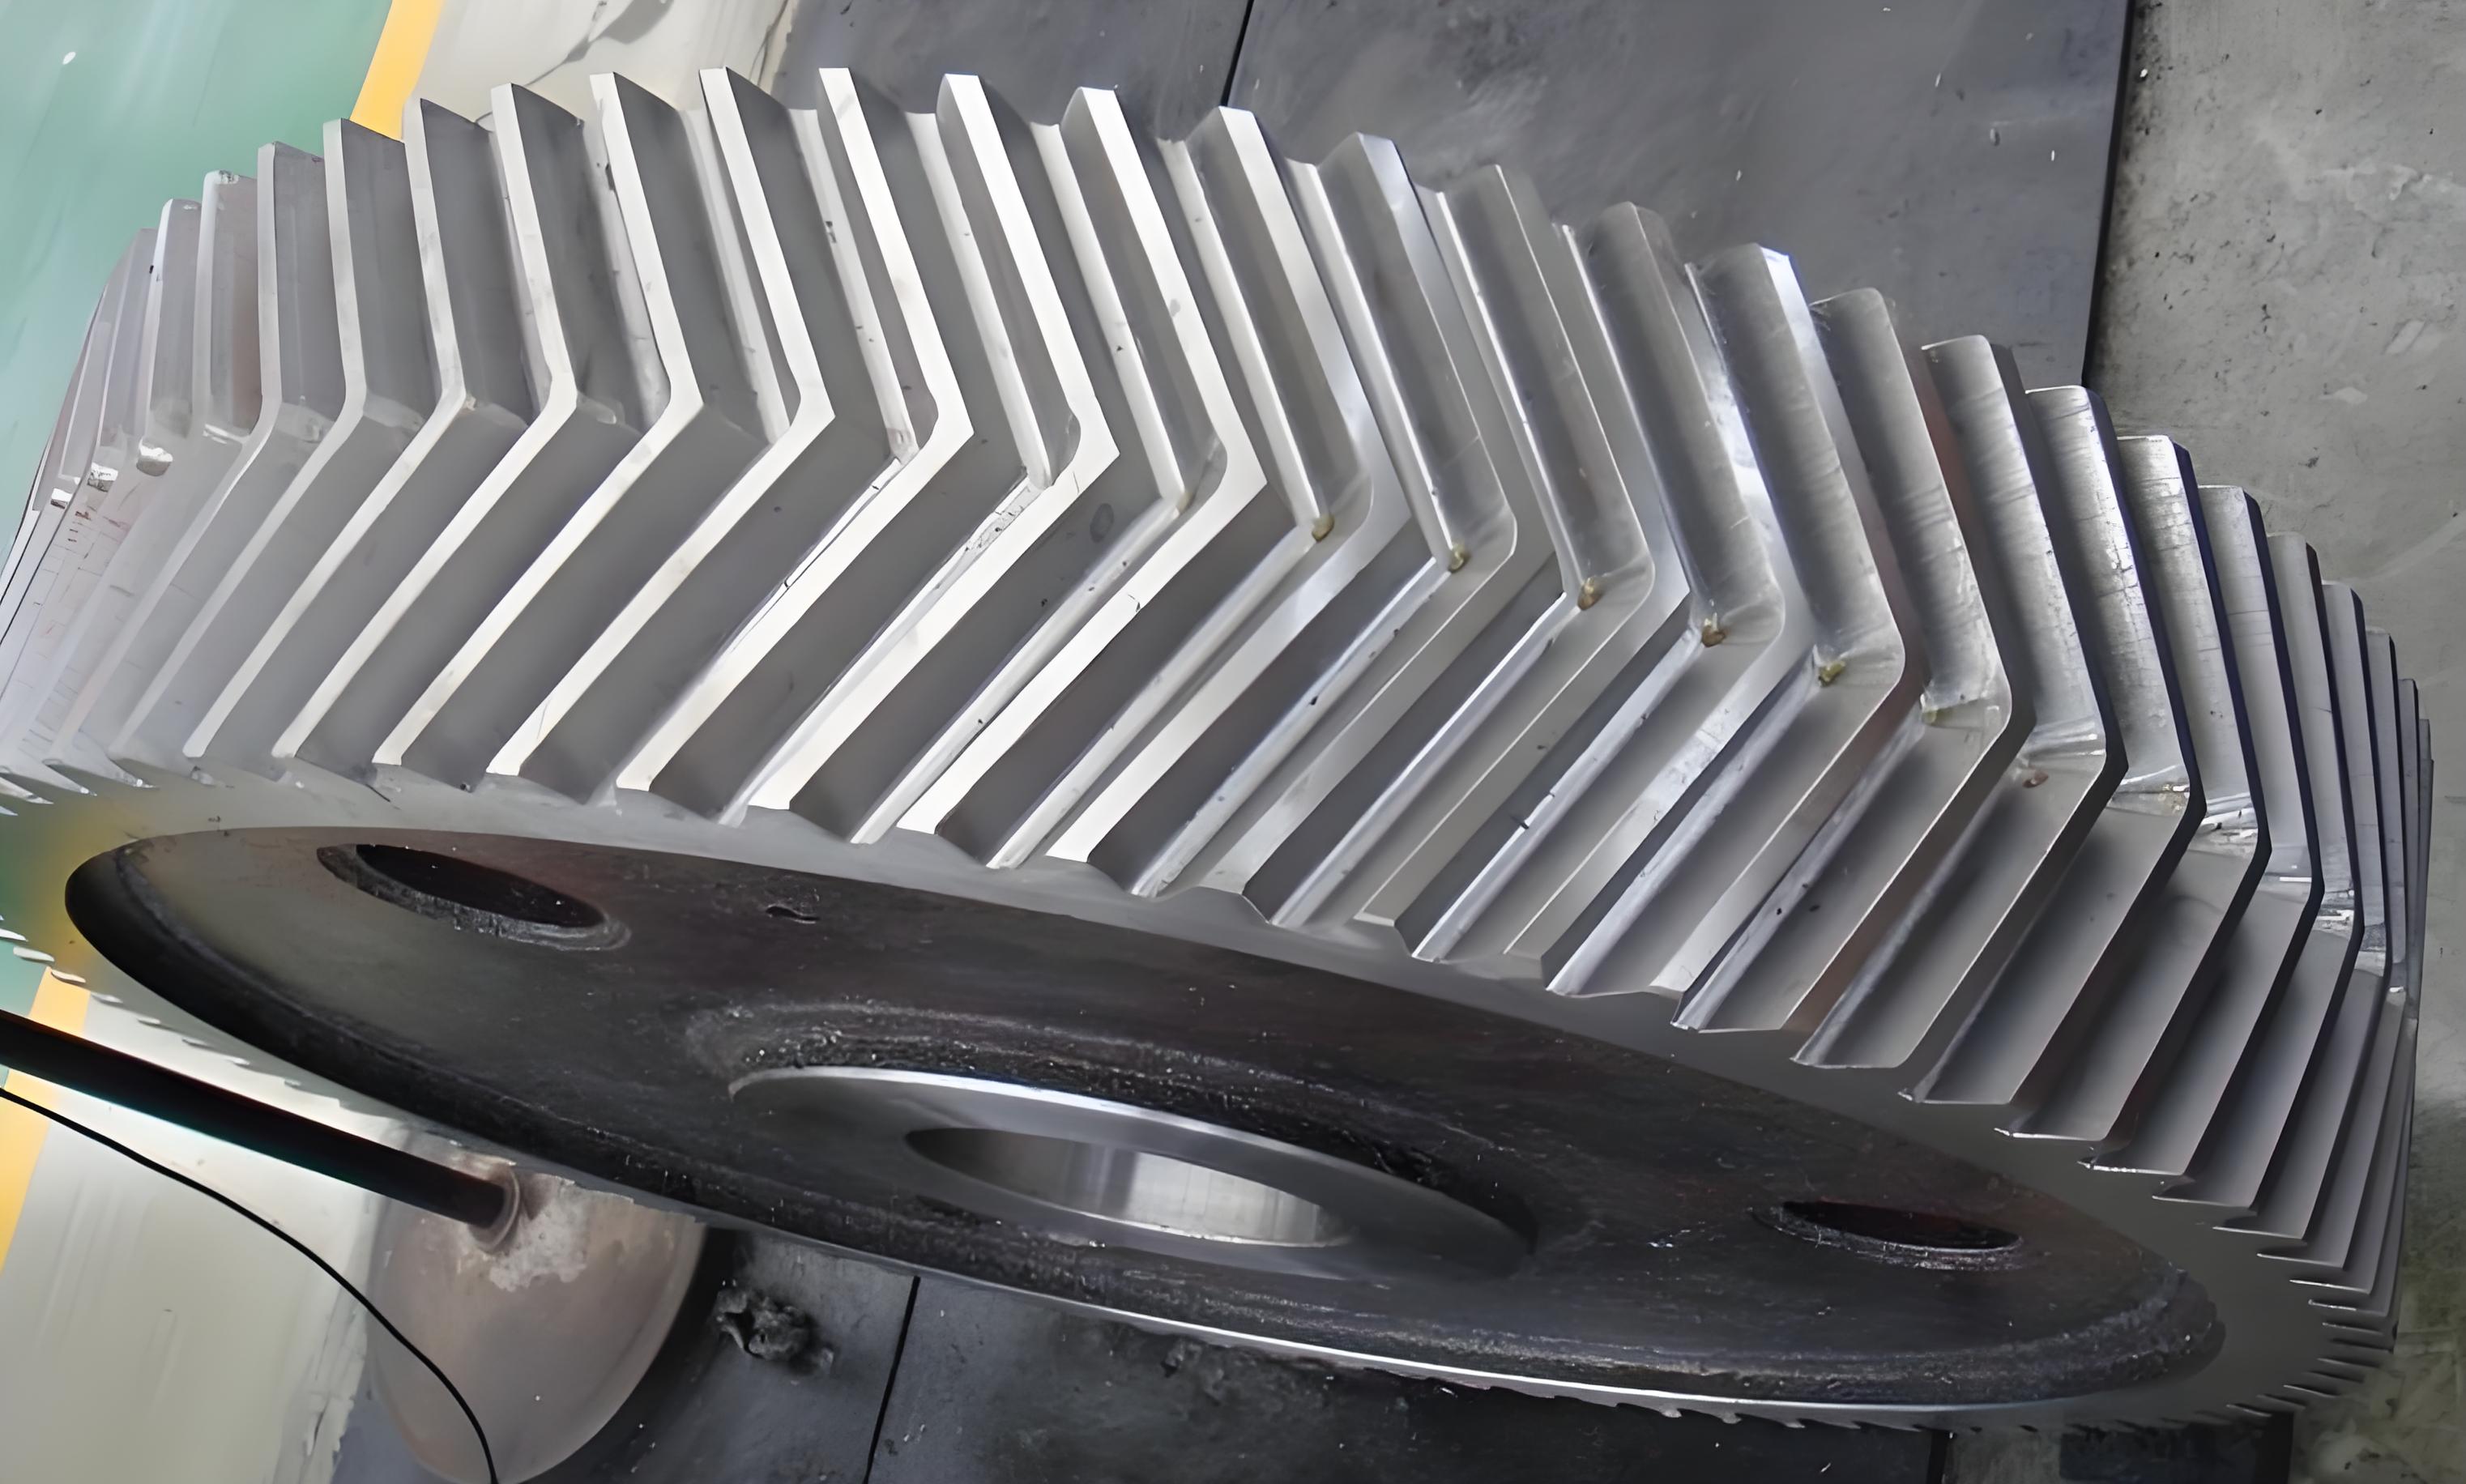
Herringbone gear is widely used in aerospace and marine applications due to their high contact ratio, strong carrying capacity, and stable transmission. However, their performance is affected by several factors related to thermal behavior, such as temperature, lubrication, and dynamic characteristics. This study aims to analyze the lubrication and temperature fields of herringbone gear under jet lubrication conditions.
2. Literature Review
Previous research on gear jet lubrication and temperature field analysis has achieved significant accomplishments, providing research ideas and calculation methods for this study. However, few studies have focused on herringbone gear, and there is limited analysis of their temperature field distribution under jet lubrication.
3. Methodology
3.1 Simulation Model
A three-dimensional model of herringbone gear jet lubrication was established using Solidworks, and simulations were conducted using Fluent software. The lubrication and cooling effects were evaluated based on post-processing results such as oil-air ratio, lubricant velocity streamlines, pressure contours, and isosurface plots.
3.2 Evaluation Criteria
- Lubrication Effect: Evaluated using pressure difference and oil-air ratio.
- Cooling Effect: Analyzed using convective heat transfer coefficients (CHTCs) averaged over different gear surfaces.
4. Simulation Analysis
4.1 Jet Lubrication Simulation
The simulation results provided insights into the lubrication and cooling performance of herringbone gear. Key parameters analyzed include jet velocity, jet diameter, gear spiral angle, tooth width, and driving gear tooth number.
Table 1: Summary of Simulation Parameters
| Parameter | Description | Range/Value |
|---|---|---|
| Jet Velocity | Speed of the lubricant jet | Varied |
| Jet Diameter | Diameter of the lubricant jet nozzle | Varied |
| Gear Spiral Angle | Angle of the helical teeth | Varied |
| Tooth Width | Width of the gear teeth | Varied |
| Driving Gear Tooth # | Number of teeth on the driving gear | Varied |
4.2 Lubrication Effect Analysis
The lubrication effect was analyzed by examining oil-air ratios, lubricant velocity streamlines, pressure contours, and isosurface plots.
Table 2: Lubrication Effect Evaluation
| Parameter | Evaluation Criteria |
|---|---|
| Oil-Air Ratio | Higher values indicate better lubrication |
| Pressure Difference | Larger differences indicate better lubrication |
4.3 Cooling Effect Analysis
The cooling effect was evaluated by averaging the CHTCs over different herringbone gear surfaces and comparing them.
Table 3: Cooling Effect Evaluation
| Gear Surface | Average CHTC (W/m²·K) |
|---|---|
| Driving Gear | Varied |
| Driven Gear | Varied |
5. Contact Analysis and Steady-State Temperature Field Simulation
5.1 Contact Analysis
Based on Hertz contact theory, MATLAB was used to calculate contact parameters such as curvature radius, velocity, contact line length, and contact pressure.
Table 4: Contact Parameters
| Parameter | Description |
|---|---|
| Curvature Radius | Radius of curvature at the contact point |
| Velocity | Velocity at the contact point |
| Contact Line Length | Length of the contact line |
| Contact Pressure | Pressure at the contact point |
5.2 Friction Heat Flux Calculation
The friction heat flux was calculated using the EHL model, providing the heat generation boundary condition for the temperature field simulation.
5.3 Steady-State Temperature Field Simulation
The steady-state temperature field was simulated using ANSYS Workbench, with the CHTCs from the fluid simulation as the heat dissipation boundary condition and the friction heat flux as the heat generation boundary condition.
Table 5: Temperature Field Simulation Parameters
| Parameter | Description |
|---|---|
| CHTC | Convective Heat Transfer Coefficient |
| Friction Heat Flux | Heat flux generated due to friction |
| Gear Material | Material properties (thermal conductivity, density, specific heat capacity) |
6. Experimental Verification
A temperature field test platform was built to measure and record the steady-state temperature of herringbone gear using thermocouples and paper recorders. The experimental results were compared with the simulation results to verify the feasibility of the simulation method.
Table 6: Experimental Results Comparison
| Parameter | Simulation Value | Experimental Value |
|---|---|---|
| Gear Temperature | Varied | Varied |
| Error Percentage | Calculated | Calculated |
7. Conclusion
This study investigated the lubrication and temperature field distribution of herringbone gear under jet lubrication conditions. Simulation and experimental results demonstrated the feasibility of the proposed method. Future work could include optimizing the jet lubrication parameters and exploring advanced materials for improved thermal performance.