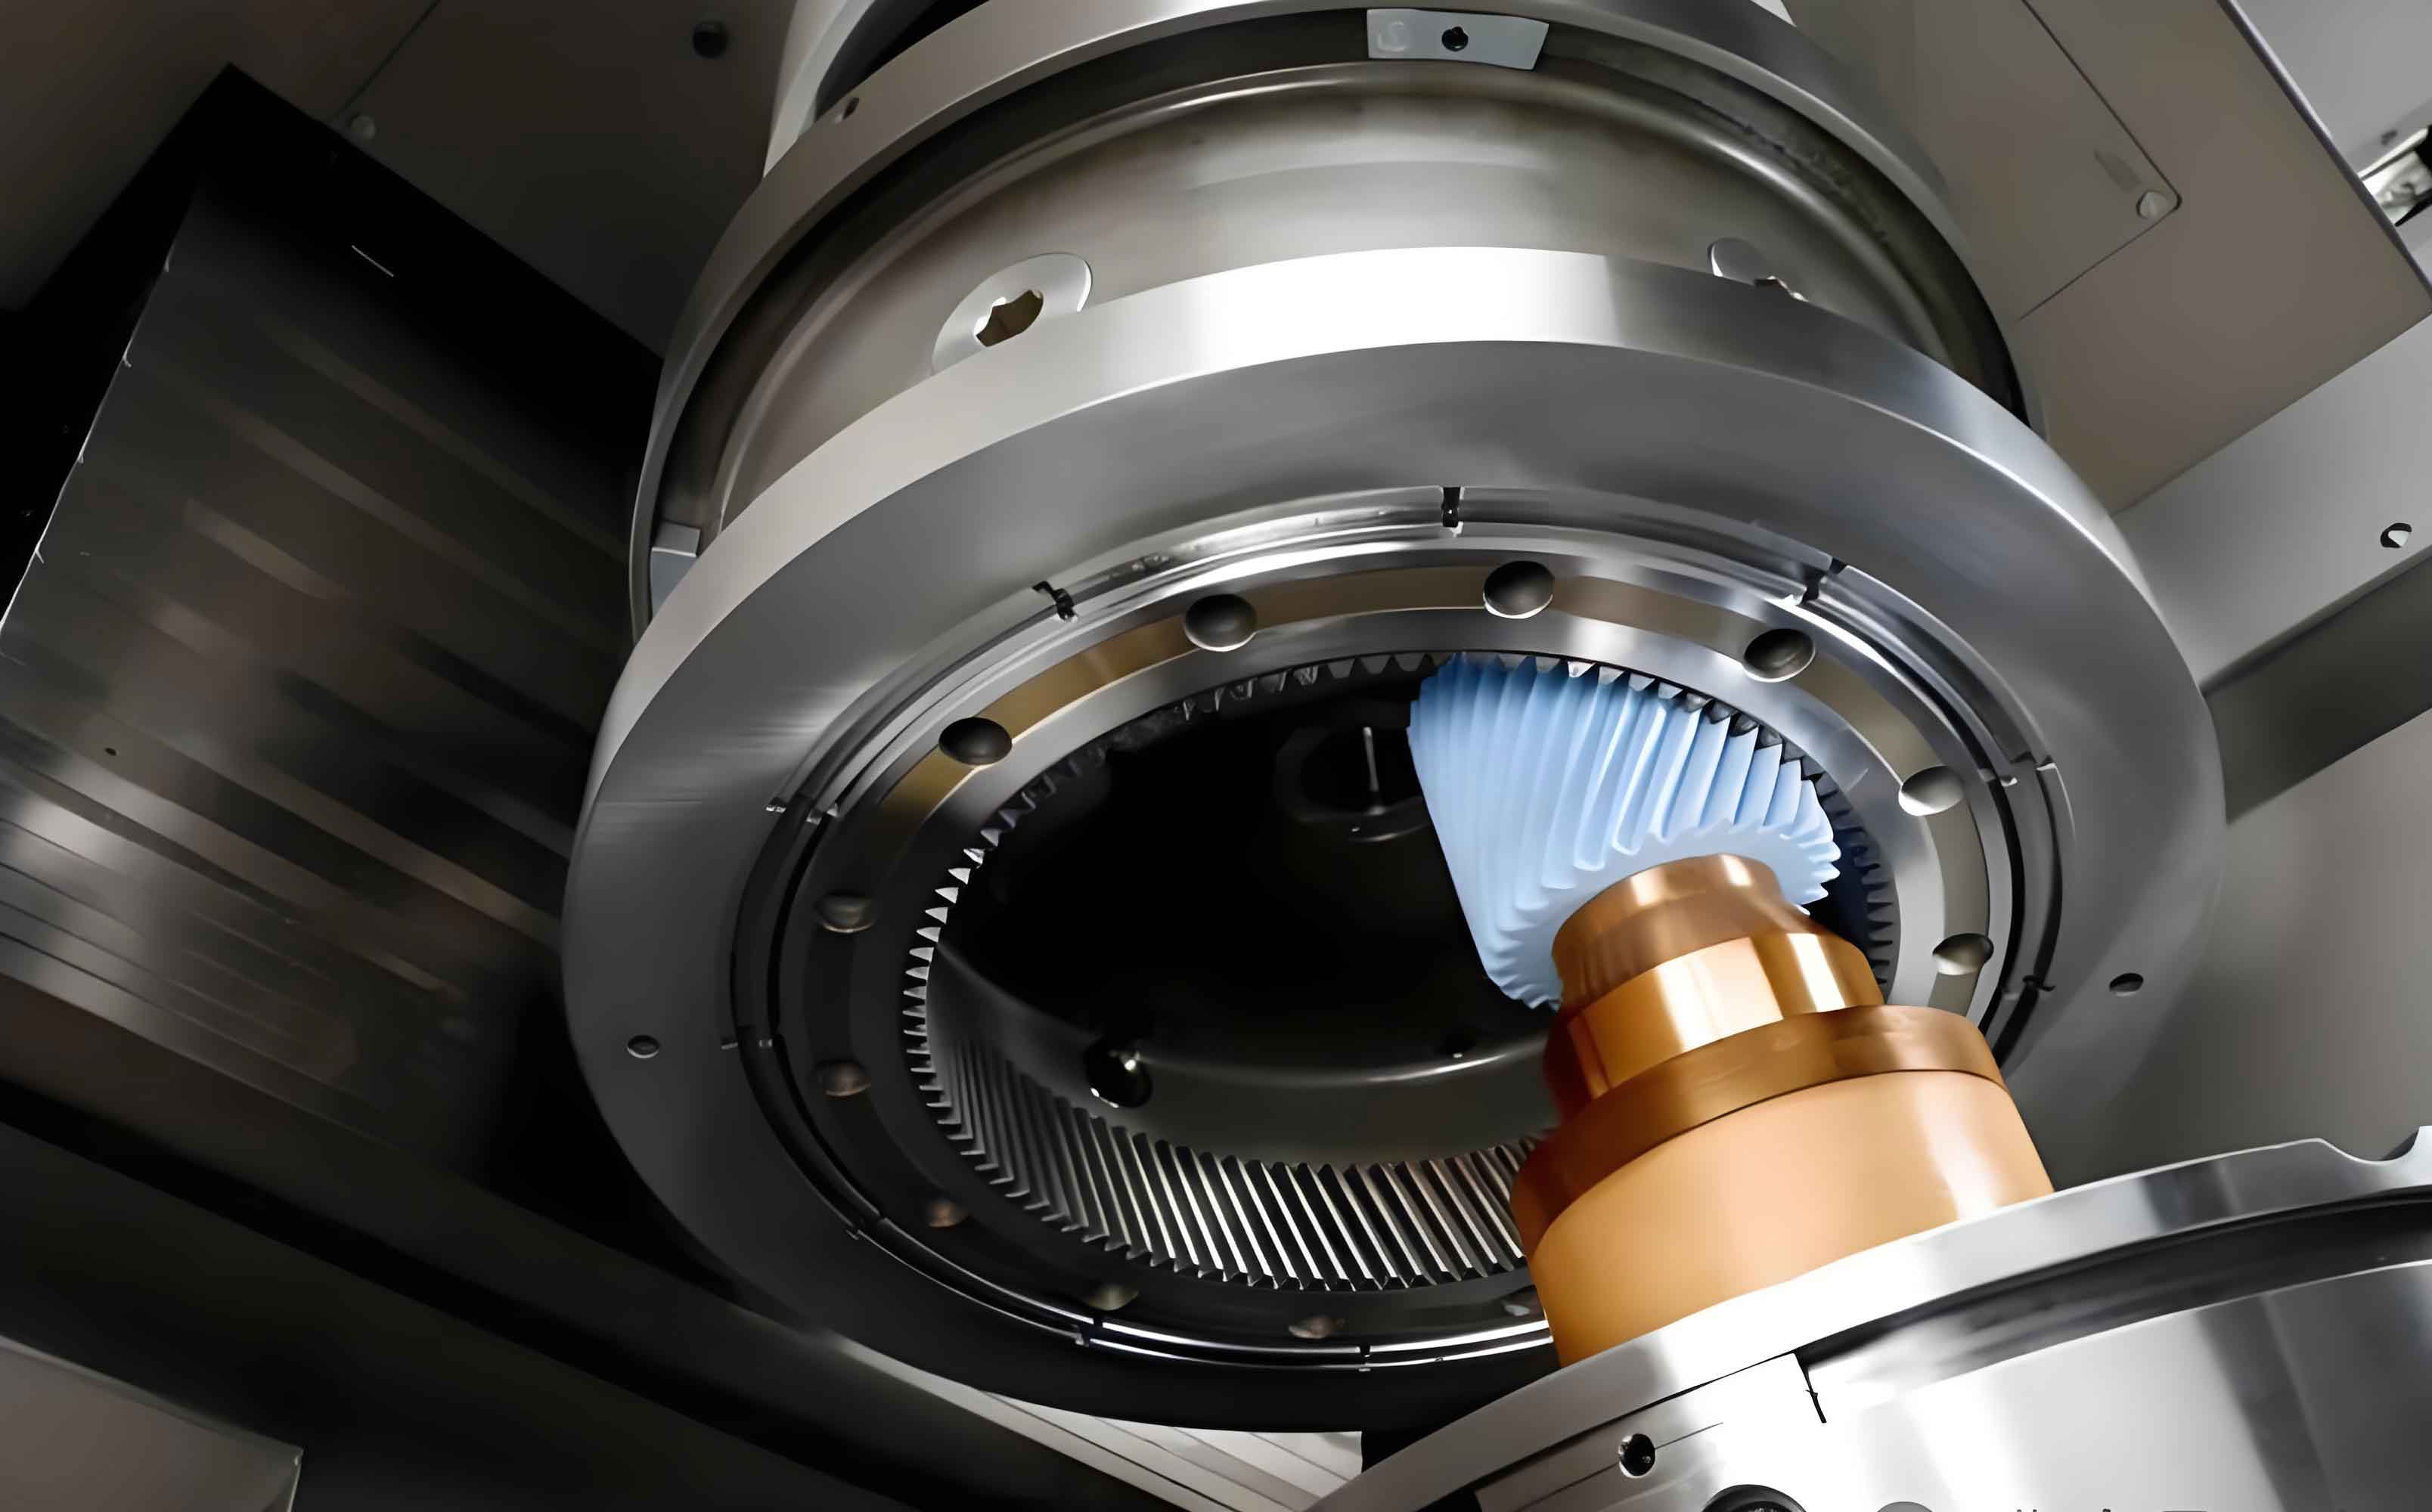
Gear transmission dominates industrial power transfer systems, with high-speed gears enabling low-noise, high-reliability operation in electric vehicles, aerospace, and marine applications. Internal gearing power honing—an efficient, high-performance finishing process—enhances gear reliability, suppresses noise, and extends service life. However, key technologies and equipment remain monopolized by foreign manufacturers, while domestic production relies on empirical methods lacking theoretical models. This study establishes a digital model for internal gearing power honing, analyzes surface integrity, and provides theoretical support for process optimization.
Kinematic and Material Removal Mechanism in Gear Honing
The relative motion between the honing wheel and workpiece gear is equivalent to an internal meshing gear pair with crossed axes. The coordinate systems are defined as follows:
- Workpiece-fixed coordinate system \(S_{wf} (O_{wf}-x_{wf}-y_{wf}-z_{wf})\)
- Honing wheel-fixed coordinate system \(S_{hf} (O_{hf}-x_{hf}-y_{hf}-z_{hf})\)
The meshing equation is derived as:
$$ U \cos \phi_w(t) – V \sin \phi_w(t) = W $$
where \(U\), \(V\), and \(W\) are functions of the axial angle \(\gamma\), transmission ratio \(i\), and position vectors. The relative velocity at contact point \(P\) is:
$$ \mathbf{v} = \begin{bmatrix}
(1 – \cos \gamma / i) y – z \cos \gamma \cdot \dot{\phi}_w \sin \gamma / i + d \dot{\phi}_w \sin \gamma / i \\
-(1 – \cos \gamma / i) x + z \cos \gamma \cdot \dot{\phi}_w \cos \gamma / i – d \dot{\phi}_w \cos \gamma / i \\
-(x \dot{\phi}_w + y \dot{\phi}_w) \sin \gamma / i
\end{bmatrix} $$
Material removal occurs via abrasive particles on the honing wheel surface. Abrasive shapes are modeled as spherical or conical (Figure 1). Critical parameters include:

- Spherical abrasives: Average spacing \(\Delta_s = 137.9 \cdot \frac{\pi (1 – M_{od})}{S_{tr} N_e – 32}\)
- Conical abrasives: Average spacing \(\Delta_c = 65.3 \cdot \frac{\pi (1 – M_{od})}{S_{tr} N_e – 32}\)
where \(M_{od}\) is grit size, \(S_{tr}\) is structure number, and \(N_e\) is effective abrasive coefficient. The material removal stages—rubbing, ploughing, and cutting—generate microgrooves and ridges on the gear surface.
Digital Modeling of Surface Texture and Roughness
The tooth profile is discretized into points \(P_{i,j}\):
$$ \mathbf{P}_{i,j} = \begin{bmatrix}
r_b \cos(\eta + \zeta) + r_b \zeta \sin(\eta + \zeta) \\
r_b \sin(\eta + \zeta) – r_b \zeta \cos(\eta + \zeta) \\
p_w \eta
\end{bmatrix} $$
Abrasive cutting trajectories update discrete point positions. For spherical abrasives, the interference condition is:
$$ D_{se} = \| \mathbf{B}_e^{(1)} – \mathbf{P}_{i,j} \| \leq 2 \sqrt{R_g \cdot k_{rf} \Delta t} $$
where \(R_g\) is abrasive radius, \(k_{rf}\) is feed rate, and \(\Delta t\) is time increment. Surface texture \(S_h\) is expressed as:
$$ S_h = \left\{ \Gamma_1, \Gamma_2, \dots, \Gamma_k \right\} $$
Texture orientation angle \(\alpha\) is calculated as:
$$ \alpha = \cos^{-1} \left( \frac{ \left( \mathbf{B}_e^{(j)} – \mathbf{B}_e^{(j-1)} \right) \cdot \frac{\partial \mathbf{r}_w}{\partial \zeta} }{ \left\| \mathbf{B}_e^{(j)} – \mathbf{B}_e^{(j-1)} \right\| } \right) $$
Surface roughness \(R_a\) incorporates elastic-plastic deformation. Maximum groove depth \(H\) is:
$$ H = \frac{3}{16} \Delta \cot \theta \left( p q \right)^{2/3} $$
where \(\theta\) is abrasive semi-angle, \(p\) is grinding condition coefficient, and \(q\) is shape distribution coefficient. The corrected \(p\) is:
$$ p = \frac{v_{w,\Gamma}}{c} \left( \frac{1}{\rho_w} – \frac{1}{\rho_h} \right) \left( v_{w,\Gamma} – v_{h,\Gamma} \right) $$
where \(c\) is grinding cycles, \(\rho\) is curvature radius, and \(v_\Gamma\) is velocity along texture direction. Final \(R_a\) is:
$$ R_a = 0.256 H $$
Experimental Validation and Surface Integrity Analysis
Experiments used 20CrMnTiH alloy steel gears (Table 1) processed on a Fässler HMX-400 gear honing machine.
| Parameter | Value |
|---|---|
| Number of Teeth | 22 |
| Module (mm) | 2.627 |
| Pressure Angle (°) | 20.222 |
| Helix Angle (°) | 34 |
Three process routes were compared:
- Hobbing → Heat Treatment → Gear Honing
- Hobbing → Heat Treatment → Grinding → Gear Honing
- Hobbing → Heat Treatment → Grinding
Surface texture analysis revealed fishbone-like cross-hatched patterns after gear honing (Figure 2), contrasting with parallel grooves from grinding. Texture orientation \(\alpha\) varied with axial angle \(\gamma\):
- At \(\gamma = 0°\), \(\alpha \approx 0°\) (parallel to tooth profile)
- At \(\gamma = 5° – 10°\), \(\alpha\) peaked at 90° near the pitch line
- At \(\gamma > 10°\), \(\alpha\) decreased monotonically from root to tip
Surface roughness \(R_a\) decreased with higher \(\gamma\) and honing wheel speed \(n_h\) (Table 2).
| Parameter | \(R_a\) (μm) | Change |
|---|---|---|
| Axial Angle \(\gamma\) ↑ (5° to 15°) | 0.45 → 0.25 | -44.4% |
| Honing Speed \(n_h\) ↑ (775 to 900 rpm) | 0.42 → 0.33 | -21.4% |
Hardness tests showed gear honing produced superior surface hardness (770 HV₁) and lower gradient compared to grinding (720 HV₁). The hardened layer depth was 130 μm vs. 171 μm for grinding.
Conclusions
- The axial angle \(\gamma\) critically controls texture orientation in gear honing. Optimal noise reduction occurs at 5° < \(\gamma\) < 10°.
- Surface roughness decreases with higher \(\gamma\) and honing wheel speed. The spherical abrasive model predicted \(R_a\) with <8.67% error.
- Gear honing enhances surface hardness (770 HV₁) and reduces hardness gradients versus grinding, improving load distribution.
This study provides a theoretical foundation for optimizing internal gearing power honing processes in high-speed gear manufacturing.
