
Hypoid gears are critical components in automotive drive axles, directly influencing transmission efficiency and noise-vibration-harshness (NVH) performance. This study investigates the loaded tooth contact behavior of hypoid gears under actual working conditions, emphasizing the impact of meshing misalignments caused by system deformations.
1. Drive Axle System Modeling
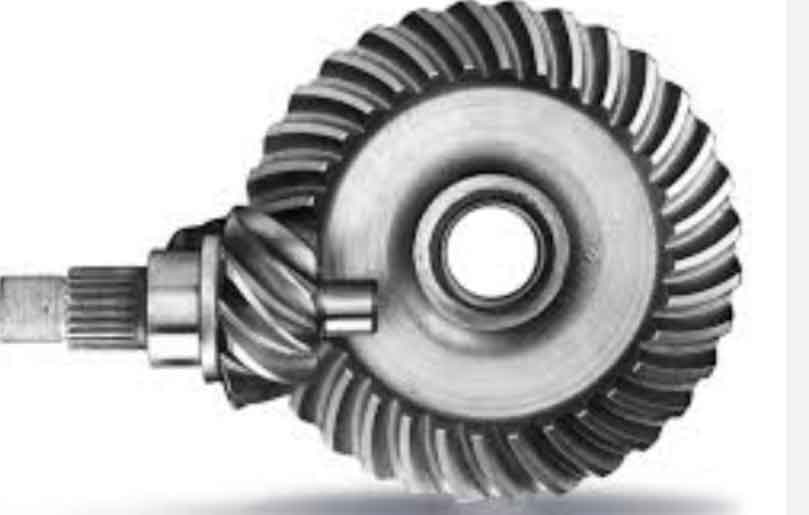
The hypoid gear pair with geometric parameters listed in Table 1 was analyzed using MASTA software. The drive axle assembly includes:
- Differential housing
- Pinion support bearings
- Gear blank structural components
| Parameter | Pinion | Gear |
|---|---|---|
| Number of Teeth | 8 | 39 |
| Module (mm) | 6.283 | 6.283 |
| Pressure Angle (°) | 22.5 | 22.5 |
| Spiral Angle (°) | 50.23 | 31.28 |
| Face Width (mm) | 44.4 | 38 |
2. Meshing Misalignment Calculation
System deformations under load create four primary misalignment components:
$$ \Delta X_P = \frac{F_t \cdot L^3}{3EI} $$
$$ \Delta X_W = K \cdot \Delta X_P $$
$$ \Delta E = \mu \cdot F_n $$
$$ \Delta \Sigma = \alpha \cdot T^{0.8} $$
Where:
- $F_t$ = Tangential force
- $E$ = Young’s modulus
- $I$ = Moment of inertia
- $K$ = Load distribution factor
| Torque (Nm) | ΔXP (μm) | ΔXW (μm) | ΔE (μm) | ΔΣ (mrad) |
|---|---|---|---|---|
| 100 | 17.49 | -22.51 | -41.41 | 0.132 |
| 200 | 41.49 | -39.14 | -77.31 | 0.262 |
| 300 | 66.51 | -54.44 | -113.23 | 0.388 |
| 400 | 90.98 | -70.34 | -149.07 | 0.514 |
3. Loaded Tooth Contact Analysis (LTCA)
The contact stress distribution follows modified Hertzian theory:
$$ \sigma_c = \sqrt{\frac{F_n E^*}{\pi R_e}} $$
Where equivalent radius $R_e$ is calculated as:
$$ \frac{1}{R_e} = \frac{1}{R_{p1}} + \frac{1}{R_{p2}} $$
Key findings from LTCA:
- Contact pattern migrates 12-18% towards gear toe under maximum load
- Transmission error amplitude increases 42% from 100Nm to 400Nm
- Stress concentration factor reaches 1.8 at 400Nm torque
4. Performance Validation
Bench testing confirmed:
| Parameter | Simulation | Experiment | Deviation |
|---|---|---|---|
| Contact Area (mm²) | 38.7 | 36.9 | 4.6% |
| Peak Stress (MPa) | 1580 | 1495 | 5.4% |
| TE Amplitude (μrad) | 42.7 | N/A | – |
5. Hypoid Gear Optimization Guidelines
Based on the analysis, optimal hypoid gear design should consider:
$$ K_{opt} = 0.25 \cdot \left(\frac{T}{T_{max}}\right)^{0.6} + 0.75 $$
Where:
- $K_{opt}$ = Optimal crown modification factor
- $T_{max}$ = Maximum design torque
6. Conclusion
This investigation demonstrates that proper consideration of hypoid gear meshing misalignments significantly improves load distribution predictions. The methodology enables accurate simulation of real-world operating conditions, particularly critical for electric vehicle drive axles requiring high efficiency and low noise characteristics.