
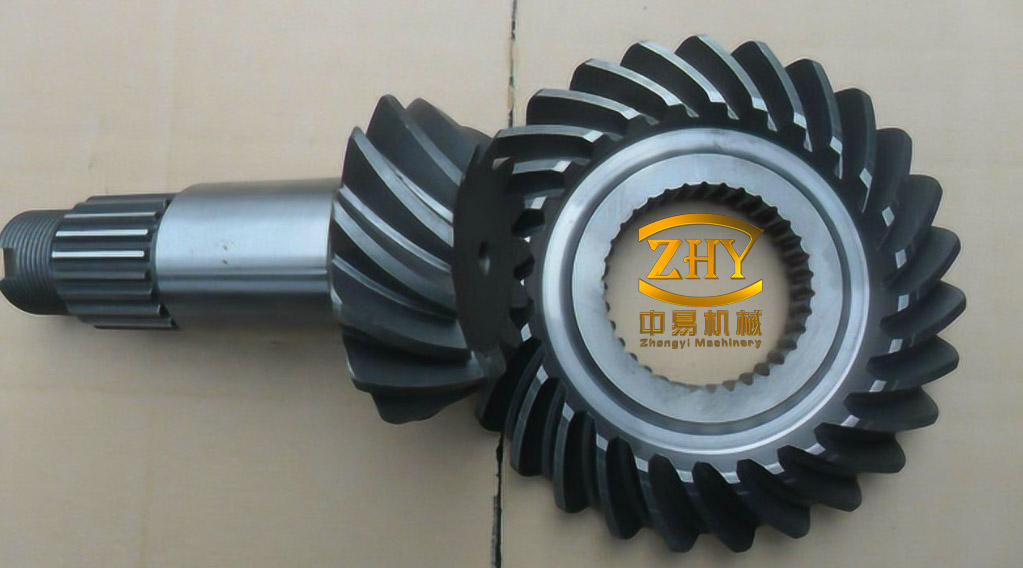
Spiral bevel gears carry high torque with a stable ratio and high transmission efficiency, which is why they sit at the input of vehicle, aircraft and marine drivetrains. The same geometry that makes them effective — a wide, curved tooth contact that rolls rather than slides — also makes their vibration signature unusually hostile to automated diagnosis. Tooth impact repeats with every mesh cycle, the housing is closed and heavily loaded, and the resulting signal is dominated by broadband background noise with strong nonlinear and non-stationary components. A fault that begins as a root crack or a chipped tooth propagates through the whole transmission chain, so detection has to work at the earliest stage rather than after a functional failure.
The diagnostic question is therefore not whether a classifier can separate four conditions in a laboratory, but what representation should be fed to it. Hand-crafted time-domain or frequency-domain indicators discard the coupling between amplitude, frequency and phase that distinguishes a cracked tooth from a healthy one. Time-frequency images preserve more, but constructing a clean, low-dimensional image from a noisy gear signal is itself difficult, and pixel-level inputs make network training slow. Higher-order spectra offer a middle path, and the design choice examined here is how much of that spectrum a convolutional network actually needs.
Bispectrum: retaining phase while rejecting Gaussian noise
For a zero-mean, real, stationary random signal {x(n)}, the second-order description starts from the autocorrelation
$$r(\tau)=E\{x(n)x(n+\tau)\}$$
and its Fourier transform, the power spectrum
$$P(\omega)=\sum_{\tau=-\infty}^{+\infty} r(\tau)e^{-j\omega\tau}$$
The power spectrum is blind to phase, which is precisely where much of the fault information lives. The third-order moment
$$R(\tau_1,\tau_2)=E\{x(n)x(n+\tau_1)x(n+\tau_2)\}$$
and its two-dimensional Fourier transform, the bispectrum,
$$B(\omega_1,\omega_2)=\sum_{\tau_1=-\infty}^{+\infty}\sum_{\tau_2=-\infty}^{+\infty}R(\tau_1,\tau_2)e^{-j(\omega_1\tau_1+\omega_2\tau_2)}$$
retain amplitude, frequency and phase simultaneously. In practice the bispectrum is estimated from the Fourier transform X(ω) of the record as
$$B(\omega_1,\omega_2)=X(\omega_1)X(\omega_2)X^{*}(\omega_1+\omega_2)$$
where the asterisk denotes complex conjugation. Two properties matter for gear diagnosis. First, the estimate is insensitive to the phase of individual frequency components in the sense that quadratic phase coupling — the interaction product that produces a peak at (ω1, ω2) — survives, while the bispectrum of a Gaussian process is identically zero. Coloured Gaussian noise, the dominant contaminant in a gearbox, is therefore suppressed rather than amplified. Second, the bispectrum is invariant to time shift and scales with signal amplitude, and it preserves phase, so it fits the strong-noise, nonlinear, non-stationary character of a bevel gear mesh. Earlier work has used bispectrum distribution regions as features for spur gears, combined empirical mode decomposition with bispectrum analysis for rolling bearings, and applied an improved decomposition-plus-bispectrum scheme to early motor-bearing faults; the common finding is that the bispectrum concentrates diagnostic information that second-order methods scatter.
Cutting the redundancy: the local bispectrum
The bispectrum of a real signal is highly symmetric:
$$B(\omega_1,\omega_2)=B(\omega_2,\omega_1)=B^{*}(-\omega_1,-\omega_2)$$
Symmetry about the main diagonal, about the anti-diagonal and about the origin means that a plotted bispectrum magnitude map repeats itself four times. Feeding a full map to a convolutional network therefore quadruples the input dimension while adding no independent information, and it widens the search space over which kernel size and depth must be optimised. The alternative is to keep the quarter-plane bounded by the two frequency axes — the region that contains the principal domain — and discard the rest.
Concretely, the vibration record is transformed into a two-dimensional bispectrum image, and the upper-left quarter is cropped. For a 256 × 256 full map this yields a 128 × 128 input, a fourfold reduction in pixels per sample. The crop is not a lossy compression of the diagnostic content: because the discarded quarters are mirror images, the retained quarter still carries the full amplitude–frequency–phase structure of the original signal. What changes is the cost of using it — smaller images narrow the range of kernel sizes that must be searched and shorten every convolution, which is where most of the training-time saving in the results below originates.
Network architecture and training protocol
The classifier is a compact convolutional network. A convolutional layer applies a set of kernels to the previous layer’s feature maps, sliding each kernel with a fixed stride and summing the products, so that each kernel extracts one type of local pattern:
$$a_j^{l}=\sigma\Big(\sum_{i\in M_j} a_i^{l-1}\ast \omega_{ij}^{l}+b_j^{l}\Big)$$
where ajl is the output of the j-th neuron in layer l, Mj is the set of input feature maps, ωij is the kernel, bjl is the bias and σ is the activation function. Pooling then compresses each map, most simply by taking the maximum over a local window, which reduces the matrix size and the arithmetic that follows. The pooled maps are rasterised into a single vector, passed through fully connected layers, and mapped to class scores by a softmax-type output of the form
$$h(x)=f(b_0+w_0 x)$$
with feature vector x, weights w0, bias b0 and activation f. Training proceeds by back-propagating the difference between predicted and target labels and adjusting the weights layer by layer.
The implemented network has eight layers: three convolutional layers, two activation layers, two downsampling layers and one fully connected layer, ending in a four-way output. Hyperparameters were fixed by successive refinement: 60 iterations, learning rate 0.000 1, and a minimum batch of 50 samples per training step. Kernel weights were randomly initialised and biases set to zero.
| Layer | Feature maps | Feature map size | Kernel / pooling size | Stride |
|---|---|---|---|---|
| Input | 1 | 128 × 128 | — | — |
| C1 (convolution) | 8 | 128 × 128 | 3 × 3 | 1 × 1 |
| P1 (pooling) | 8 | 64 × 64 | 2 × 2 | 2 × 2 |
| C2 (convolution) | 16 | 64 × 64 | 3 × 3 | 1 × 1 |
| P2 (pooling) | 16 | 32 × 32 | 2 × 2 | 2 × 2 |
| C3 (convolution) | 32 | 32 × 32 | 3 × 3 | 1 × 1 |
| F (fully connected) | 1 | — | — | — |
| Output | 1 | — | — | — |
Test rig and dataset
Validation used a spiral bevel gear fault simulation bench with the faulty component mounted on the input shaft and an accelerometer on the same shaft. Four gear conditions were prepared: healthy, one-third tooth break, two-thirds tooth break, and root crack. Vibration was acquired with a B&K measurement system at a sampling frequency of 8 192 Hz, with the input shaft driven at 1 200 r/min, corresponding to a rotation frequency of 20 Hz. Each record was split into segments of 1 024 points — 0.125 s of data, giving a frequency resolution of 8 Hz — and every segment was transformed into a bispectrum image from which the 128 × 128 local map was cropped. In total, 500 samples were generated per condition, 2 000 across the four classes.
From each class, 150 local bispectrum samples were drawn at random to form a 600-sample training set, and the remaining 350 per class formed a 1 400-sample test set. All reported accuracies are measured on the test set; each configuration was run 100 times and the results averaged, to remove the variability of a single initialisation.
Diagnosis results
During training the accuracy rose and the loss fell towards zero as iterations increased, reaching 99.50 % at the maximum of 60 iterations. Averaged over 100 repeated runs, the local bispectrum plus CNN pipeline achieved 99.56 % mean test accuracy with a model training time of 15 s.
Four alternative pipelines were run on the same data for comparison: the full bispectrum with the same CNN, the raw one-dimensional vibration signal with the CNN, and the local bispectrum with a support vector machine or a back-propagation network. The SVM used an RBF kernel with δ = 3 and penalty factor C = 4, selected by cross-validation; the BP network had 32 hidden nodes with ReLU activation.
| Method | Input representation | Average accuracy (%) | Training time (s) |
|---|---|---|---|
| Local bispectrum + CNN | 128 × 128 quarter-plane map | 99.56 | 15 |
| Full bispectrum + CNN | 256 × 256 full map | 99.53 | 78 |
| Vibration signal + CNN | 1-D raw time series | 92.65 | 18 |
| Local bispectrum + SVM | 128 × 128 quarter-plane map | 98.03 | 2 763 |
| Local bispectrum + BP | 128 × 128 quarter-plane map | 88.91 | 631 |
The comparison isolates the contribution of each design decision. Cropping the bispectrum changes accuracy by 0.03 percentage points — 99.56 % against 99.53 % — while cutting training time from 78 s to 15 s, a factor of roughly five. Because the two inputs carry the same information, the saving is attributable to input dimension: the smaller map reduces both the arithmetic per convolution and the range of kernel sizes that the optimiser must explore. Replacing the bispectrum with the raw time series is the opposite trade: training takes 18 s, essentially the same order as the local bispectrum route, but mean accuracy drops to 92.65 %. The one-dimensional record is noisy and offers the network no explicit phase coupling to learn from, so speed is bought at the cost of discriminability.
Holding the input fixed and changing only the classifier produces the largest differences in cost. The SVM, despite reaching 98.03 %, required 2 763 s of training, about 184 times the CNN figure. The reason is structural rather than a matter of tuning: a multi-class SVM is assembled from one-against-one binary classifiers, each trained on only the two relevant classes, and its performance depends heavily on the quality of the feature representation supplied to it. The local bispectrum is a good representation, which is why accuracy stays close to the CNN; the training architecture is what makes it slow. The BP network, at 88.91 %, is the weakest of the five. As a shallow model it has limited capacity to build the nonlinear mapping between image patterns and fault classes, so parts of the local bispectrum remain unused, and its 631 s training time is second only to the SVM.
The CNN’s advantage is the combination of depth and weight sharing. Stacked convolutional layers give it the nonlinear capacity to separate fault signatures that overlap in the input map, while sharing each kernel across the whole image keeps the number of trainable parameters small, so convergence is fast despite the depth. Sample-wise inspection of the test outputs is consistent with the aggregate figures: every method misclassified some samples, but the local bispectrum plus CNN produced visibly fewer errors than the other four.
Scope and open questions
These results establish that the quarter-plane bispectrum is a better input than either the full bispectrum or the raw waveform for this network and this gear set, but they do not establish generality. The dataset covers one gear geometry, one shaft speed (1 200 r/min) and four discrete conditions, and the 2 000 samples derive from a single acquisition campaign on one bench. Fault severity is represented by two discrete break levels rather than a continuous progression, so the method has not been shown to grade damage. Behaviour under variable speed and load — the normal operating regime of an aircraft or vehicle drivetrain — is untested, and no experiments with added artificial noise are reported, even though Gaussian noise rejection is one of the theoretical arguments for using the bispectrum at all. The hyperparameter set (60 iterations, learning rate 0.000 1, batch 50) was itself selected by search on this data, so the reported training time should be read as a property of a tuned pipeline rather than a lower bound. Finally, the comparison methods used fixed, cross-validated configurations; a more heavily tuned SVM or BP network would narrow the accuracy gap, though not the architectural difference in training cost.
Conclusions
For spiral bevel gears, whose vibration signals combine strong background noise with nonlinear, non-stationary mesh dynamics, the bispectrum provides a representation that preserves amplitude, frequency and phase while suppressing Gaussian contamination. Its symmetry, however, makes the full map an inefficient network input. Keeping only the quarter-plane bounded by the frequency axes retains all independent information at one quarter of the pixel count and reduces CNN training time from 78 s to 15 s with no measurable loss of accuracy (99.56 % against 99.53 %). Against the raw vibration signal the bispectrum route trades 3 s of training for a gain of about 7 percentage points in accuracy; against shallow classifiers applied to the same local bispectrum, the CNN is both more accurate than BP (99.56 % versus 88.91 %) and roughly 184 times faster to train than the SVM (15 s versus 2 763 s). The practical conclusion is that input representation and classifier capacity are coupled decisions: a compact, phase-preserving image and a weight-sharing deep network reinforce each other, whereas either alone leaves accuracy or training cost on the table.