
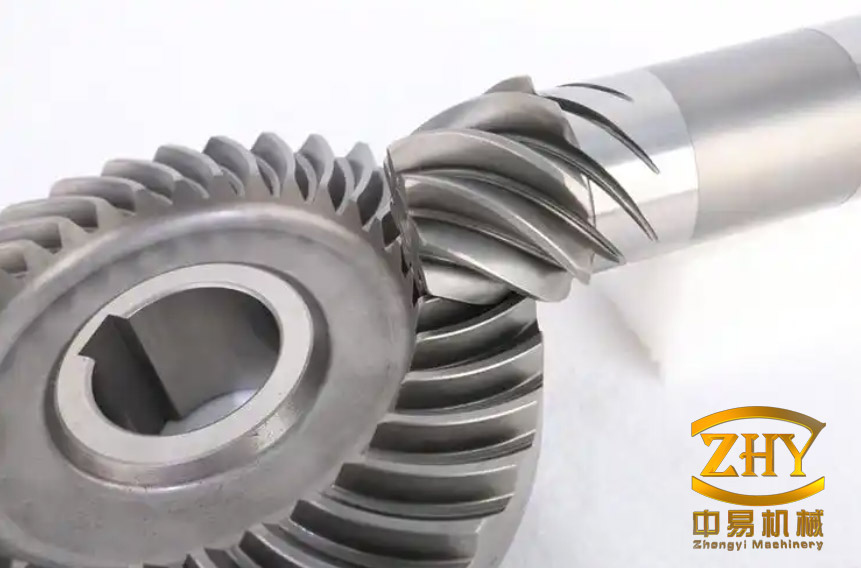
Spiral bevel gears are the default solution for transmitting motion between intersecting shafts in precision machine tools, high-speed rail drives, and aerospace gearboxes. Their curved teeth are finish-machined by generating grinding, in which a rotating cup wheel and a coordinated workpiece motion produce the convex and concave flanks. The final areal roughness of those flanks affects contact fatigue, noise, and running-in behavior, so predicting roughness from process settings is a practical control problem.
Physics-based grinding models can represent grit geometry, kinematics, and material removal, but they struggle with the scatter introduced by thermal distortion, wheel wear, and machine vibration. Machine learning offers a complementary route: learn the mapping from grinding speed, generating speed, and depth of cut to measured roughness. The central difficulty is data. In spiral bevel gear grinding, runs are expensive and datasets are small.
The evidence discussed here comes from a 12-run grinding dataset for 18Cr2Ni4WA spiral bevel gears. It compares decision tree, support vector regression, and artificial neural network models, derives a quadratic response surface for convex and concave flanks, and uses SHAP to rank process parameters. The results are useful for interpolation and process screening, but the sample size sets a clear limit on how far the conclusions can be generalized.
Why Grinding Roughness Is Difficult to Model
Generating grinding of a spiral bevel gear is not a single-point cutting process. The wheel and workpiece follow a timed generating motion, and the contact condition changes continuously along the tooth. The convex flank is ground by one side of the wheel, the concave flank by the other, so the two surfaces experience different effective grit engagement, curvature, and thermal histories. Roughness is therefore an areal statistic of a spatially varying process, not a single groove depth.
Mechanistic models can account for wheel topography, grit protrusion, undeformed chip thickness, and the kinematics of the generating motion. They are valuable for understanding why roughness varies along the tooth. In production, however, the residual scatter is also driven by wheel wear, spindle and workpiece vibration, coolant conditions, and thermal distortion. These effects are difficult to represent explicitly, which creates a role for data-driven models that learn the input–output relationship directly from measured runs.
Dataset, Material, and Measurement
The workpiece material was 18Cr2Ni4WA, a carburizing-grade high-strength steel. Before grinding, the gears were carburized at 900 °C for 420 min to a case depth of about 1.5 mm, austenitized at 800 °C for 80 min and oil-quenched, then tempered at 200 °C for 200 min and air-cooled. Grinding was performed on a Gleason-600G CNC gear grinding machine with a straight-cup seeded-gel ceramic alumina wheel of grit 46. The areal roughness was measured with a CCILITE-M112 white-light interferometer.
The roughness parameter used here is the areal mean height, calculated over the measured area \(A\) as
$$
V_{Sa}=\frac{1}{A}\iint_A \left|z(x,y)\right|\,\mathrm{d}x\,\mathrm{d}y
$$
where \(z(x,y)\) is the local height deviation from the reference plane. The same calculation applied to the concave flank is denoted \(V’_{Sa}\). The 12 runs combine a nine-run orthogonal array with three single-factor runs. The orthogonal runs formed the training set and the single-factor runs the test set, giving a 3:1 split.
| Run | Wheel speed (m/s) | Generating speed (°/s) | Grinding depth (mm) | Convex \(V_{Sa}\) (µm) | Concave \(V’_{Sa}\) (µm) |
|---|---|---|---|---|---|
| 1 | 15 | 8 | 0.05 | 0.657 | 0.450 |
| 2 | 15 | 10 | 0.03 | 0.567 | 0.423 |
| 3 | 15 | 12 | 0.07 | 0.633 | 0.439 |
| 4 | 20 | 8 | 0.03 | 0.527 | 0.416 |
| 5 | 20 | 10 | 0.07 | 0.586 | 0.429 |
| 6 | 20 | 12 | 0.05 | 0.520 | 0.414 |
| 7 | 25 | 8 | 0.07 | 0.550 | 0.429 |
| 8 | 25 | 10 | 0.05 | 0.502 | 0.392 |
| 9 | 25 | 12 | 0.03 | 0.451 | 0.352 |
| 10 | 20 | 6 | 0.03 | 0.585 | 0.435 |
| 11 | 20 | 10 | 0.03 | 0.485 | 0.399 |
| 12 | 20 | 10 | 0.05 | 0.547 | 0.415 |
Two features of the dataset matter for interpretation. First, the convex flank was rougher than the concave flank in every run: convex values span 0.451–0.657 µm, while concave values span 0.352–0.450 µm. Second, the test runs are not a random sample. They probe single-factor changes around the central conditions, so the reported test error measures interpolation along those directions rather than broad generalization across the process space.
Model Set and Tuning
Three regression models were compared using the same three inputs: wheel speed \(v_s\), generating speed, and grinding depth \(a_p\). The output was either convex or concave areal roughness. Inputs were min-max normalized before training so that variables with different units contributed on a comparable scale:
$$
x’=\frac{x_0-X_{\min}}{X_{\max}-X_{\min}}
$$
The decision tree partitions the input space into leaf regions and predicts a constant value in each leaf. Support vector regression fits a function within an \(\varepsilon\)-insensitive band and, with a radial basis function kernel, can represent nonlinear responses. The artificial neural network used a 3-5-3-3-1 topology: three inputs, three hidden layers with 5, 3, and 3 neurons, and one output. Hyperparameters were selected with a combination of engineering judgment, grid search, and cross-validation. The settings that produced the best regression scores are summarized below.
| Model | Setting | Value |
|---|---|---|
| Decision tree | Maximum depth; minimum samples per leaf; minimum samples per split | 3; 2; 2 |
| SVR | Kernel; regularization parameter \(C\) | RBF; 1 |
| ANN | Hidden-layer sizes | (5, 3, 3) |
| ANN | Solver; activation function | L-BFGS; tanh |
| ANN | Maximum iterations; random state | 100; 34 |
Accuracy, Stability, and the Small-Sample Caveat
Model quality was assessed with the coefficient of determination and root-mean-square error:
$$
R^2 = 1 – \frac{\sum_{i=1}^{n}(y_i-\hat{y}_i)^2}{\sum_{i=1}^{n}(y_i-\bar{y})^2}
$$
$$
\mathrm{RMSE}=\sqrt{\frac{1}{n}\sum_{i=1}^{n}(y_i-\hat{y}_i)^2}
$$
A value of \(R^2\) near 1 and a low RMSE indicate close agreement with the measured roughness. Stability was examined over 20 repeated runs. The decision tree showed the weakest stability and clear underfitting: its predictions were scattered around the identity line, so the tree structure was too coarse for the response. SVR fitted the training records reasonably well but lost accuracy on the test records, a pattern consistent with overfitting. The ANN gave the closest agreement on both flanks; its mean relative error was 3.5% for the convex surface and 6.09% for the concave surface, with a maximum convex error of 7.2% over the three test runs.
| Model | Observed behavior | Practical reading |
|---|---|---|
| Decision tree | Underfitting; scattered predictions | Too coarse for this response |
| SVR | Good training fit; weaker test fit | Overfitting risk |
| ANN | Closest fit; mean relative error 3.5% convex, 6.09% concave | Best interpolation, slowest fitting |
The ANN’s advantage should be read in proportion to the evidence. The network has 54 adjustable weights and biases, while the training set contains only nine records. A model of that capacity can fit a small dataset closely without establishing a general physical law. The three-point test set is useful as a consistency check, but a mean relative error over three runs is not a reliable estimate of production capability. The concave error is larger in relative terms partly because concave roughness is lower in absolute value, so the same absolute deviation becomes a larger percentage.
Response time followed the expected pattern. The decision tree and SVR fitted faster, while the ANN was slowest, consistent with iterative backpropagation and a larger parameter set. All fitting and prediction times were short because the dataset is small; those timings should not be extrapolated to production-scale data.
Quadratic Response Surface for Convex and Concave Flanks
To provide a compact process-map expression, a quadratic response surface was fitted to ANN-generated data over wider design ranges. Let \(x_1\) be wheel speed in m/s, \(x_2\) generating speed in °/s, and \(x_3\) grinding depth in mm. The fitted surfaces are
$$
\begin{aligned}
V_{Sa,\mathrm{convex}} ={}&1.4220-0.0522x_1-0.0588x_2+2.1000x_3\\
&+0.0007x_1^2+0.0006x_2^2+0.0015x_1x_2\\
&+0.0433x_1x_3+0.1000x_2x_3
\end{aligned}
$$
$$
\begin{aligned}
V’_{Sa,\mathrm{concave}} ={}&1.2828-0.0230x_1-0.0944x_2-6.1833x_3\\
&+0.0030x_2^2+0.0008x_1x_2\\
&+0.1967x_1x_3+0.3333x_2x_3
\end{aligned}
$$
| Variable | Symbol | Range |
|---|---|---|
| Wheel speed | \(x_1\) | 10–25 m/s |
| Generating speed | \(x_2\) | 5–15 °/s |
| Grinding depth | \(x_3\) | 0–0.1 mm |
These equations are local empirical surrogates, not mechanistic cutting models. Their coefficients carry units and should not be compared directly across terms. The linear depth term is positive for the convex flank and negative for the concave flank, while the interaction terms differ between the two surfaces. That behavior reflects the local shape of the fitted response, not a universal rule for all wheels, materials, or machines. The fit ranges also exceed the 12-run experimental window of 15–25 m/s, 8–12 °/s, and 0.03–0.07 mm, so predictions near the outer edges rely on ANN-generated data rather than direct grinding trials.
On the three test runs, the response surface gave mean relative errors of 3.5% for the convex flank and 6.09% for the concave flank, matching the ANN-level accuracy quoted above. This makes the polynomial useful for visualizing process windows and for preliminary parameter screening, provided the user stays aware that it inherits both the ANN fit and the limitations of the original 12 runs.
Feature Importance from SHAP
SHAP decomposes a model prediction into additive contributions from the input features. For feature \(j\) in a set of features \(N\), the Shapley value is
$$
\phi_j=\sum_{S\subseteq N\setminus\{j\}}\frac{|S|!\,(|N|-|S|-1)!}{|N|!}\left[v(S\cup\{j\})-v(S)\right]
$$
where \(S\) is a subset of features excluding \(j\), and \(v(S)\) is the model output obtained with that subset. The magnitude of \(\phi_j\) indicates how strongly feature \(j\) shifts the prediction relative to the baseline. Applied to the trained model, the SHAP ranking was the same for both flanks: wheel speed had the largest influence, grinding depth was second, and generating speed was third.
The ranking is technically useful because it converts a black-box model into a process-control priority. Wheel speed changes the effective grit engagement, spark-out behavior, and heat partition; grinding depth changes the uncut chip thickness and the wheel–workpiece contact load; generating speed changes the kinematic path and the time over which grits interact with a local surface. SHAP quantifies the model’s association within the sampled range, not a causal law. Its main value here is to show that, for this dataset, wheel speed is the first variable to examine when explaining or controlling roughness, while generating speed is the least influential of the three.
Practical Implications and Limits
The comparison supports a clear engineering conclusion for this material, wheel, and machine combination: a shallow decision tree is too coarse, SVR is prone to overfitting on the small sample, and an ANN provides the best interpolation of the measured roughness. The quadratic surrogate condenses the ANN response into two equations that can be plotted and used for process-window screening. SHAP adds a second layer of interpretation by ranking wheel speed above grinding depth and generating speed.
The limitations are equally clear. The dataset contains 12 runs, the training set contains nine records, and the test set contains three single-factor runs. The ANN’s low error on those runs demonstrates that the model can reproduce the observed response, not that it will generalize to new gear geometries, wheel specifications, or lubrication conditions. The polynomial surface extends beyond the experimental window and should be treated as an interpolation aid in that region, not as a validated predictor. The appropriate use of these models is to rank parameters, reduce trial runs, and guide further experiments within the tested domain; final process qualification still requires independent grinding trials and physical interpretation of the surface-generation mechanism.