
Throughout my career in precision gear engineering, I have consistently observed that hypoid gears represent one of the most challenging yet critical components in modern powertrains, particularly in the automotive industry. Their unique geometry, characterized by crossed axes and a high offset, enables compact driveline designs with high torque capacity. However, this very complexity makes the accurate manufacture, measurement, and performance prediction of hypoid gears extraordinarily difficult. Unlike involute gears with well-defined reference surfaces, the tooth flank of a hypoid gear is a complex spatial surface whose final form is entirely dependent on the kinematics and settings of the specialized machine tool used to generate it. The proprietary nature of these machine tools, held closely by manufacturers, further complicates open research and standardized quality control. Consequently, the industry has long relied on experienced technicians and subjective methods like contact pattern checking, which cannot guarantee consistent quality or predict dynamic behavior such as noise and vibration. In this article, I will share my perspective on leveraging advanced measurement data—specifically from lattice and scanning methods—to revolutionize the quality management and dynamic performance simulation of hypoid gears.
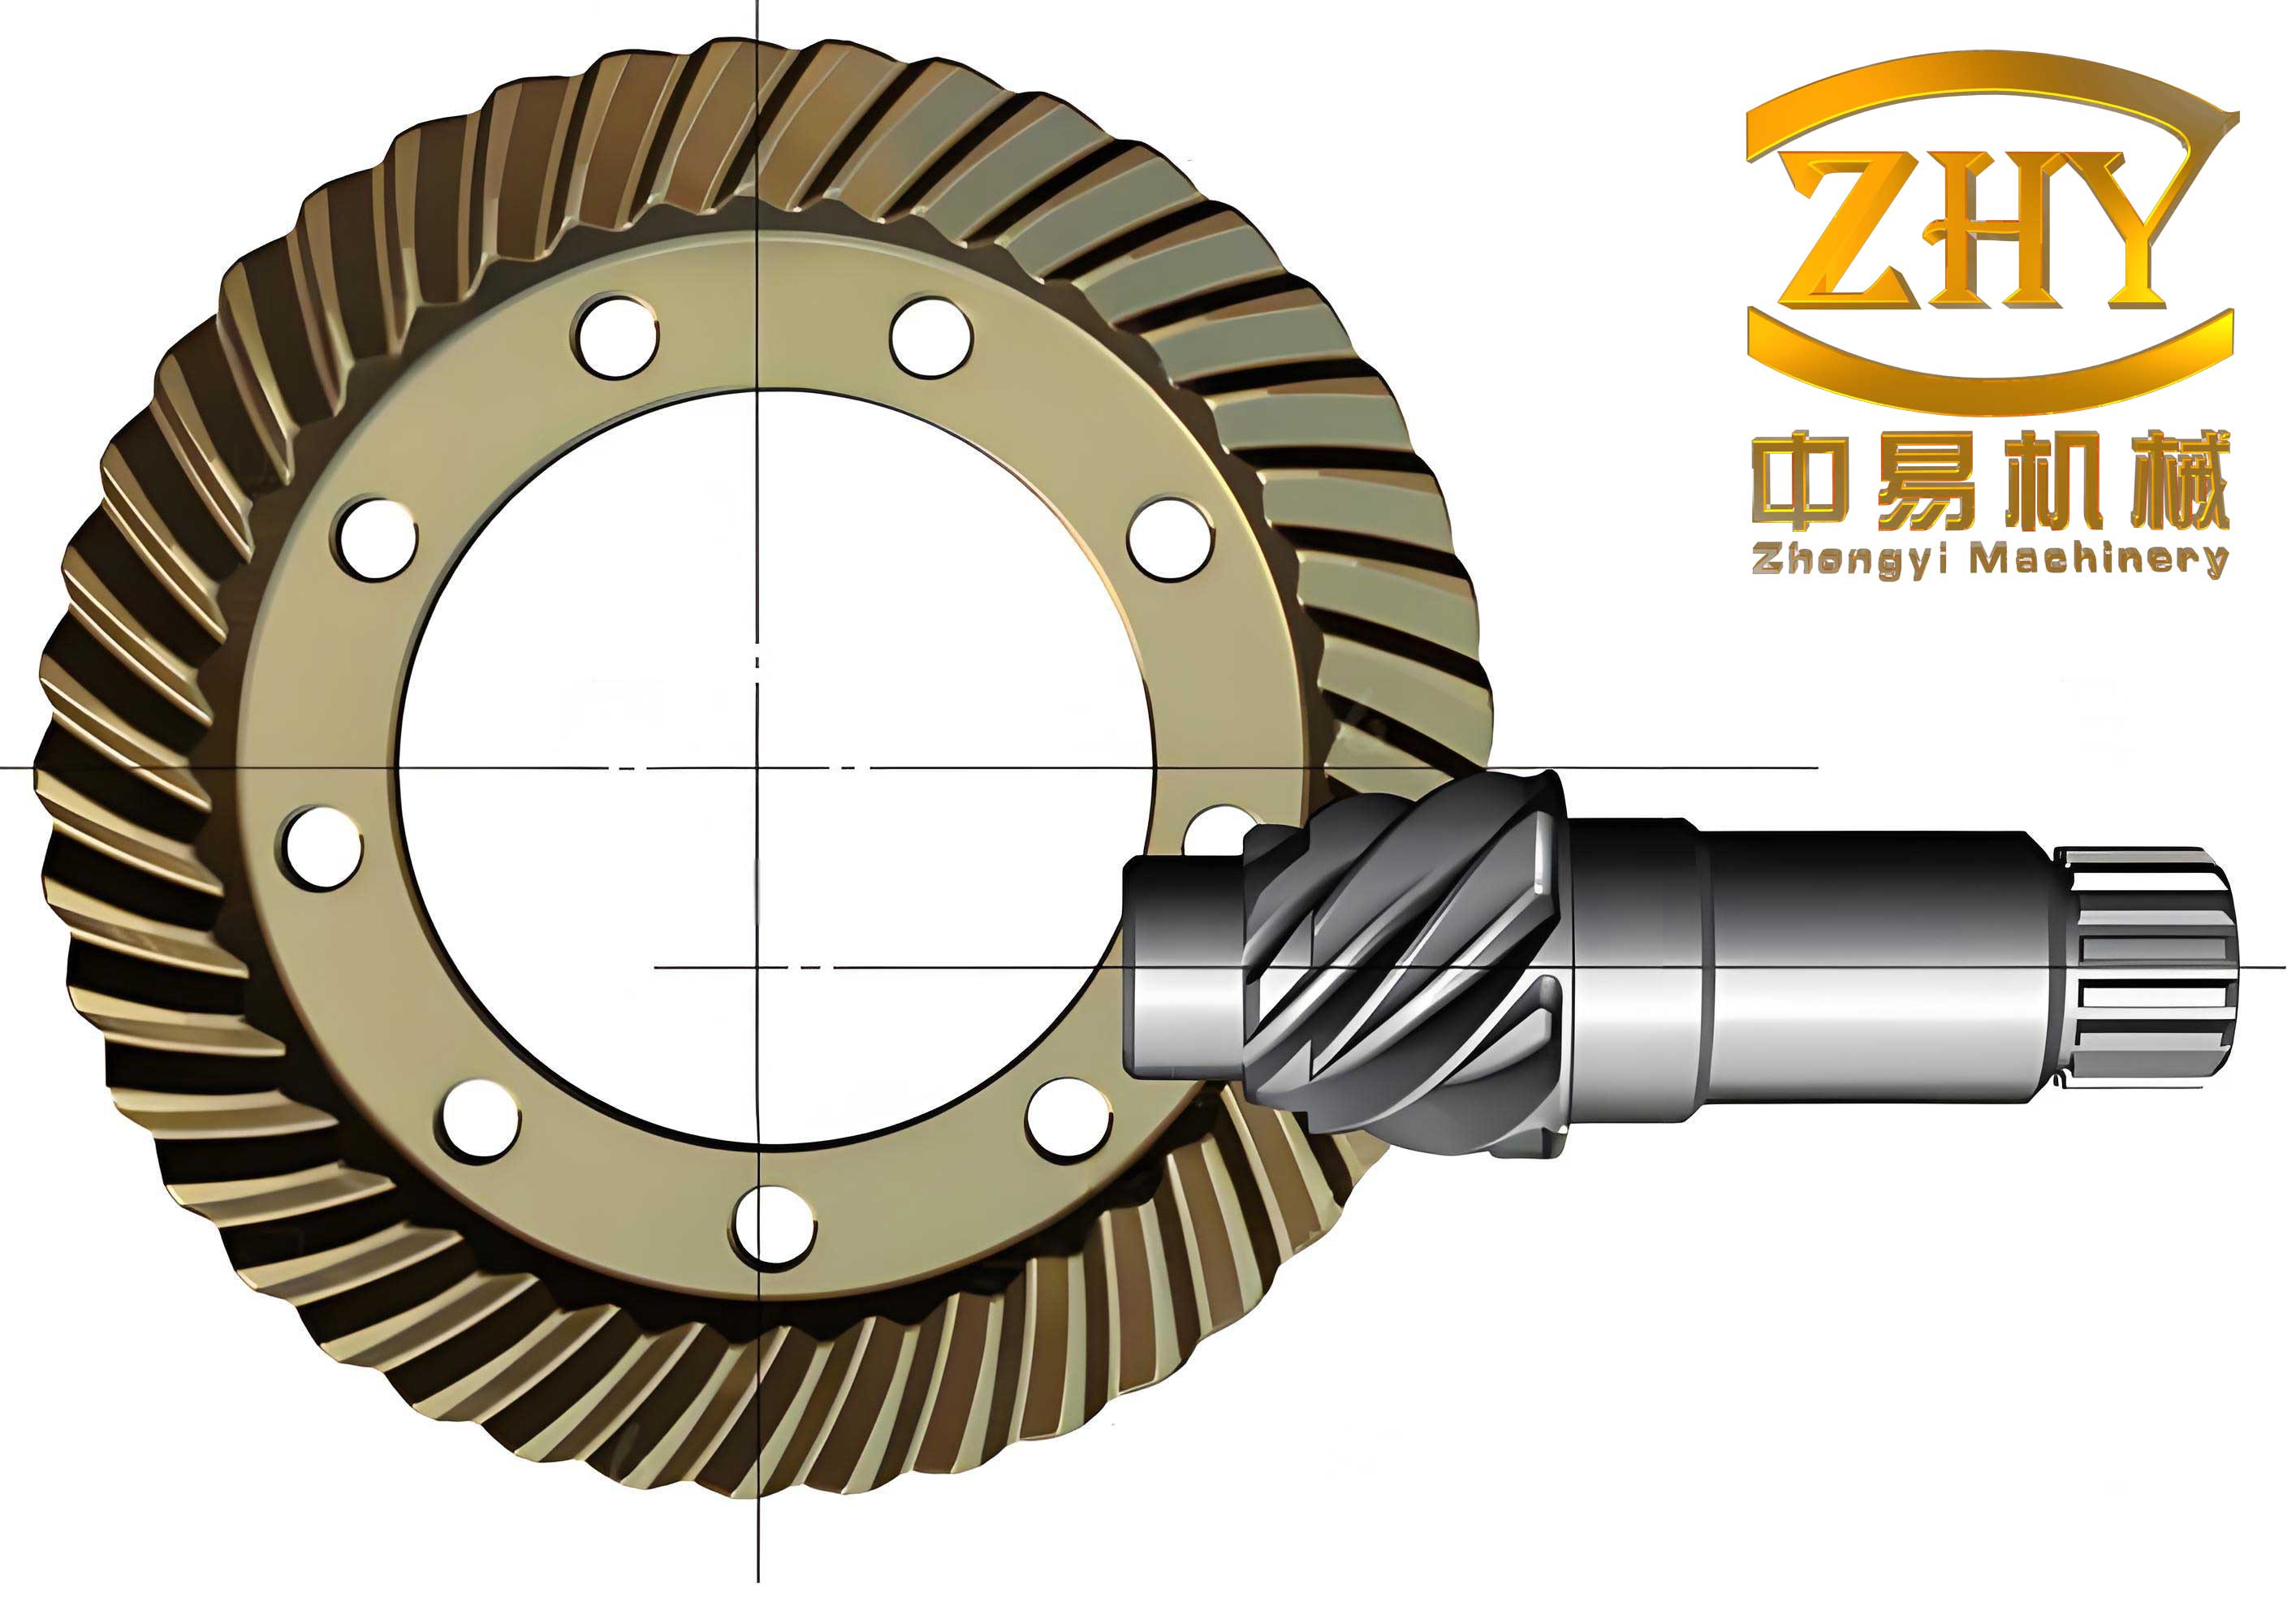
Advanced Metrology for Hypoid Gear Tooth Flanks
The foundation for any objective quality assessment and performance prediction is accurate and comprehensive measurement data of the actual manufactured tooth surface. I have worked extensively with two primary measurement paradigms, each with distinct characteristics and applications.
Lattice (Pointwise) Measurement
Lattice measurement is typically performed using a high-precision Coordinate Measuring Machine (CMM). The process involves bringing a touch-trigger probe into contact with the actual tooth surface along its theoretical normal direction at a predefined grid of points. A common grid for hypoid gears consists of 5 points along the tooth depth (u-direction) and 9 points along the tooth profile (v-direction), resulting in 45 measured points per flank. The primary advantage of this method, in my experience, is its high inherent accuracy. Since the probe approaches the surface along the normal and uses a point contact, it avoids errors induced by sliding friction. However, the method has significant drawbacks: measurement speed is very low, probe interference is a major issue when measuring the concave flanks of small-module pinions, and there is a high risk of probe damage or slippage. Furthermore, the sparse grid fails to capture the full tooth flank area, particularly missing data at the heel and toe edges, which are critical for understanding lapping allowance and edge contact under load.
Scanning (Continuous) Measurement
Scanning measurement utilizes specialized gear inspection instruments, such as the OSK Hyb-35, which employ a two-dimensional measuring head. This head maintains contact with the tooth flank while the gear rotates and the head translates, following a path that keeps the measuring force direction nearly constant relative to the surface. This allows for the continuous collection of hundreds or thousands of data points along predetermined scan lines. Typical patterns can involve 9 profile lines with 29 lead lines, or even a dense grid covering the entire active flank. The overwhelming advantage is data density and speed. It can measure the complete tooth surface, including edges, providing a holistic view of the manufactured geometry. The trade-off is that the continuous contact and sliding motion introduce frictional forces that can slightly influence the measurement results, potentially reducing absolute accuracy compared to a high-end CMM.
The following table summarizes my comparative analysis of these two fundamental methods for measuring hypoid gears:
| Feature | Lattice (CMM) Measurement | Scanning Measurement |
|---|---|---|
| Data Density | Low (e.g., 5×9 grid = 45 points) | Very High (hundreds to thousands of points) |
| Measurement Area | Limited central area; misses heel/toe. | Full tooth flank, including edges. |
| Speed | Very Slow | Fast |
| Probe Interference Risk | High, especially on pinions. | Low, optimized head path. |
| Primary Error Source | Probe lobing, positioning errors. | Friction, force deflection. |
| Best Application | High-accuracy verification, machine setting correction. | Full-field mapping, quality trend analysis, lapping control. |
Application of Measurement Data in Quality Management
The raw measurement data, whether sparse or dense, is not an end in itself. Its true value is unlocked through intelligent application in the manufacturing process control loop for hypoid gears.
Lapping Allowance and Heat Treatment Deformation Management
Scanning measurement data is indispensable for managing the lapping process. By providing a complete map of the tooth flank before lapping, it allows engineers to precisely visualize and control the stock removal. One can identify areas with excessive or insufficient material, ensuring a controlled and predictable final contact pattern after the abrasive process. Furthermore, comparing full-field scans of a gear before and after heat treatment provides unparalleled insight into deformation patterns. In my work, I have used such comparisons to identify systematic distortions—such as tooth twisting or crowning changes—and then proactively adjust the pre-heat-treatment tooth geometry (via machine settings) to compensate, thereby ensuring the post-treatment gear meets specifications.
Machine Setting Correction and Ideal Surface Generation
This is where lattice measurement data from a CMM excels. The process involves comparing the measured deviations of the 45 grid points from their theoretical positions. Let the theoretical surface be defined by a vector function $ \mathbf{S}_t(u, v, \mathbf{P}) $, where $ \mathbf{P} = [p_1, p_2, …, p_n]^T $ is the vector of machine setting parameters (e.g., cutter head geometry, tilt, swivel, machine root angles, offsets). The measured point $ \mathbf{M}_{ij} $ corresponds to the theoretical parameters $(u_i, v_j)$. The deviation $ \delta_{ij} $ is the normal distance between $ \mathbf{M}_{ij} $ and $ \mathbf{S}_t(u_i, v_j, \mathbf{P}_0) $, where $ \mathbf{P}_0 $ are the initial settings.
The core problem is to find a correction vector $ \Delta \mathbf{P} $ such that the sum of squared deviations is minimized. This can be formulated as a nonlinear least-squares problem:
$$ \min_{\Delta \mathbf{P}} \sum_{i,j} || \delta_{ij}(\mathbf{P}_0 + \Delta \mathbf{P}) ||^2 $$
By linearizing the relationship between deviations and parameters using the sensitivity matrix (Jacobian) $ \mathbf{J} $, where $ J_{kl} = \frac{\partial \delta_k}{\partial p_l} $, the correction can be approximated by solving:
$$ \mathbf{J}^T \mathbf{J} \Delta \mathbf{P} = -\mathbf{J}^T \mathbf{\delta} $$
where $ \mathbf{\delta} $ is the vector of all measured deviations. I have implemented this approach iteratively. After measuring a test gear cut with settings $ \mathbf{P}_0 $, calculating $ \Delta \mathbf{P} $, and adjusting the machine to $ \mathbf{P}_1 = \mathbf{P}_0 + \Delta \mathbf{P} $, a new gear is cut and measured. The process repeats, often converging to a highly accurate tooth form within two or three iterations. The sparse but high-accuracy lattice data is perfectly suited for this computationally intensive parameter identification task.
Dynamic Performance Simulation from Measured Data
The ultimate goal of precision metrology for hypoid gears is to predict functional performance. By constructing a digital twin of the actual gear pair from measurement data, we can simulate its behavior under real operating conditions, moving far beyond the static contact pattern test.
Unloaded Kinematic Simulation: Transmission Error and Contact Path
The foundation of dynamic simulation is the unloaded transmission error (TE), which is the primary excitation source for gear noise. TE is defined as the difference between the actual position of the output gear and its ideal position assuming perfectly rigid, conjugate gears. For a pair of measured hypoid gears, the composite surface deviation must be calculated. This involves “mating” the measured pinion and gear flanks according to their theoretical kinematic relationship and calculating the minimal distance between them at each increment of mesh roll. Let $ \phi_p $ and $ \phi_g $ be the rotation angles of the pinion and gear, related by the ratio $ \tau $. For a given pinion roll angle $ \phi_p $, the theoretical gear angle is $ \phi_g = \tau \phi_p $. The unloaded composite deviation $ \Delta(\phi_p) $ at this mesh position is found by solving for the point of closest contact between the two measured flank models while satisfying the spatial conjugacy condition. This deviation directly translates to kinematic transmission error:
$$ TE(\phi_p) = R_{bg} \cdot \Delta(\phi_p) $$
where $ R_{bg} $ is the base radius of the gear. Plotting $ TE(\phi_p) $ over one mesh cycle reveals the unloaded excitation pattern. The locus of contact points calculated during this process accurately predicts the unloaded contact path on the tooth flank, which is invaluable for initial design evaluation.
Loaded Tooth Contact Analysis (LTCA)
While unloaded simulation is insightful, real hypoid gears operate under significant load, which deforms the teeth and alters the contact pattern and stress distribution. LTCA simulation using measured data is crucial. The process involves modeling the gear teeth as a series of independent, elastic “slices” or using a detailed finite element model. The measured surface deviations are superimposed onto the nominal tooth geometry as initial separations (or penetrations). Under an applied torque $ T $, the system seeks a state of equilibrium where the sum of contact forces balances the torque and the compatibility of deformations at all potential contact points is satisfied. This leads to a system of equations:
$$ \mathbf{K} \cdot \mathbf{d} + \mathbf{\delta} = \mathbf{g} $$
where $ \mathbf{K} $ is the global stiffness matrix of the gear pair, $ \mathbf{d} $ is the vector of deformations, $ \mathbf{\delta} $ is the vector of measured initial separations (negative for penetrations), and $ \mathbf{g} $ is the geometric constraint vector from the mesh kinematics. Solving this yields:
1. Load Distribution: The normal load $ F_n(s) $ along the contact line(s), where $ s $ is the position along the contact path.
2. Contact Patch Size and Shape: Determined by the points where $ F_n > 0 $.
3. Hertzian Contact Stress: Calculated at each loaded point. For an elliptical contact patch, the maximum subsurface shear stress $ \tau_{max} $ is related to the maximum contact pressure $ p_0 $ by $ \tau_{max} \approx 0.3 p_0 $, where $ p_0 $ is given by:
$$ p_0 = \frac{3F_n}{2\pi a b} $$
Here, $ a $ and $ b $ are the semi-major and semi-minor axes of the contact ellipse, calculated from the local relative curvatures of the measured flanks.
4. Loaded Transmission Error: The kinematic error modified by tooth deflections under load, $ TE_{loaded}(\phi_p) = TE_{kinematic}(\phi_p) + d(\phi_p) $, which is a more accurate predictor of vibratory excitation.
In my simulations, the correlation between the predicted loaded contact pattern from LTCA using measured CMM data and experimental pattern tests under the same torque (e.g., 30 Nm) has been remarkably high, validating the approach.
Prediction of Root Bending Stress and Vibration Excitation
Extending the simulation further, the calculated load distribution $ F_n(s) $ can be applied to a detailed Finite Element Analysis (FEA) model of the gear to predict root bending stress $ \sigma_f $. The process involves mapping the LTCA-derived loads onto the FEA mesh nodes. The stress history at a critical root point over a mesh cycle can be obtained. Comparing these simulated stresses with those from a pure FEA of the nominal geometry and with experimental strain gauge measurements shows strong agreement in trend, though absolute accuracy is affected by factors like residual stresses and the sparse initial measurement data.
Perhaps most critically for noise-sensitive applications, the simulated loaded transmission error $ TE_{loaded}(\phi_p) $ is a direct precursor to vibration. The dynamic mesh force $ F_m(\omega) $ at the gear mesh frequency $ \omega $ and its harmonics can be estimated. If we model the gearbox as a linear system with a frequency response function $ H(\omega) $, the vibration response $ V(\omega) $ is:
$$ V(\omega) = H(\omega) \cdot F_m(\omega) \approx H(\omega) \cdot k_{mesh} \cdot \widehat{TE}_{loaded}(\omega) $$
where $ k_{mesh} $ is the average mesh stiffness and $ \widehat{TE}_{loaded}(\omega) $ is the Fourier transform of the loaded TE waveform. By monitoring how this excitation spectrum changes with simulated progressive wear (modeled as a systematic modification of the measured surface deviations), we can predict the acoustic deterioration of a gear set over its life.
Conclusion
In my professional journey with hypoid gears, the integration of advanced metrology and sophisticated simulation has proven to be a transformative paradigm. Lattice measurement and scanning measurement are not competing but complementary technologies. Scanning provides the holistic, dense data needed for qualitative process control—managing lapping, heat treatment, and visualizing full-field contact. Lattice measurement provides the sparse, high-accuracy data essential for the quantitative, iterative correction of machine settings to converge on an ideal tooth form. The true power, however, is unleashed when this measured data, representing the as-manufactured state of the hypoid gears, drives digital twin simulations. From predicting the unloaded contact path and kinematic error to simulating the loaded contact pressure, root stress, and—most importantly—the dynamic transmission error that governs noise and vibration, these tools enable a predictive, knowledge-driven manufacturing process. This shift from reliance on subjective artistry to objective, data-informed engineering is key to consistently producing high-performance, low-noise hypoid gears that meet the ever-increasing demands of modern automotive and industrial applications. The future lies in closing the loop further, where simulation results directly recommend not just machine setting corrections, but also optimal design modifications for next-generation gear sets.