
1. Introduction
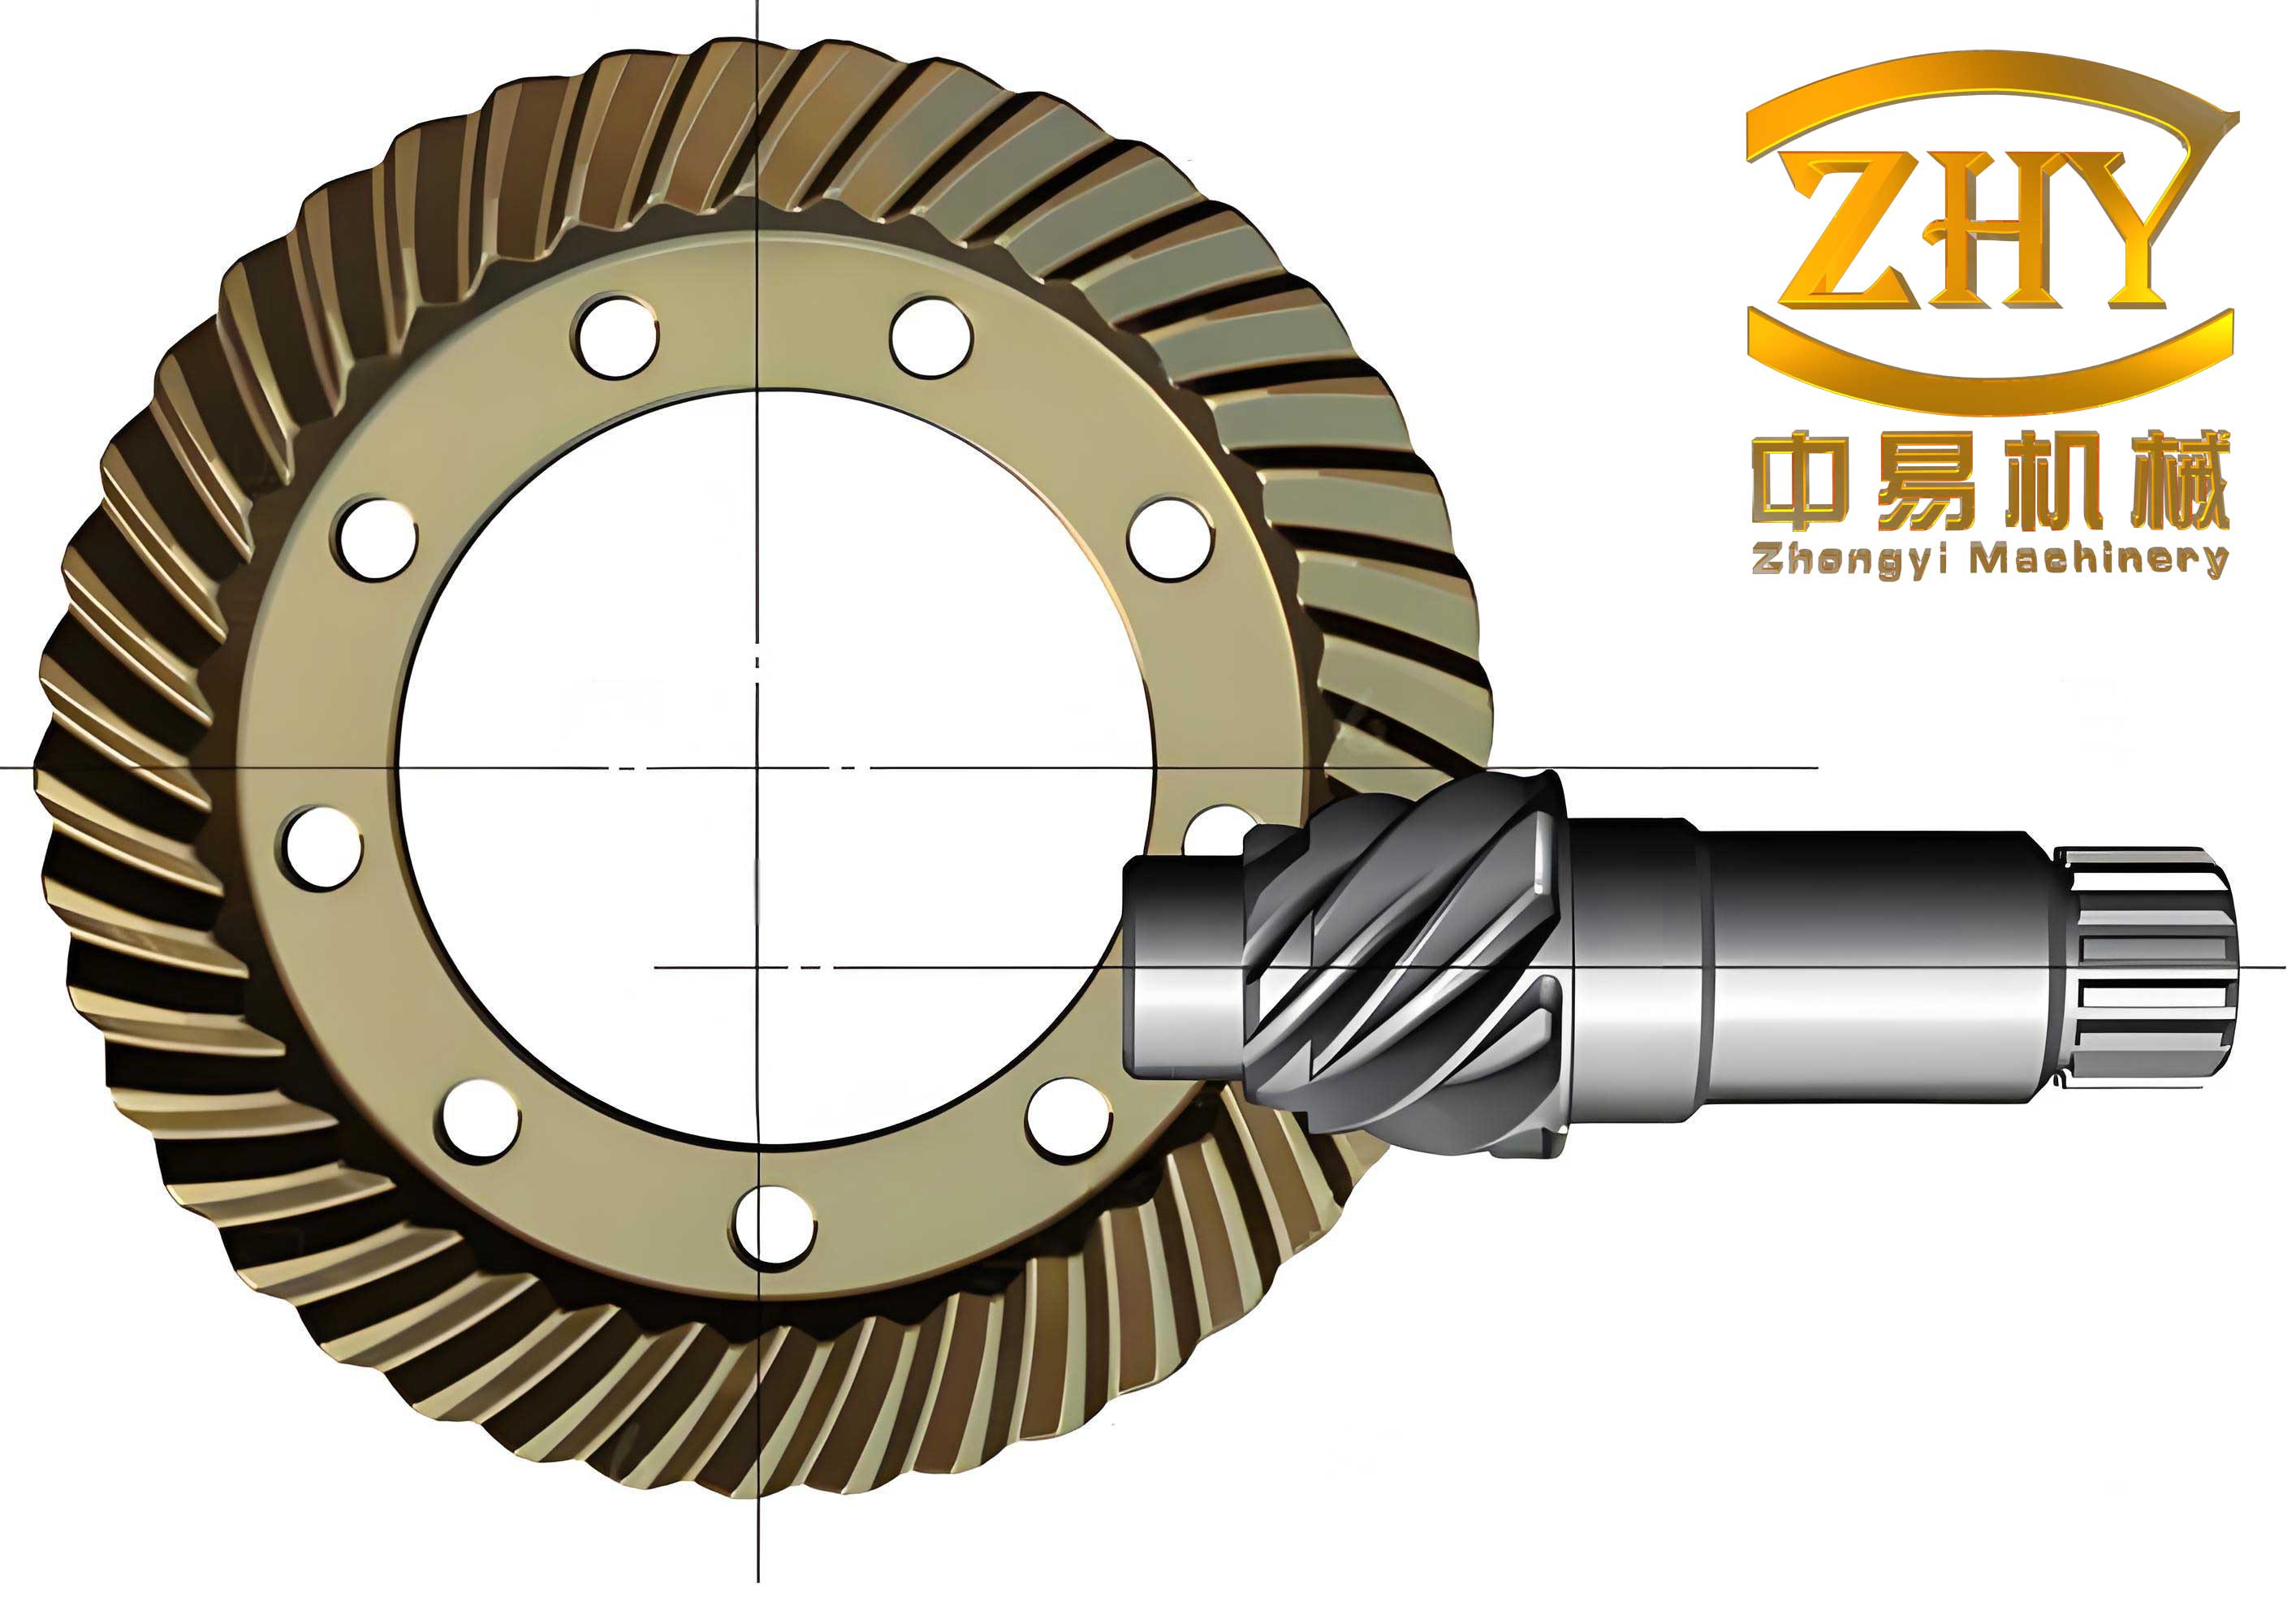
The hypoid gear is a special form of spiral bevel gear that distinguishes itself primarily through the offset of the pinion axis relative to the gear axis. This unique geometric feature enables the transmission of power and motion between staggered axes, which is a critical requirement in many mechanical systems, particularly automotive drivelines. Unlike conventional bevel gears that intersect at a common point, the hypoid gear pair’s pinion offset allows for a larger pinion diameter, thereby increasing the pinion’s stiffness and the overall strength of the gear pair. This characteristic makes hypoid gears particularly suitable for applications involving high rotational speeds and heavy loads, such as the main reducers in rear-wheel-drive vehicles.
The working conditions of hypoid gears are inherently severe. They are often subjected to high-speed rotation, substantial torque loads, and significant sliding velocities between mating tooth surfaces. These conditions give rise to dynamic phenomena such as meshing impact, which can profoundly influence the performance and durability of the gear pair. The unpredictable nature of meshing impact forces can lead to increased vibration, noise, and stress concentrations at critical locations such as the tooth root. Fatigue cracks at the tooth root, which are a primary cause of gear tooth fracture, are directly influenced by the magnitude and distribution of bending stresses at the root fillet under dynamic loading conditions.
The complexity of hypoid gears lies not only in their operational characteristics but also in their geometric design. The three-dimensional (3D) modeling of hypoid gear pairs presents significant challenges compared to standard cylindrical gears due to the intricate spatial configurations of the tooth surfaces. Accurate and efficient 3D models are prerequisites for conducting meaningful finite element analysis (FEA) and dynamic simulations. Therefore, establishing a reliable modeling methodology for hypoid gears is essential for advancing research in this field.
This study aims to comprehensively investigate the meshing impact characteristics of hypoid gears and their influence on tooth root bending stresses and root crack behavior. The work is structured around four primary objectives: (1) to develop a novel and practical approach for establishing a precise 3D model of a hypoid gear set; (2) to systematically analyze the dynamic characteristics of hypoid gears during transmission, with a focus on the factors influencing meshing forces and impact intensity; (3) to investigate the effect of meshing impact on tooth root bending stresses; and (4) to qualitatively assess the implications of increased root stresses on the initiation and propagation of root cracks.
This research provides a foundational framework for understanding the interplay between dynamic meshing conditions and gear tooth fatigue failure, offering valuable insights for the design optimization, manufacturing, and practical application of hypoid gears.
2. Three-Dimensional Modeling of Hypoid Gears
The accurate 3D modeling of hypoid gears is a pivotal step for subsequent simulations and analyses. Traditional methods often rely on complex coordinate transformations and extensive programming, which can be mathematically intensive and computationally demanding. In this research, I propose an integrated modeling strategy that combines the theoretical strength of gear geometry calculations with the practical utility of commercial 3D modeling software. This approach leverages a hybrid methodology
that is both precise and efficient.
2.1 Computation of Gear Blank and Machining Parameters
The initial phase of this modeling methodology involved the calculation of the gear blank dimensions and machining parameters. Given the extensive number of parameters required for hypoid gear design, I developed a custom computational program using MATLAB. This program was based on the Gleason HFT (Hypoid Forming Tilt) calculation format, which provides a standardized procedure for determining the necessary geometric and kinematic parameters for the gear pair.
The calculation begins with the input of basic design specifications, including the number of pinion teeth (z₁ = 9), the number of gear teeth (z₂ = 35), the mean pitch diameter of the gear (d₂ = 171.45 mm), and the pinion offset (E = 44.45 mm). The program outputs a comprehensive list of gear blank dimensions and machine settings. Key parameters derived from the program are summarized in Table 1.
Table 1: Main design parameters of the hypoid gear pair
| Parameter | Symbol | Pinion | Gear |
|:—|:—:|:—:|:—:|
| Number of teeth | z | 9 | 35 |
| Face width (mm) | b | \ | 26.92 |
| Pinion offset (mm) | E | 44.45 | \ |
| Shaft angle (deg) | Σ | 90 | 90 |
| Outer cone distance (mm) | Re | \ | 89.38 |
| Pitch angle (deg) | δ | 18.64° | 73.56° |
| Mean spiral angle (deg) | β | 50.74° | 16.85° |
| Outer diameter (mm) | de | 80.52 | 172.31 |
| Hand of spiral | – | Left | Right |
The gear blank cross-sections were defined by a series of key points. For the gear, these points were derived from the following formulas:
For the gear blank profile (with the origin at the crossing point of the axes), the key coordinates are:
$$
\begin{aligned}
X_1 &= 0, \quad Y_1 = D_2/2, \quad Z_1 = -D_2/2 \cdot \cos(\delta_{a2}) \\
X_2 &= 0, \quad Y_2 = D_2/2 – B_2, \quad Z_2 = Y_2 \cdot \tan(\delta_{a2}) \\
X_3 &= 0, \quad Y_3 = Y_2 – 2h\cos(\delta_2), \quad Z_3 = Y_3/\tan(\delta_{a2}) \\
X_4 &= 0, \quad Y_4 = d_2/2, \quad Z_4 = Z_3 \\
X_5 &= 0, \quad Y_5 = Y_4, \quad Z_5 = Z_6 \\
X_6 &= 0, \quad Y_6 = Y_1 – 2h\cos(\delta_2), \quad Z_6 = Z_1 + 2h\sin(\delta_2)
\end{aligned}
$$
where \(D_2\) is the outer diameter, \(B_2\) is the face width, \(\delta_{a2}\) is the face angle, \(\delta_2\) is the pitch angle, \(h\) is the whole depth, and \(d_2\) is the bore diameter.
The calculated parameters were then used to create the 3D blank models in Pro/E software. The profiles were revolved around their respective axes to form the solid blanks for both the pinion and the gear.
2.2 Modeling of the Gear Based on the HFT Method
The gear was modeled based on the Forming method, a machining process commonly used for gears with large pitch angles. In this method, the gear blank is stationary during cutting, while the rotating cutter head generates the tooth spaces. The cutter head creates a conical envelope surface that corresponds to the tooth flank.
The geometric definition of the cutter blade flank is crucial. The cutting edge is composed of a straight segment and a circular arc segment. The position vector of a point on the straight cutting edge is given by:
$$
\mathbf{r}_s(S_p, \theta_c) = \begin{bmatrix} (r_c + \lambda) \sin\alpha – S_p \cos\alpha \cos\theta_c \\ (r_c + \lambda) \sin\alpha \sin\theta_c \\ S_p \cos\alpha \end{bmatrix}
$$
where \(S_p\) is the distance from the cutting point to the blade tip, \(r_c\) is the cutter radius, \(\alpha\) is the pressure angle, and \(\theta_c\) is the rotation angle of the cutter.
For the circular arc segment, the position vector is:
$$
\mathbf{r}_r(\lambda, \theta_c) = \begin{bmatrix} (r_c + \frac{W}{2} – \rho \frac{1 – \sin\alpha}{\cos\alpha} + \rho \sin\lambda) \cos\theta_c \\ (r_c + \frac{W}{2} – \rho \frac{1 – \sin\alpha}{\cos\alpha} + \rho \sin\lambda) \sin\theta_c \\ \rho (1 – \cos\lambda) \end{bmatrix}
$$
where \(\rho\) is the tip radius and \(\lambda\) is the angular parameter.
To transfer the coordinates of the cutting points from the cutter coordinate system to the workpiece coordinate system, a series of transformations were applied. These transformations account for the machine settings, including the horizontal and vertical cutter offsets, the machine root angle, the sliding base, and the work offset. The overall transformation matrix \(\mathbf{M}_{total}\) is a product of individual transformation matrices:
$$
\mathbf{M}_{total} = \mathbf{M}_{fb} \cdot \mathbf{M}_{fr} \cdot \mathbf{M}_{wf} \cdot \mathbf{M}_{hm} \cdot \mathbf{M}_{vm}
$$
where \(\mathbf{M}_{vm}\) represents the vertical cutter offset, \(\mathbf{M}_{hm}\) the horizontal cutter offset, \(\mathbf{M}_{wf}\) the work offset, \(\mathbf{M}_{fr}\) the machine root angle rotation, and \(\mathbf{M}_{fb}\) the sliding base translation.
By applying this transformation to the discrete points on the cutter blade, I obtain the coordinates of the gear tooth surface points. These coordinates were exported as an IGES file for use in Pro/E. In Pro/E, the point cloud data was used to construct the tooth space geometry via boundary blending. The tooth space solid was then used to cut the gear blank, and this cut feature was arrayed to create the full gear model.
2.3 Modeling of the Pinion via Boolean Operation
The most innovative aspect of my modeling methodology lies in the creation of the pinion gear. Rather than performing complex analytical computations for the pinion tooth surfaces directly, I employed a method based on the Boolean subtraction operations available in 3D modeling software such as UG. The principle is conceptually similar to the actual gear generation process.
For this method, a ‘tool gear’ was required, which was derived from the standard gear model by applying certain modifications for tip clearance, backlash, and a contact pattern correction. The tooth surface modification was based on the following formula for the required curvature difference:
$$
\Delta\kappa = \frac{0.0508}{l^2}
$$
where \(l\) is the half-length of the desired contact pattern.
The pinion blank and the tool gear were assembled in UG with the correct spatial orientation, mimicking their meshing position. A series of Boolean subtraction operations were then performed. After each subtraction, the tool gear was rotated by an incremental angular step (\(2^\circ\)), and correspondingly, the pinion blank was rotated by an amount proportional to the transmission ratio. This stepping process was repeated until a complete tooth slot was generated on the pinion blank. The resulting fragmented surfaces from the multiple subtraction steps were then stitched together and smoothed to create a continuous and accurate tooth slot. The completed pinion model was created by applying this tooth slot feature to the pinion blank and subsequently arraying it.
The final assembled hypoid gear pair from this hybrid modeling process is shown in the figure below. The model was validated by checking for assembly interference and later through dynamic simulation.
3. Dynamic Simulation of the Hypoid Gear Pair
3.1 Model Setup in ADAMS
To investigate the dynamic characteristics of the hypoid gear pair, I used the ADAMS software environment. The 3D model, created in UG, was exported in Parasolid format (.x_t) and imported into ADAMS. Within ADAMS, the pinion and gear were defined as rigid bodies, and their relative motion was constrained by applying rotational joints to each component, anchoring them to the ground. The pinion was driven by a motion defined using a step function to control its angular velocity, while a constant resisting torque of 90 N·m was applied to the gear to simulate load conditions. Contact conditions between the tooth surfaces were defined using the impact function, with a stiffness coefficient of \(1.48 \times 10^6\) N/mm, a force exponent of 1.5, a damping coefficient of 10 N·s/mm, and a penetration depth of 0.1 mm. A dynamic simulation was then carried out.
3.2 Transmission Stability Analysis
The dynamic simulation results revealed important characteristics of the gear pair’s transmission stability. The angular velocity of the gear was observed to fluctuate around its theoretical value. This fluctuation is directly attributed to the instantaneous transmission ratio inherent in gear meshing. The theoretical angular velocity of the gear, \(\omega_2\), is given by:
$$
\omega_2 = \omega_1 \times \frac{z_1}{z_2}
$$
With \(\omega_1 = 3500\) deg/s, the theoretical \(\omega_2\) is 900 deg/s. The Root Mean Square (RMS) value of the simulated gear velocity was 899.86 deg/s, with a minimum of 864.89 deg/s and a maximum of 914.96 deg/s. This demonstrates a high level of transmission stability.
The angular acceleration of the gear also showed a periodic fluctuating pattern around zero. The period of these fluctuations was found to be 0.01144 s, which aligns well with the theoretical meshing period, calculated as:
$$
t_p = \frac{2\pi}{z_i \omega_i}
$$
yielding \(t_p = 0.01143\) s. This confirms the fidelity of the simulation to real-world gear dynamics. A major anomaly was observed in the gear angular velocity, appearing twice per revolution of the gear. This was attributed to an accumulated error in the gear model’s arrayed tooth feature, a minor issue stemming from the 3D modeling procedure.
3.3 Analysis of Meshing Force Characteristics
The meshing force generated during the gear pair’s operation was a key focus of this research. The simulation results showed the meshing force in three orthogonal directions: x, y, and z. It was found that the z-component of the meshing force was the largest, followed by the y-component, with the x-component being relatively small. The mean values of the y and z components were -727.47 N and -909.18 N, respectively. The ratio of these forces was approximately 1.25, which is close to the theoretical value \(\tan(50.74^\circ) = 1.22\) intended for the mean spiral angle, confirming the accuracy of the simulation.
4. Influence Factors on Meshing Contact Forces
The meshing impact behavior of hypoid gears is influenced by a variety of operational factors. I conducted a systematic parametric study to isolate the effects of friction, rotational speed, and applied load on the meshing contact forces. The primary metrics for analysis were the mean value and the Root Mean Square (RMS) of the contact force. The difference between the RMS and the mean value was used as an indicator of the intensity of the meshing impact fluctuations.
4.1 Influence of the Coefficient of Friction
In this set of simulations, the coefficient of friction was varied from 0.05 to 0.30, while the pinion speed and gear load were held constant. The results, presented in Figure, show that as the coefficient of friction increases, both the mean value and the RMS of the meshing force decrease gradually in a roughly linear fashion. However, the difference between these two parameters remains nearly constant. This indicates that friction primarily affects the average level of the meshing force, but it does not significantly alter the amplitude of the dynamic fluctuations, hence having a negligible impact on the intensity of the meshing impact.
4.2 Influence of Rotation Speed
The sensitivity of meshing forces to the pinion’s rotational speed was investigated at speeds of 12000, 15000, 18000, 21000, 24000, and 27000 deg/s. The simulation results showed that as the speed increases, the mean value of the contact force increases only slightly. In contrast, the RMS increases significantly in a linear fashion. Consequently, the gap between the RMS and the mean value widens, signifying a substantial growth in the amplitude of force fluctuations. This indicates that the intensity of the meshing impact increases more dramatically at higher speeds, even though the average transmitted torque remains constant.
4.3 Influence of Load
The effect of load on meshing forces was studied by varying the applied torque on the gear from 30 N·m to 180 N·m. With increasing load, both the mean and the RMS of the meshing force increase linearly. However, the growth rate is more pronounced for the mean value than for the RMS. As a result, the difference between the two reduces as the load increases. This result reveals that while higher loads lead to larger meshing forces, they conversely lead to a lower intensity of meshing impact, i.e., the relative fluctuation amplitude is dampened.
4.4 Transient Impact Analysis
A specific investigation was carried out on the phenomenon of instantaneous impact, which is the shock that occurs when the pinion’s rotational speed changes abruptly. I simulated the extreme condition where the pinion speed instantly jumps from 0 to a constant value. The peak contact force during this transient event was found to be significantly higher than that during smooth operation. The peak force exhibited a linear increase with the magnitude of the instantaneous speed change. At an immediate speed of 10000 deg/s, the peak force was observed to be 28 times higher than the average meshing force under steady-state conditions. This highlights the critical importance of avoiding sudden speed changes to prevent damage to the gear teeth.
5. Influence of Meshing Impact on Tooth Root Bending Stress
5.1 Static Finite Element Analysis
To establish a baseline for comparison, I conducted a static structural analysis of the gear pair using ANSYS. The finite element model was created by importing the 3D solid model into Hypermesh for high-quality mesh generation and then importing it into ANSYS for the analysis. Boundary conditions were applied by fully constraining the pinion and allowing the gear to rotate only around its axis. A torque of 90 N·m was applied to the gear. The analysis resulted in a maximum tooth root bending stress for the pinion of \(\sigma_{F1} = 31.72\) MPa. This static value served as a reference point for evaluating the effects of dynamic loading.
5.2 Dynamic Bending Stress Calculation
The dynamic tooth root bending stress was calculated based on the effective torque experienced by the pinion during dynamic operation. The effective torque, \(T’_1\), was determined from dynamic simulations in ADAMS. The bending stress was then calculated using the standard gear bending stress formula recommended by Gleason:
$$
\sigma_{F1} = 2000 \cdot T_1 \cdot K_A \cdot K_v \cdot K_{FB} \cdot K_X / (m_{et} \cdot b \cdot d \cdot J’)
$$
where \(T_1\) is the pinion torque, \(K_A\) is the application factor, \(K_v\) is the dynamic factor, \(K_{FB}\) is the load distribution factor, \(K_X\) is the size factor, \(m_{et}\) is the transverse module, \(b\) is the face width, \(d\) is the pitch diameter, and \(J’\) is the geometric factor. By substituting \(T’_1\) for \(T_1\) in this formula, we can estimate the dynamic root stress. At an input speed of 6000 deg/s, the effective torque on the pinion was found to be 28.40 N·m, resulting in a dynamic bending stress of \(\sigma’_{F1} = 37.74\) MPa. This represents a 19% increase over the static value, directly demonstrating a significant contribution of dynamic effects.
5.3 Correlation between Meshing Impact and Root Stress Fluctuation
To further investigate the impact of speed on tooth root stress, I conducted dynamic simulations at various pinion speeds. The results detailed in Table 2 show a clear escalation in the effective torque and, consequently, the dynamic bending stress as the pinion speed increases.
Table 2: Effect of pinion speed on effective torque and dynamic bending stress
| Pinion Speed (deg/s) | Effective Torque \(T’_1\) (N·m) | Dynamic Bending Stress \(\sigma’_{F1}\) (MPa) | Percentage Increase over Static (\(\Delta\sigma\)) |
|:—:|:—:|:—:|:—:|
| 3000 | 27.10 | 35.99 | 13.5% |
| 6000 | 28.40 | 37.74 | 19.0% |
| 9000 | 29.50 | 39.22 | 23.6% |
| 12000 | 31.80 | 42.27 | 33.3% |
| 15000 | 36.20 | 48.11 | 51.7% |
| 16000 | 38.00 | 50.49 | 58.8% |
The results show that the gap between dynamic and static stresses grows rapidly with speed. In the speed range studied, the dynamic bending stress was observed to increase by up to 59% compared to the static counterpart. These observations lead to the conclusion that meshing impact, especially at high speeds, is a critical factor that exacerbates the stress concentration at the tooth root and must be considered in design and analysis. The percentage increase in the dynamic bending stress over the static can be expressed as a function of the pinion speed \(n_1\) (in rpm) using a best-fit relation:
$$
\Delta\sigma(n_1)\% = k_1 \cdot n_1 + c_1
$$
where \(k_1\) and \(c_1\) are empirical constants obtained from the simulation data. From our results, \(c_1 \approx 5.31\) and \(k_1 \approx 0.00336\), valid for the studied speed range.
5.4 Impact on Tooth Root Cracks
The elevated tooth root bending stresses resulting from meshing impact have a direct and significant influence on the fatigue life of the gear teeth. In fracture mechanics, the stress intensity factor (SIF) \(K_I\) at the root crack tip is typically proportional to the tensile stress as follows:
$$
K_I = \alpha_1 \cdot \sigma \cdot \sqrt{\pi a}
$$
where \(\sigma\) is the applied stress, \(a\) is the crack length, and \(\alpha_1\) is a correction factor. Given that \(K_I\) is a function of the applied stress, the high dynamic stresses induced by meshing impact (which can be double the static values) also proportionally increase the SIF. This accelerated crack growth rate significantly reduces the number of load cycles required for a crack to propagate from an initial flaw to final fracture. The periodic nature of the meshing impact, with a frequency corresponding to the gear mesh frequency, imposes a cyclic fatigue loading condition on the tooth root, making the hypoid gear particularly susceptible to root cracks.
The qualitative relationship between the meshing impact-induced stress range \(\Delta\sigma\) and the fatigue crack growth rate can be described by the Paris-Erdogan law:
$$
\frac{da}{dN} = C (\Delta K_I)^m
$$
where \(\Delta K_I\) is the range of the stress intensity factor range during a cycle, and \(C\) and \(m\) are material constants. Since \(\Delta K_I\) is directly proportional to \(\Delta\sigma\), it follows from the simulation results that the crack growth rate will be substantially higher under conditions of significant meshing impact. Therefore, the management and mitigation of meshing impact are essential for ensuring the durability and reliability of hypoid gears.
6. Software Implementation and Parameter Table
Throughout this research, I made extensive use of MATLAB for the calculation of gear blank dimensions and machining parameters. A key component of the implementation was the generation of an Excel file containing a comprehensive set of gear parameters. The generated table includes both the calculated design values and, in some cases, the selected standard values from design charts. The file structure is organized into a spreadsheet, where each column corresponds to a specific parameter type (e.g., symbol, pinion value, gear value). An illustrative excerpt of the table is displayed in Table 3 below, demonstrating the type of output used for the modeling process.
Table 3: Sample of the calculated gear parameters output file
| Parameter Description | Symbol | Pinion Value | Gear Value |
|:—|:—:|:—:|:—:|
| Number of Teeth | z | 9 | 35 |
| Shaft Angle (deg) | Σ | 90 | 90 |
| Pitch Angle (deg) | δ | 18.6388 | 73.5552 |
| Face Angle (deg) | \(\delta_a\) | 18.6388 | 74.5321 |
| Root Angle (deg) | \(\delta_f\) | 12.8495 | 67.8862 |
| Spiral Angle (deg) | β | 50.7440 | 16.8506 |
| Pressure Angle (deg) | α | 8.6441 / -29.3559 | \ |
| Tooth Height (mm) | h | 5.2032 | 8.8194 |
| Cutter Radius (mm) | rc | \ | 95.25 |
| Blade Edge Width (mm) | W | \ | 2.71 |
| Gear Face Width (mm) | b | \ | 26.92 |
| Pinion Offset (mm) | E | 44.45 | \ |
The table in this format allowed me to easily verify and cross-reference data, which was instrumental in ensuring the correctness of the 3D model and subsequent simulation steps.
7. Conclusion
This research provides a comprehensive investigation into the meshing impact of hypoid gears and its consequential effects on tooth root bending stress and the potential for root crack formation. The primary contributions and findings are summarized as follows:
1. Development of a Hybrid 3D Modeling Methodology: An effective and efficient hybrid approach for creating a precise 3D model of a hypoid gear set was successfully implemented. This was achieved by combining MATLAB-based calculations for gear geometry and machining parameters with the use of Pro/E for gear modeling and UG’s Boolean operations for pinion modeling. The resulting model was validated by dynamic simulation, demonstrating a high degree of transmission stability. This method successfully overcomes the traditional barriers of complex analytical modeling and can be effectively used as a basis for future FEA and dynamic analyses.
2. Dynamic Characteristics and Force Analysis: Through dynamic simulation in ADAMS, the fluctuating nature of the gear’s angular velocity and the periodic characteristics of its angular acceleration, which are attributed to the instantaneous transmission ratio of the meshing process, were confirmed. The meshing forces were found to be largest in the axial (z) direction, followed by the tangential (y) direction.
3. Influence Factors of Meshing Impact: The parametric study on friction, speed, and load revealed distinct influences on meshing impact intensity. Friction was found to have a negligible effect on the amplitude of force fluctuations. In contrast, the meshing impact intensity was found to be highly sensitive to the rotational speed, with higher speeds leading to significantly large force oscillations. On the other hand, the relative intensity of the meshing impact decreased with increasing applied loads, despite the overall contact force magnitude growing. Further, transient analysis of instantaneous speed changes demonstrated the generation of extremely high peak forces, up to 28 times the steady-state average, underlining the importance of controlling speed changes in practical applications.
4. Impact on Root Bending Stress: The investigation into root bending stresses showed a clear and significant impact of meshing impact. The dynamic bending stress values were consistently higher than those from static contact, with the gap widening at higher speeds. In my simulations, the dynamic stress was up to 59% higher than the static stress within the speed range studied, with a linear trend of increase. This elevation of stress is equivalent to an increase in the stress intensity factor for any pre-existing crack, accelerating the fatigue crack growth rate.
The findings from this research underscore the critical role that meshing impact plays in the stress environment of hypoid gear tooth roots. This study recommends that in high-speed applications, the dynamic component of the stress must be taken into account for accurate fatigue life prediction and design, as the standard static calculations may significantly underestimate the operational loads on the gear teeth. The methodologies and insights presented here provide a solid foundation for further studies on gear optimization, vibration analysis, and more detailed crack propagation modeling.