
In rotating machinery, gear transmission systems are fundamental components, and their health directly impacts the overall reliability and operational safety of the equipment. Among these, the spur and pinion pair is one of the most common forms of transmission due to its simple structure and high transmission efficiency. Understanding the dynamic behavior of such systems under both healthy and faulty conditions is paramount for predictive maintenance and fault diagnosis. However, conducting physical experiments to simulate various gear failure types and severities is often prohibitively expensive and technically challenging. This article addresses this issue by developing a refined dynamic model for spur and pinion systems that incorporates different fault types. A lumped-parameter approach is employed to construct a bending-torsion coupled vibration model. The time-varying mesh stiffness, a primary source of excitation, is calculated using the potential energy method, accounting for the influence of different failure modes such as cracks and pitting. Subsequently, a system model modification technique is applied to calibrate key parameters, ensuring the simulation model closely aligns with a physical test rig. Numerical examples from the modified model reveal the characteristic time-domain and frequency-domain responses associated with different fault types and severities. Finally, analysis of experimental vibration signals validates the accuracy of the proposed faulty spur gear dynamic model. The results demonstrate that this model can effectively simulate and identify multiple gear failure types, thereby providing valuable data support for building comprehensive fault diagnosis databases for spur and pinion systems.
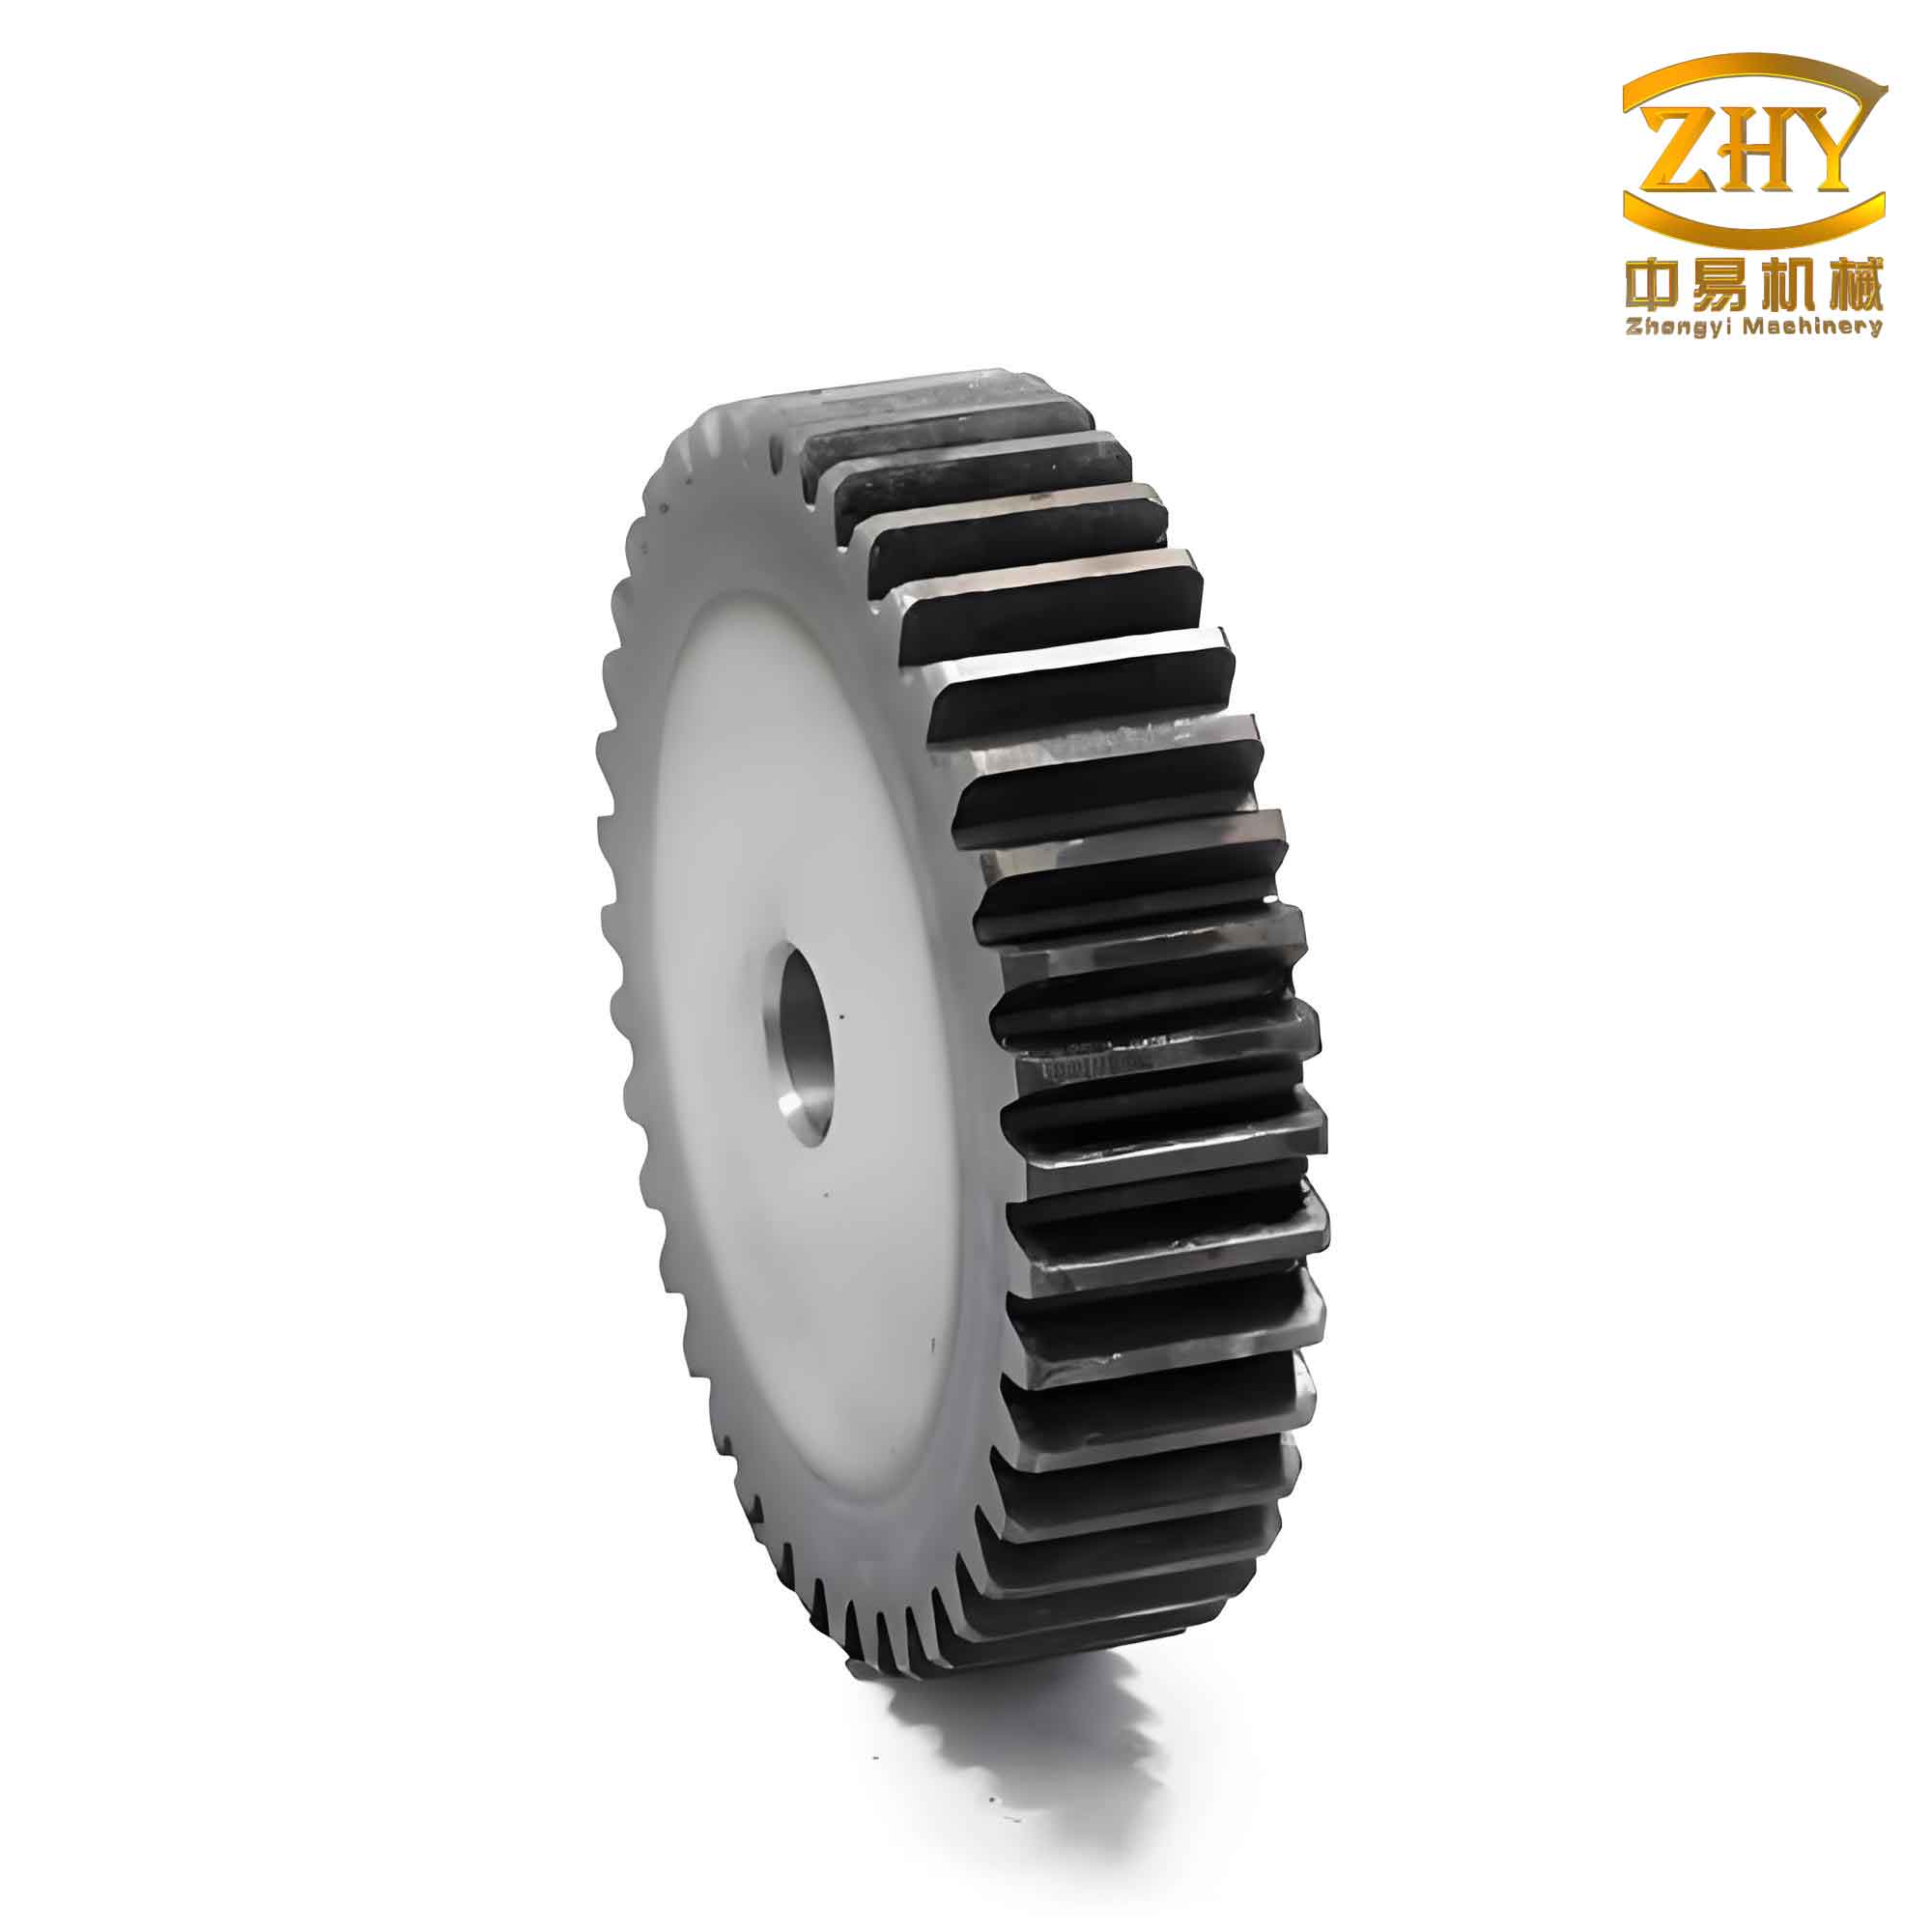
1. Dynamic Vibration Analysis Model for Spur and Pinion Systems
To accurately capture the complex interactions within a gear pair, a lumped-parameter method is used to establish a six-degree-of-freedom (6-DOF) planar vibration model. This model considers the flexibility of the shafts and support bearings, as well as the friction on the gear tooth flank, leading to a coupled translational-torsional system. The model comprises four translational degrees of freedom and two rotational degrees of freedom, as conceptually represented in the figure.
The generalized displacement vector for the system is defined as:
$$ \{\delta\} = \{x_p, y_p, \theta_p, x_g, y_g, \theta_g\}^T $$
where \(x_p, y_p\) and \(x_g, y_g\) are the translational displacements of the pinion and gear along the x and y axes, respectively, and \(\theta_p, \theta_g\) are their torsional displacements. The relative displacement along the line of action \(y\) is a key parameter:
$$ y = y_p + R_{bp}\theta_p – y_g + R_{bg}\theta_g $$
Here, \(R_{bp}\) and \(R_{bg}\) are the base circle radii of the pinion and gear. The dynamic meshing force \(F_p\) acting on the pinion and the reaction force \(F_g\) on the gear are then:
$$ F_p = c_m \dot{y} + k_m y $$
$$ F_g = -F_p = -c_m \dot{y} – k_m y $$
where \(k_m(t)\) is the time-varying mesh stiffness of the spur and pinion pair and \(c_m\) is the mesh damping. The tooth flank friction force \(F_f\) can be approximated as \(F_f = f F_p\), where \(f\) is an equivalent friction coefficient. Applying Newton’s second law, the equations of motion for the pinion and gear are derived:
| Pinion Equations | Gear Equations |
|---|---|
| \(m_p \ddot{x}_p + c_{px} \dot{x}_p + k_{px} x_p = F_f\) | \(m_g \ddot{x}_g + c_{gx} \dot{x}_g + k_{gx} x_g = -F_f\) |
| \(m_p \ddot{y}_p + c_{py} \dot{y}_p + k_{py} y_p = F_g\) | \(m_g \ddot{y}_g + c_{gy} \dot{y}_g + k_{gy} y_g = -F_g\) |
| \(I_p \ddot{\theta}_p = T_p – F_p R_{bp} + F_f (R_{bp} \tan \beta – H)\) | \(I_g \ddot{\theta}_g = -T_g – F_g R_{bg} + F_f (R_{bg} \tan \beta – H)\) |
In these equations, \(m, I\) represent mass and mass moment of inertia; \(k_{px}, k_{py}, k_{gx}, k_{gy}\) are the supporting stiffnesses in x and y directions; \(c_{px}, c_{py}, c_{gx}, c_{gy}\) are the corresponding supporting dampings; \(T_p, T_g\) are the external torque loads; \(\beta\) is the pressure angle; and \(H\) is the distance from the contact point to the pitch point. These equations can be compactly written in matrix form as:
$$ \mathbf{M} \ddot{\{\delta\}} + \mathbf{C} \dot{\{\delta\}} + \mathbf{K} \{\delta\} = \{\mathbf{F}\} $$
where \(\mathbf{M}\), \(\mathbf{C}\), and \(\mathbf{K}\) are the mass, damping, and stiffness matrices, respectively, and \(\{\mathbf{F}\}\) is the force vector. Solving this system of equations using numerical integration methods (e.g., Runge-Kutta) yields the dynamic response of the spur and pinion system.
2. Calculation of Time-Varying Mesh Stiffness
2.1 Mesh Stiffness for Healthy Spur and Pinion
The time-varying mesh stiffness \(k_m(t)\) is a crucial internal excitation in gear dynamics. The potential energy method provides a precise analytical approach for its calculation. The total elastic potential energy stored in a meshing tooth includes contributions from bending (\(U_b\)), shear (\(U_s\)), axial compression (\(U_a\)), Hertzian contact (\(U_h\)), and fillet foundation deflection (\(U_f\)):
$$ U_{total} = U_b + U_s + U_a + U_h + U_f = \frac{F^2}{2} \left( \frac{1}{K_b} + \frac{1}{K_s} + \frac{1}{K_a} + \frac{1}{K_h} + \frac{1}{K_f} \right) $$
Therefore, the comprehensive stiffness for a single tooth pair at a given contact point is the harmonic sum of these components:
$$ \frac{1}{K_{single}} = \frac{1}{K_b} + \frac{1}{K_s} + \frac{1}{K_a} + \frac{1}{K_h} + \frac{1}{K_f} $$
The individual stiffness components are calculated using integrals along the tooth profile. For a spur gear tooth loaded at an angle \(\alpha_p\) relative to the tooth centerline, with a distance \(l\) from the load point to the root, the formulas are:
Bending Stiffness \(K_b\):
$$ \frac{1}{K_b} = \int_{0}^{l} \frac{[(l-x)\cos\alpha_p – h\sin\alpha_p]^2}{E I_x} dx $$
Shear Stiffness \(K_s\):
$$ \frac{1}{K_s} = \int_{0}^{l} \frac{1.2 \cos^2\alpha_p}{G A_x} dx $$
Axial Compressive Stiffness \(K_a\):
$$ \frac{1}{K_a} = \int_{0}^{l} \frac{\sin^2\alpha_p}{E A_x} dx $$
Hertzian Contact Stiffness \(K_h\):
$$ \frac{1}{K_h} = \frac{4(1-\nu^2)}{\pi E W} $$
Fillet Foundation Stiffness \(K_f\):
$$ \frac{1}{K_f} = \frac{\cos^2\alpha_p}{WE} \left\{ L^*\left(\frac{u_f}{s_f}\right)^2 + M^*\left(\frac{u_f}{s_f}\right) + P^*(1+Q^*\tan^2\alpha_p) \right\} $$
Where \(E\) is Young’s modulus, \(G\) is the shear modulus, \(\nu\) is Poisson’s ratio, \(W\) is the face width, \(I_x\) and \(A_x\) are the area moment of inertia and cross-sectional area at a distance \(x\) from the root, respectively. The parameters \(L^*, M^*, P^*, Q^*\) for foundation stiffness are obtained from literature. The total mesh stiffness for the spur and pinion pair at any time \(t\) is the sum of the stiffnesses of all tooth pairs in simultaneous contact:
$$ k_m(t) = \sum_{i=1}^{N} K_{single}^i(t) $$
where \(N\) is the number of tooth pairs in contact (1 or 2 for spur gears).
2.2 Mesh Stiffness for a Spur and Pinion with Root Crack
A common failure mode in spur gears, especially in the pinion which is often subjected to higher cyclic stresses, is a root crack. This crack is modeled as a straight line originating from the root fillet, characterized by its depth \(q_0\), angle \(\alpha_c\), and starting position \(h_c\). The presence of the crack reduces the effective area moment of inertia \(I_x\) and cross-sectional area \(A_x\) of the tooth beyond the crack tip. If \(h_q = h_c – q_0 \sin\alpha_c\) denotes the height of the cracked section, the effective properties become:
$$ I_x = \begin{cases}
\frac{1}{12}(h_x + h_x)^3W & h_x \le h_q \\
\frac{1}{12}(h_x + h_q)^3W & h_x > h_q
\end{cases} $$
$$ A_x = \begin{cases}
(h_x + h_x)W & h_x \le h_q \\
(h_x + h_q)W & h_x > h_q
\end{cases} $$
Substituting these modified \(I_x\) and \(A_x\) into the integrals for \(K_b\), \(K_s\), and \(K_a\) yields the reduced stiffness for the cracked tooth. The foundation stiffness \(K_f\) and contact stiffness \(K_h\) are assumed unaffected by the crack.
2.3 Mesh Stiffness for a Spur and Pinion with Pitting
Pitting is a surface fatigue failure resulting in small pits, often near the pitch line. A pit is modeled as a rectangular cavity with length \(a_s\), width \(w_s\), and depth \(h_s\). When the contact point traverses the pitted region, the effective face width \(W_x’\), area \(A_x’\), and moment of inertia \(I_x’\) are reduced. Defining \(\mu\) as the distance from the root to the pit’s center, the reductions are:
$$ \Delta W_x = \begin{cases}
w_s & x \in [\mu – a_s/2, \mu + a_s/2] \\
0 & \text{otherwise}
\end{cases} $$
$$ A’_x = A_x – \Delta A_x, \quad \text{where } \Delta A_x = \Delta W_x \cdot h $$
$$ I’_x = I_x – \Delta I_x, \quad \text{where } \Delta I_x = \frac{1}{12}\Delta W_x h^3 + \frac{A_x \Delta A_x (h_x – h/2)^2}{A_x – \Delta A_x} \text{ for } x \text{ in pit range} $$
The modified properties \(A’_x\), \(I’_x\), and \(W’_x = W – \Delta W_x\) are used to calculate the tooth bending, shear, axial, and foundation stiffnesses. The Hertzian contact stiffness \(K_h\) also uses the reduced face width \(W’_x\) when the contact is within the pitted area.
3. Numerical Simulation Analysis
To demonstrate the model’s capability, a numerical case study of a spur and pinion gearbox is performed. The primary parameters are listed in the table below. The pinion is the driver, rotating at 1800 RPM (30 Hz). Faults are introduced only on the pinion, as it is more susceptible to failure under high-speed conditions.
| Parameter | Pinion | Gear |
|---|---|---|
| Number of Teeth | 23 | 84 |
| Module (mm) | 2 | 2 |
| Pressure Angle (°) | 20 | 20 |
| Face Width (mm) | 20 | 20 |
| Mass (kg) | 0.22 | 1.9 |
| Moment of Inertia (kg·m²) | 4.86e-5 | 3.51e-3 |
The time-varying mesh stiffness for a healthy spur and pinion pair shows a characteristic rectangular pattern, alternating between high stiffness during single-tooth contact and lower stiffness during double-tooth contact, with perfectly repeating periods.
3.1 Stiffness under Crack Fault
A root crack with an angle \(\alpha_c = 45^\circ\) and varying depths \(q = 1, 1.5, 2\) mm was simulated. The results show a significant reduction in mesh stiffness, particularly when the cracked tooth is in the load-bearing zone. The degradation becomes more pronounced with increasing crack depth, as the effective tooth cross-section is further weakened.
3.2 Stiffness under Pitting Fault
Pitting on the pinion’s pitch line was simulated with a depth \(h_s=1\) mm, width \(w_s=4\) mm, and varying lengths \(a_s = 0.5, 0.7, 0.9\) mm. Additionally, pitting with fixed length \(a_s=0.5\) mm but varying width percentages (20%, 40%, 60% of face width) was analyzed. The results indicate that both increasing pit length and width cause a local dip in the mesh stiffness curve during the period when the pitted surface is in contact. The reduction is more sensitive to pit width, as it directly reduces the effective contact area.
3.3 Vibration Response of Faulty Spur and Pinion
The calculated faulty stiffness functions are incorporated into the 6-DOF dynamic model. The dynamic responses in the direction of the line of action are compared. The healthy spur and pinion system shows a steady vibration amplitude. In contrast, systems with crack or pitting faults exhibit increased vibration amplitudes and modulated waveforms. The crack fault introduces a distinct periodic impulse corresponding to the pinion’s rotation frequency, while pitting causes a more subtle, repeated disturbance within each mesh cycle.
4. System Model Modification and Experimental Validation
4.1 Model Modification via Parameter Identification
In practice, vibration signals are measured on the gearbox housing, not directly on the rotating spur and pinion. Therefore, the dynamics of the signal transmission path, primarily governed by the support stiffness and damping at the bearings, must be accurately represented. An impact hammer test is conducted on the experimental gearbox to obtain measured Frequency Response Functions (FRFs). The connection between the shaft and housing is modeled as a coupled stiffness-damping system in horizontal (x) and vertical (y) directions, characterized by parameters \(k_{ij}\) and \(c_{ij}\).
The theoretical FRFs \(R_{ij}(\omega)_s\) from this support model are functions of these unknown parameters. A model modification process is employed: an optimization algorithm iteratively adjusts the parameters \(k_{ij}\) and \(c_{ij}\) to minimize the difference between the simulated FRFs \(R_{ij}(\omega)_s\) and the experimentally measured FRFs \(R_{ij}(\omega)_e\). The objective function is:
$$ \epsilon = \min \sum_{i=x,y} \sum_{j=x,y} \sum_{\omega} | R_{ij}(\omega)_s – R_{ij}(\omega)_e | $$
The identified support parameters (\(k_{px}, k_{py}, c_{px}, c_{py}\)) are then used in the full 6-DOF spur and pinion dynamic model, ensuring the simulated housing vibration matches the physical system’s characteristics.
4.2 Experimental Setup and Signal Comparison
A gearbox test rig was constructed, and spur gears with seeded cracks and pitting faults were manufactured according to Table 1. Vibration acceleration signals in the radial (Y) direction were acquired at a sampling rate of 51,200 Hz. The raw signals were processed using Time Synchronous Averaging (TSA) to enhance the gear-related components and reduce noise. The simulated signals from the modified dynamic model were compared with the processed experimental signals.
| Gear State | Key Time-Domain Features | Key Frequency-Domain Features | Agreement |
|---|---|---|---|
| Healthy | Steady amplitude, no strong impulses. | Dominant mesh frequency \(f_m\) and harmonics. Shaft frequency \(f_r\) present. No significant sidebands. | Excellent. Both show characteristic healthy signal patterns. |
| Crack Fault | Clear periodic impulses at the pinion’s rotational period (~0.034 s). | Mesh harmonics (\(2f_m, 3f_m\)) are prominent. Sidebands spaced at \(f_r\) appear around mesh harmonics, indicating modulation. | Very Good. Both show impact period and modulated sideband structure. |
| Pitting Fault | Minor amplitude modulation within each rotation cycle, period ~0.035 s. | Mesh harmonics are dominant. Low-amplitude sidebands at \(f_r\) are present but less pronounced than for cracks. | Good. Both show subtle modulation effects consistent with distributed surface damage. |
The close agreement between the simulated and experimental signals in both time and frequency domains validates the accuracy of the proposed dynamic modeling approach for the spur and pinion system with faults.
4.3 Database Generation for Different Fault Severities
With the validated model, it is now possible to simulate a wide range of fault severities that are difficult or costly to replicate physically. For instance, crack depths from incipient (0.5 mm) to severe (3 mm) can be modeled. Similarly, pitting can be varied in size, density, and location. The table below summarizes example outputs from such a simulation database, highlighting how key vibration indicators evolve with fault progression.
| Fault Type | Severity Level | RMS Increase (%) | Kurtosis Value | Dominant Sideband Amplitude (dB) |
|---|---|---|---|---|
| Root Crack | Minor (q=0.5mm) | 15 | 4.2 | -35 |
| Moderate (q=1.5mm) | 45 | 7.8 | -28 | |
| Severe (q=3.0mm) | 120 | 15.3 | -22 | |
| Pitting | Light (5% area) | 8 | 3.5 | -40 |
| Moderate (15% area) | 22 | 4.1 | -36 | |
| Heavy (30% area) | 55 | 5.5 | -31 |
This simulated database provides a rich source of labeled data for developing and training data-driven fault diagnosis algorithms for spur and pinion systems, addressing the challenge of insufficient real-world fault data.
5. Conclusion
This article has presented a comprehensive methodology for the dynamic modeling, modification, and fault analysis of spur and pinion systems. A refined lumped-parameter model incorporating time-varying mesh stiffness calculated via the potential energy method effectively captures the dynamics of both healthy and faulty gears. The model successfully quantifies the stiffness reduction caused by tooth root cracks and surface pitting. A crucial step of experimental model modification was implemented to calibrate support parameters, ensuring high fidelity between simulation and physical test rig responses. The validation through experimental vibration signals confirmed the model’s accuracy in replicating the characteristic time-domain and frequency-domain signatures of different fault types in a spur and pinion pair.
The primary contributions and findings are:
- The integrated model provides a cost-effective and flexible platform for simulating various fault types and severities in spur and pinion gears, overcoming the limitations of physical testing.
- The simulated vibration responses for cracks and pitting show distinct and quantifiable features that align well with experimental observations, enabling reliable fault type identification.
- The generation of a systematic simulation database for progressive faults offers invaluable data to support the development of advanced diagnostic algorithms and statistical health indicators for spur and pinion systems.
Future work will focus on incorporating more precise damping models, investigating the effects of friction variation, and extending the model to study the dynamic stability of the spur and pinion system under severe fault conditions. Furthermore, the integration of this physics-based model with deep learning techniques presents a promising avenue for creating robust, hybrid fault diagnosis systems.