Comparing the solid line and dotted line in Figure 1, for the same material, the value of plane stress under plane strain is significantly greater than the yield zone at the top of the crack. The reasons for the above situation can be understood through the following discussion. Under plane strain, there is a third tensile stress along the thickness direction (z direction) σ 3。 When the three-dimensional tensile stress is the stress state at this time, the corresponding yield condition is proposed. Under the condition of plane stress, it shall be σ ys= σ s。
According to previous research results, the distribution law of theoretical Mises stress is shown in Figure 1.
It can be seen from Fig. 1 that in the whole specimen, only a small part of the area has Mises stress, which is mainly distributed in the tip area of the crack. Enlarge the stress distribution at the tip as shown in Figure 1 (b). It can be seen from the figure that the stress distribution law under the two conditions is consistent: it is symmetrical with the horizontal line as the boundary. The closer to the crack tip, the faster the change.
When the stress ratio r = 0.1, the simulation results show that the crack length is α= The cloud diagram of Mises equivalent stress at 9.04mm, 15.24mm, 25.41mm and 27.53mm is shown in the following figure 2:
It can be seen from Figure 2 that the Mises equivalent stress nephogram of different crack lengths shows stress concentration at the crack tip, which is consistent with the theoretical Mises distribution stress. The stress distribution is symmetrical with the horizontal line as the boundary. The closer to the crack tip, the faster the change. With the increase of fatigue crack length, the stress distribution area increases. When the fatigue crack length is a = 27.5299, the maximum is 1080mpa.
When the stress ratio r = 0.6, the simulation results show that the crack length is α= The Mises equivalent stress nephogram at 9.44mm, 15.63mm, 25.30mm and 27.37mm is shown in Figure 3:
According to Fig. 2 and Fig. 3, the shape of Mises equivalent stress nephogram at the crack tip obtained by numerical simulation is similar to the theoretical value, which preliminarily proves the correctness of solving the stress intensity factor at the crack tip of compact tensile specimen by numerical simulation method.
The propagation of different crack lengths was simulated by finite element software. It can be seen from the results that the stress concentration phenomenon appears. The stress distribution is symmetrical with the horizontal line as the boundary. The closer to the crack tip, the faster the change, and an obvious gradient can be seen. With the increase of fatigue crack length, the area of Mises equivalent stress nephogram increases in the whole CT specimen. Under the same crack length, when the stress ratio r = 0.1, the stress at the crack tip is always greater than that when the stress ratio r = 0.6, which is the same as the conclusion that the stress intensity factor at the crack tip is larger under the condition of small stress ratio.
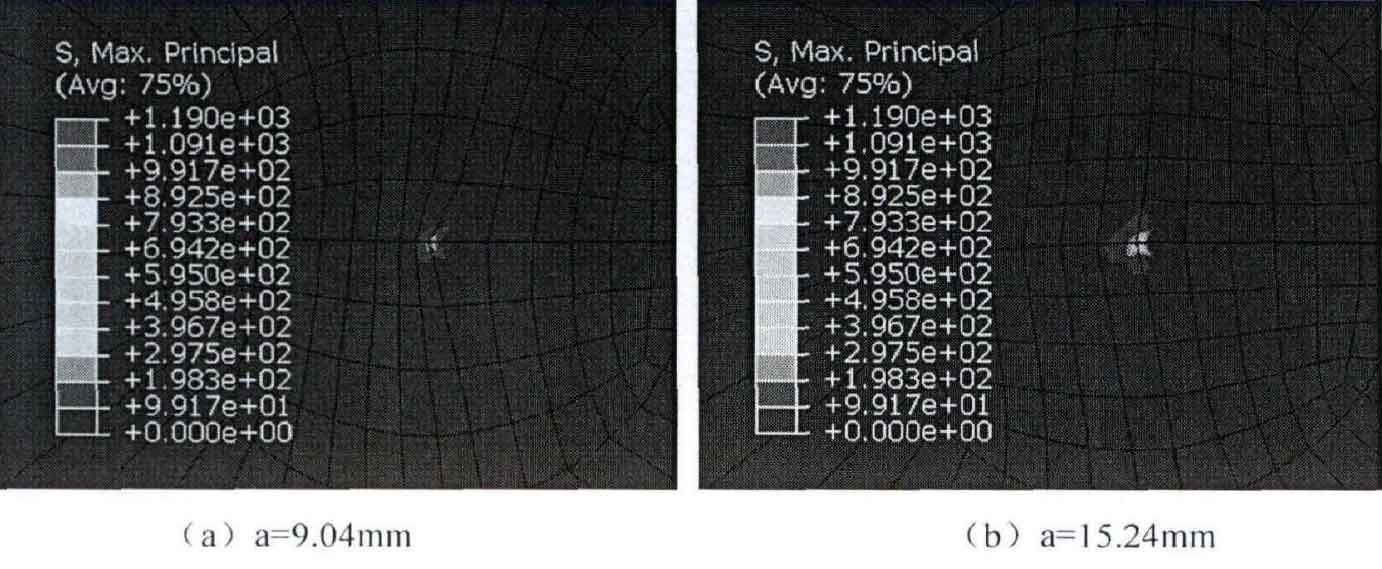
When the stress ratio r = 0.1, the simulation results show that the crack length is α= The cloud diagram of maximum principal stress under 9.04mm, 15.24mm, 25.41mm and 27.53mm is shown in Figure 4:

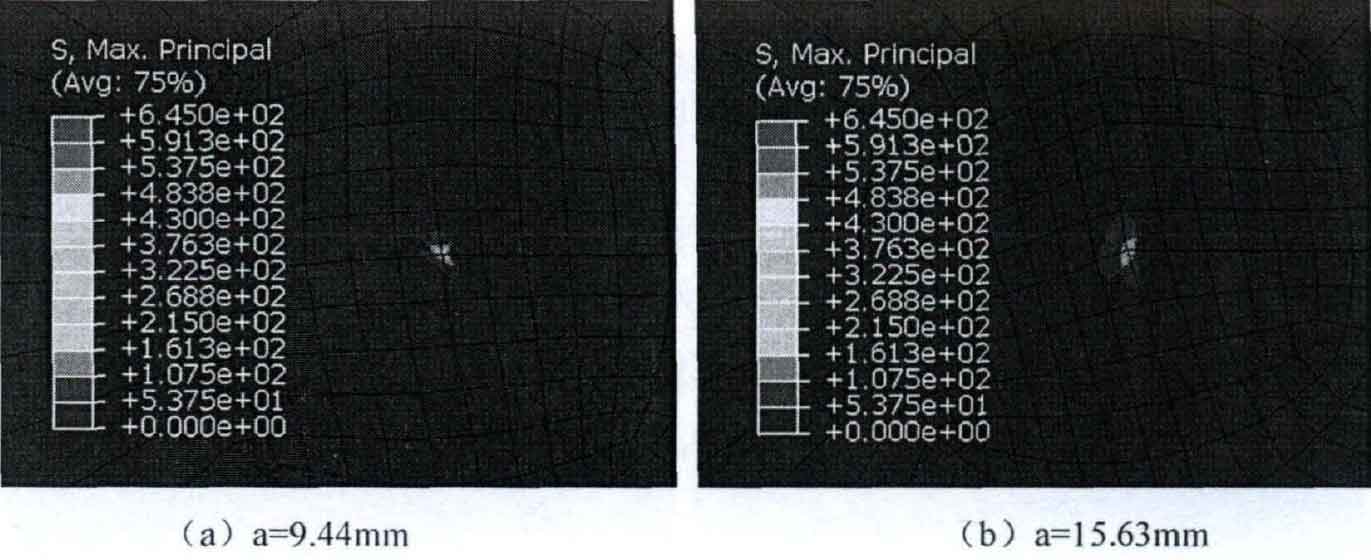
When the stress ratio r = 0.6, the simulation results show that the crack length is α= The nephogram of the maximum principal stress at 9.44mm, 15.63mm, 25.30mm and 27.37mm is shown in Figure 5:

It can be seen from Fig. 4 and Fig. 5 that the maximum principal stress nephogram of different crack lengths shows stress concentration at the crack tip. The stress distribution is symmetrical with the horizontal line as the boundary. The closer to the crack tip, the faster the change. With the increase of fatigue crack length, the stress distribution area increases. This is consistent with Mises equivalent stress nephogram. When the stress ratio r = 0.1, the fatigue crack length is α= The maximum pressure is 1189mpa at 27.5299; When the stress ratio r = 0.6, the fatigue crack length is α= The maximum pressure is 644.1mpa at 27.37.
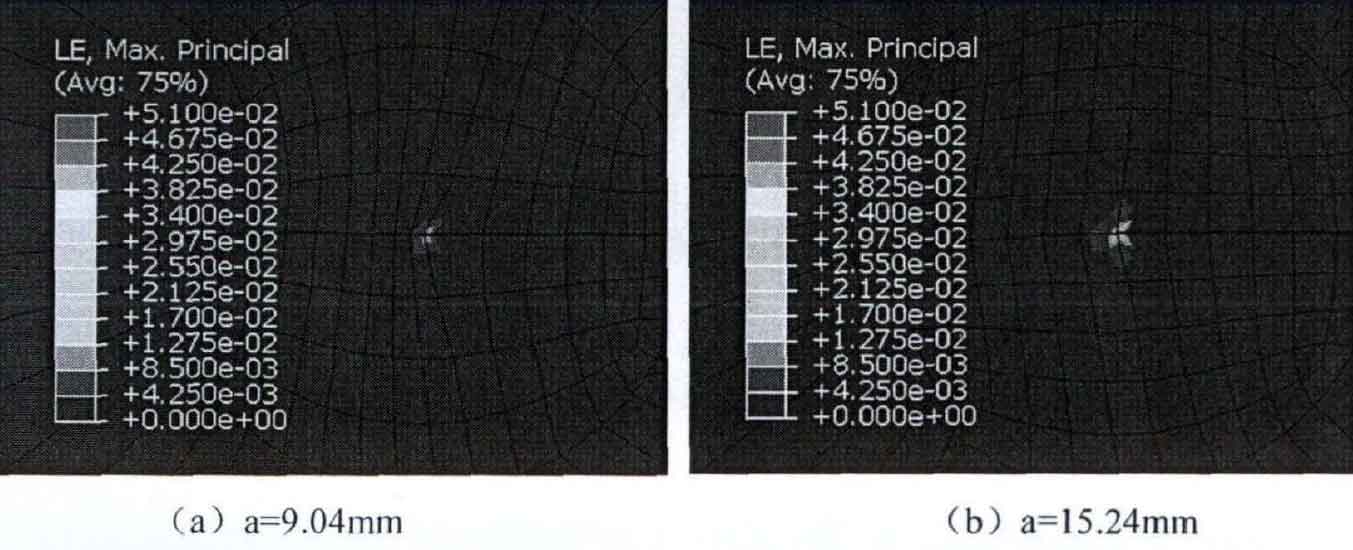
When the stress ratio r = 0.1, the simulation results show that the crack length is α= The cloud diagram of maximum principal strain at 9.04mm, 15.24mm, 25.41mm and 27.53mm is shown in Figure 6:

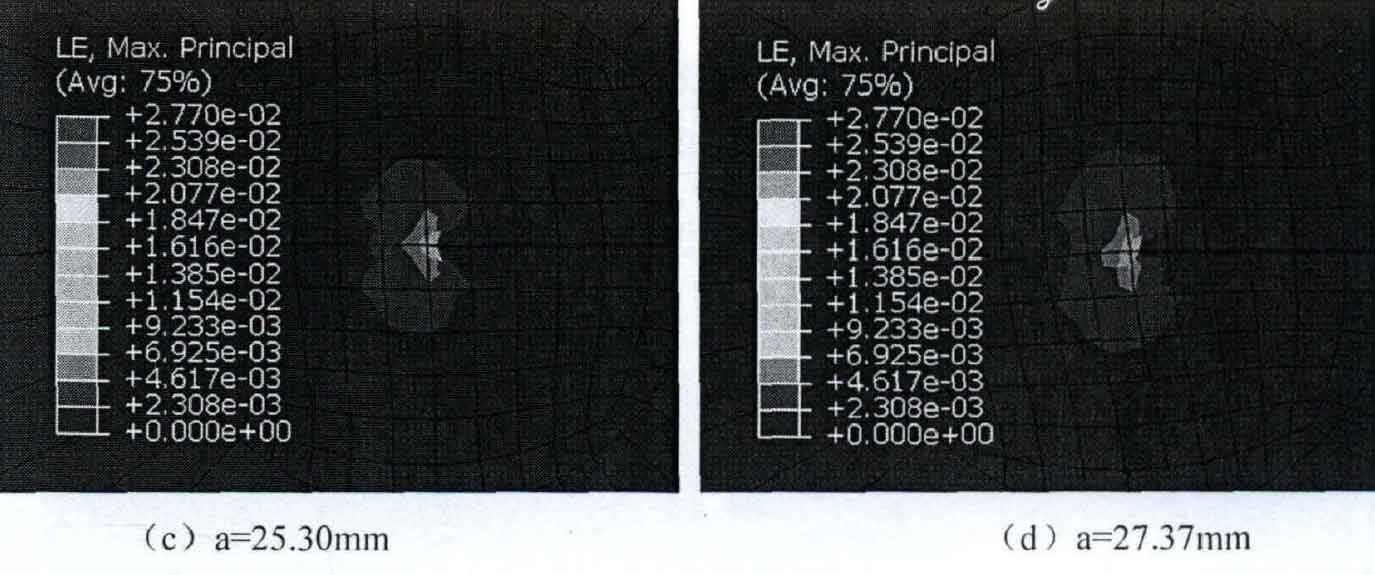
When the stress ratio r = 0.6, the simulation results show that the crack length is α= The cloud diagram of maximum principal strain at 9.44mm, 15.63mm, 25.30mm and 27.37mm is shown in Figure 7:
It can be seen from Fig. 6 and Fig. 7 that the maximum principal strain of different crack lengths appears at the crack tip. The stress distribution and characteristics are consistent with the theory, and the area of the maximum principal strain nephogram at the crack tip is increasing, which is consistent with the stress nephogram. When the stress ratio r = 0.1, the fatigue crack length is α= The maximum is 0.051 at 27.5299; When the stress ratio r = 0.6, the fatigue crack length is α= The maximum is 0.028 at 27.37.


