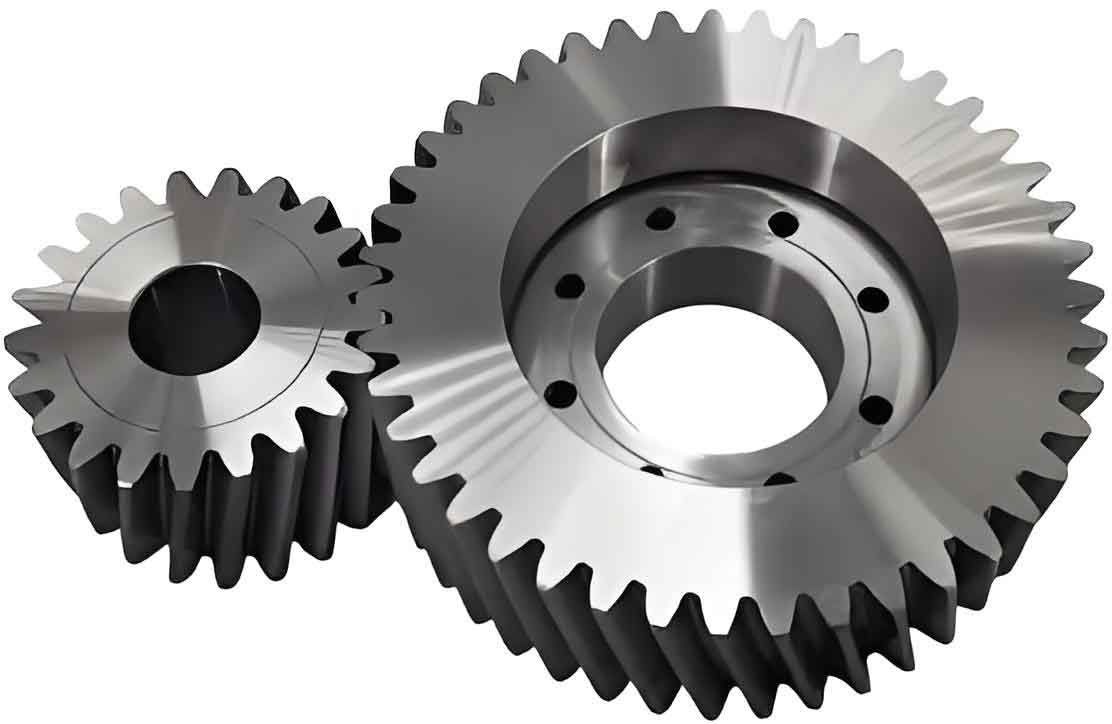
The rolling forming technology for cylindrical gears significantly enhances material utilization and improves fatigue strength by preserving continuous metal flow lines. This study systematically investigates the numerical simulation of the hot rolling process for spur cylindrical gears, focusing on deformation mechanisms, stress/strain evolution, and defect control strategies.
1. Tooth Surface Modeling and Process Analysis
The involute tooth profile of cylindrical gears can be mathematically described using parametric equations. For a spur gear with base circle radius $r_b$ and pressure angle $\alpha$, the tooth surface coordinates in the transverse plane are derived as:
$$
\begin{cases}
x = r_b \left( \sin(\theta_0 + \theta_s) – \theta_s \cos(\theta_0 + \theta_s) \right) \\
y = -r_b \left( \cos(\theta_0 + \theta_s) + \theta_s \sin(\theta_0 + \theta_s) \right) \\
z = u_a
\end{cases}
$$
where $\theta_s$ represents the involute generation angle, $\theta_0$ denotes the initial angle offset, and $u_a$ is the axial coordinate parameter. This formulation enables precise modeling of cylindrical gear tooth profiles for rolling simulations.

2. Finite Element Modeling
The rolling process consists of three distinct phases:
- Initial Splitting Phase
- Tooth Forming Phase
- Final Finishing Phase
Key simulation parameters for cylindrical gear rolling are summarized in Table 1:
| Parameter | Value |
|---|---|
| Workpiece Material | 42CrMo |
| Initial Temperature | 950°C (Workpiece) 20°C (Roller) |
| Friction Coefficient | 0.3 (Baseline) |
| Feed Rate | 0.1 mm/s |
| Mesh Elements | 101,536 (Local Refinement Ratio: 0.01) |
3. Deformation Characteristics Analysis
The equivalent strain distribution during cylindrical gear rolling reveals critical deformation patterns:
$$
\varepsilon_{eq} = \sqrt{\frac{2}{3} \dot{\varepsilon}_{ij} \dot{\varepsilon}_{ij}}
$$
As shown in Figure 2, maximum strain concentrations occur at the mid-height region near the tooth root, with values reaching 0.85-1.2 during the forming phase. The stress distribution follows:
$$
\sigma_{eq} = \sqrt{\frac{3}{2} s_{ij} s_{ij}}
$$
where $s_{ij}$ represents the deviatoric stress tensor. Peak stresses of 309-347 MPa occur at the roller-workpiece interface.
4. Rolling Force Evolution
The three-dimensional rolling forces exhibit characteristic patterns:
| Direction | Peak Force (kN) | Stage |
|---|---|---|
| X | 58.2 | Forming Phase (60% Feed) |
| Y | 9.8 | Finishing Phase |
| Z | 63.5 | Forming Phase (75% Feed) |
The force evolution correlates with material flow patterns and contact conditions during cylindrical gear formation.
5. Lug Defect Formation and Control
The lug defect formation mechanism in cylindrical gear rolling involves complex material flow dynamics:
$$
F_{lug} = \frac{1}{n} \sum_{i=1}^{n} \left( \frac{V_{lug}^i}{V_{tooth}^i} \times 100 \right) \%
$$
where $V_{lug}^i$ and $V_{tooth}^i$ represent lug volume and total tooth volume, respectively. Friction coefficient significantly influences lug formation:
| μ | Lug Volume (%) | Improvement |
|---|---|---|
| 0.1 | 16.63 | Base Case |
| 0.2 | 17.01 | +2.3% |
| 0.3 | 18.51 | +11.3% |
Optimal friction control (μ = 0.1-0.2) effectively reduces lug defects while maintaining forming stability in cylindrical gear production.
6. Conclusion
This investigation establishes a comprehensive framework for cylindrical gear rolling process optimization. The numerical model accurately predicts stress/strain distributions and defect formation mechanisms. Friction coefficient optimization proves crucial for minimizing lug defects, with recommended values of 0.1-0.2 for 42CrMo cylindrical gears. The findings provide theoretical guidance for improving manufacturing efficiency and product quality in gear rolling applications.
