This part analyzes the influence of rocker box structure optimization on gear meshing state of internal transmission system. Stationary random load and step load are used as simulation conditions, as shown in Figure 1. Fig. 1 (a) shows the stationary random load, with the mean value of 515.1 knm and the load fluctuation coefficient of 0.15; FIG. 1 (b) shows the step load, with the load mean value mutation occurring in the 5th second, the load mean value after mutation is twice that before mutation, and the load fluctuation coefficient before and after mutation is 0.15.
Figure 2 compares the displacement curves of the center of the roller support bearing hole (bp17) before and after the optimization of the rocker arm box structure under the condition of stationary random load. After optimization, the mean value of displacement curve decreases from 1.88 mm to 1.15 mm, with a decrease of 38.8%; the fluctuation amplitude of displacement curve decreases from 0.89 mm to 0.55 mm, with a decrease of 38.2%. It can be seen that the overall deformation of the rocker box is significantly reduced after the structural optimization.
In the transmission system of the cutting part, the meshing tooth direction error of gear pair 3 is the largest, so the change of meshing tooth direction error of gear pair 3 after the optimization of rocker box structure is focused. Figure 3 (a) shows the meshing tooth alignment error before structure optimization under stationary random load, with the peak value (max) of 19.478 μ m and the dynamic coefficient (DYF) of 2.340. Figure 3 (b) shows the meshing tooth alignment error after structure optimization under stationary random load, with the peak value (max) of 16.616 μ m and dynamic coefficient (DYF) of 2.251.
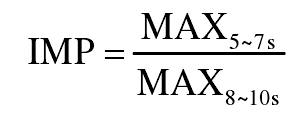
Figure 4 (a) is the meshing tooth error curve before structure optimization under step load. The meshing tooth error curve of 3 ~ 5 seconds is consistent with the same time period in Figure 4 (a). In the fifth second, under the action of step load, the meshing tooth error of gear pair increases rapidly, then decreases slowly and reaches the steady state. In this process, the peak value of meshing tooth alignment error (max8 ~ 10s) in 8 ~ 10s is 39.059 μ m, which is 2.005 times of that before the step (19.478 μ m); the peak value of meshing tooth alignment error (Max5 ~ 7S) in 5 ~ 7S is 45.450 μ m, and the corresponding impact coefficient (IMP) is 1.166. Figure 4 (b) is the meshing tooth error curve after topology optimization under step load, and its impact coefficient is reduced to 1.100.

Fig. 5 (a) and (b) respectively show the dynamic meshing force of gear pair 3 before and after the optimization of rocker box structure under stationary random load. The peak values of the two forces are 208.58 kn and 208.36 kn respectively, with almost no difference. Similarly, under step load, there is almost no difference in the peak value of meshing tooth direction error of gear pair 3 before and after structural optimization, as shown in Fig. 6.


