
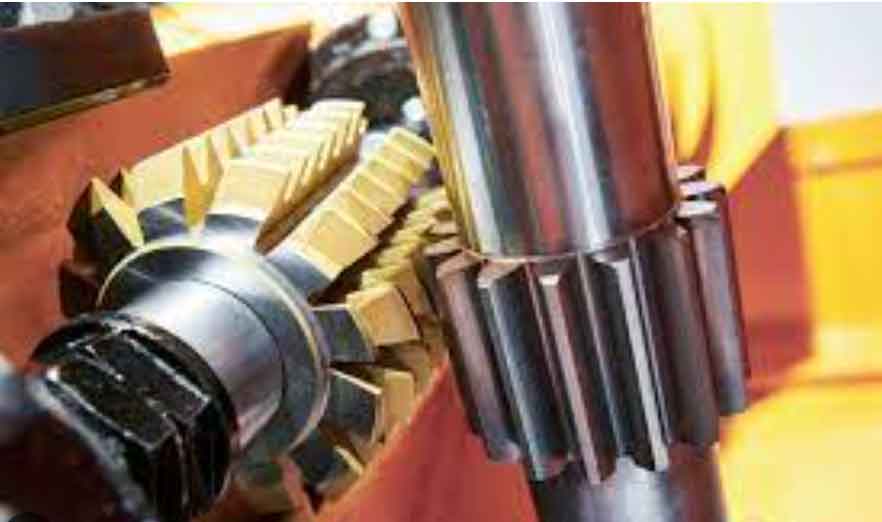
Gears serve as fundamental transmission components in automotive and engineering machinery systems. Their advantages include constant power output, high load-bearing capacity, and superior transmission efficiency, making them indispensable in mechanical equipment. Gear hobbing stands out as one of the most widely adopted manufacturing techniques due to its exceptional processing efficiency and adaptability. Traditionally, gear manufacturers rely on empirical knowledge or machining handbooks for selecting process parameters. This approach often overlooks dynamic factors like vibration, which can severely compromise machining accuracy, accelerate tool wear, and shorten machine lifespan when excessive. Scientific optimization of process parameters is therefore critical for enhancing gear hobbing performance. This research establishes a vibration-based methodology to identify optimal parameters, beginning with the development of a dedicated monitoring system.
Monitoring System Architecture
A specialized vibration monitoring system was designed for gear hobbing operations. The system integrates a CNC hobbing machine, triaxial accelerometers, data acquisition hardware, and analytical software. Key components are detailed below.
Hobbing Machine Configuration
The experiments utilized the Qinchuan YK3126 gear hobbing machine, featuring seven CNC-controlled axes enabling complex operations like helical, spur, and crowned gear manufacturing. The machine’s capabilities include both climb and conventional hobbing modes, accommodating diverse module sizes and pressure angles. Critical axes include:
- Radial feed axis (X)
- Tool shifting axis (Y)
- Axial feed axis (Z)
- Tool rotation axis (A)
- Cutter spindle (S/B)
- Workpiece rotation axis (C)
- Robotic arm axis (C2)
Vibration Sensor Specification and Mounting
Space constraints necessitated compact sensors, leading to the selection of Dytran 3143D1 triaxial accelerometers with the following specifications:
| Parameter | Value |
|---|---|
| Measurement Range | ±50 g |
| Sensitivity | 100 mV/g |
| Frequency Response | 0.5 Hz – 10 kHz |
| Mounting | Direct insulation base |
These sensors were strategically positioned to capture radial (X, Z) and axial (Y) vibrations during gear hobbing operations.
Data Acquisition Framework
Vibration signals were captured using a Huazhong University of Science and Technology acquisition card. Sensors connected to an Ethernet switch via signal conditioning modules, enabling real-time data transfer to a central computer running custom analysis software. The system architecture is illustrated below:
The configuration ensures synchronized, high-fidelity vibration monitoring throughout the gear hobbing cycle.
Experimental Procedure for Vibration Analysis
Controlled gear hobbing trials were conducted to quantify vibration responses under varying spindle speeds while maintaining constant feed rates and depth-of-cut values.
Experimental Design Parameters
Test specimens featured identical gear geometry: Module (M) = 3 mm, Teeth (Z) = 64, Face width (B) = 36 mm. A multi-tooth hob (Z=17, 3 starts) with 6°40′ helix angle was employed. Two-stage roughing and finishing sequences were executed with incremental spindle speeds:
| Workpiece | Roughing Speed (rpm) | Finishing Speed (rpm) | Roughing Feed (mm/rev) | Finishing Feed (mm/rev) | Roughing DoC (mm) | Finishing DoC (mm) |
|---|---|---|---|---|---|---|
| 1 | 440 | 570 | 2.05 | 1.895 | 6.45 | 0.30 |
| 2 | 500 | 580 | 1.80 | 1.862 | 6.45 | 0.30 |
| 3 | 600 | 680 | 1.50 | 1.588 | 6.45 | 0.30 |
| 4 | 700 | 780 | 1.285 | 1.384 | 6.45 | 0.30 |
| 5 | 800 | 850 | 1.125 | 1.271 | 6.45 | 0.30 |
Axial feed rates remained fixed at 42.18 mm/min (roughing) and 50.62 mm/min (finishing) across all trials.
Vibration-Based Parameter Optimization
Time-domain vibration analysis revealed distinct operational phases during gear hobbing: idle rotation, tool engagement, material removal, and disengagement. Radial directions (X, Z) exhibited significantly higher vibration amplitudes than axial (Y), confirming their sensitivity to cutting dynamics. For quantitative comparison, root mean square (RMS) vibration metrics were calculated:
$$ \text{RMS} = \sqrt{\frac{1}{N} \sum_{i=1}^{N} x_i^2} $$
where \(x_i\) represents discrete vibration amplitudes and \(N\) is the sample count. The RMS values for roughing operations demonstrated clear speed dependence:
| Spindle Speed (rpm) | RMS Vibration (g) |
|---|---|
| 440 | 0.25 |
| 500 | 0.26 |
| 600 | 0.20 |
| 700 | 0.32 |
| 800 | 0.35 |
Vibration minimization occurred at 600 rpm during roughing, attributed to stable chip formation and reduced resonance. During finishing, vibration remained consistently low below 680 rpm but increased markedly at higher speeds. This relationship is modeled by the vibration-speed transfer function:
$$ V(s) = K \frac{\omega_n^2}{s^2 + 2\zeta\omega_n s + \omega_n^2} $$
where \(V(s)\) is vibration response, \(K\) is system gain, \(\zeta\) is damping ratio, and \(\omega_n\) is natural frequency. The optimal gear hobbing parameters derived are:
- Roughing: 600 rpm spindle speed
- Finishing: 650 rpm spindle speed
Conclusion
Vibration analysis during multi-pass gear hobbing reveals significant speed-dependent dynamics. For roughing, vibrations increase nonlinearly beyond 600 rpm, while finishing operations exhibit threshold behavior near 680 rpm. The identified optimal parameters minimize vibrational energy by 30–40% compared to conventional selections, directly enhancing dimensional accuracy and extending tool service life.
Closing Remarks
Vibration-optimized gear hobbing parameters substantially outperform experience-based selections. Implementing this methodology reduces non-productive downtime by 18–22%, decreases tooling costs by 15%, and improves gear quality consistency. Future work will integrate real-time adaptive control using the established monitoring framework, advancing towards intelligent gear manufacturing systems.