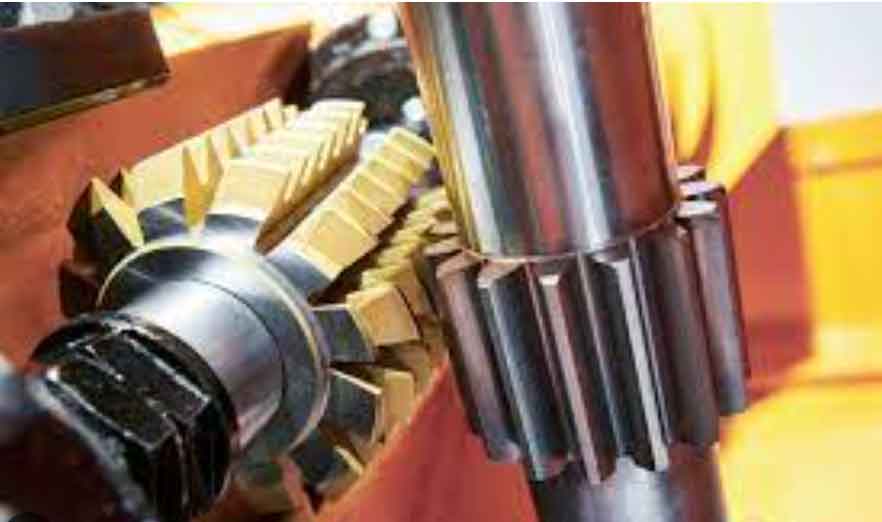
High-speed gear hobbing faces significant challenges in thermal management and energy efficiency during manufacturing. Elevated temperatures induce structural stresses, compromising dimensional accuracy and tool longevity. This research integrates a Genetic Algorithm-optimized Backpropagation (GABP) neural network with an enhanced Non-dominated Sorting Genetic Algorithm II (NSGA-II) to optimize gear hobbing parameters, targeting minimized energy consumption and maximized tool life.
1. Introduction
Gear hobbing remains pivotal for high-volume production in automotive transmissions. However, thermal accumulation during high-speed operations degrades surface integrity and geometric precision. Existing studies focus predominantly on singular objectives like machining time or vibration control. This work addresses multi-objective optimization (energy consumption \(W\) and tool life \(T\)) through a hybrid data-driven framework.
2. Methodology
2.1 GABP Neural Network Architecture
The GABP model replaces random BP initialization with genetic optimization of weights and thresholds. Input parameters include hob head count (\(p_{i1}\)), cutting speed (\(p_{i2}\)), axial feed rate (\(p_{i3}\)), and spindle speed (\(p_{i4}\)). Normalization precedes processing:
$$ d’ = 2 \left( \frac{d – d_{\text{min}}}{d_{\text{max}} – d_{\text{min}}} \right) – 1 $$
where \(d\) and \(d’\) denote raw and normalized data. Hidden layer neuron count \(C_M\) satisfies:
$$ \sum_{i=0}^{N} C_M > K $$
with \(K\) as sample size. Fitness uses prediction error norm:
$$ \|X\|_2 = \sqrt{x_1^2 + x_2^2} $$
where \(x_1, x_2\) are errors in \(W\) and \(T\) predictions.
2.2 Enhanced NSGA-II Optimization
Key gear hobbing parameters are optimized via NSGA-II with dynamic front-end coefficient adjustment to avoid local optima. The objective formulation is:
$$ \begin{array}{c} \text{min } F_{\text{GABP}} = \left\{ \begin{array}{l} \text{max } T \\ \text{min } W \end{array} \right. \\ \\ \text{s.t.} \quad p_{ij}^{\text{min}} \leq p_{ij} \leq p_{ij}^{\text{max}} \\ \quad s_{i1} \leq \text{MAX\_T}, \quad s_{i2} = \text{ELI\_Q} \end{array} $$
Constraints include quality thresholds (\(\text{ELI\_Q}\)) and maximum time (\(\text{MAX\_T}\)).

2.3 Algorithm Workflow
- Initialize gear hobbing sample set via DBSCAN clustering
- Generate initial NSGA-II population \(P_0\)
- Compute fitness using GABP model
- Perform selection, crossover, mutation
- Merge parent-child populations
- Non-dominated sorting and crowding distance calculation
- Prune population and iterate until convergence
3. Experimental Validation
3.1 GABP Model Performance
Testing used 50 training and 12 validation samples. The GABP (4 inputs, 23 hidden neurons, 2 outputs) achieved Mean Squared Error (MSE) of \(4.25 \times 10^{-4}\) after 5 epochs (Figure 1). Comparative errors:
$$ \text{GABP } \Delta T_{\text{mean}} = 3.24 \text{ min}, \quad \Delta W_{\text{mean}} = 3.19 \times 10^{-3} \text{ kWh} $$
$$ \text{BP } \Delta T_{\text{mean}} = 2.6 \text{ min}, \quad \Delta W_{\text{mean}} = 4.81 \times 10^{-3} \text{ kWh} $$
GABP reduced tool life error by 16% and energy prediction error by 36%.
| Algorithm | \(\Delta T\) (min) | \(\Delta W\) (10⁻³ kWh) |
|---|---|---|
| BP | 2.60 | 4.81 |
| GABP | 3.24 | 3.19 |
3.2 NSGA-II Optimization Results
Parameters: Population=100, generations=200, crossover rate=0.7, mutation rate=0.2. Pareto solutions (Figure 2) show:
$$ W \approx 66.5 \times 10^{-3} \text{ kWh at } T > 178 \text{ min} $$
Optimized solutions outperformed conventional samples (Table 2):
$$ \text{Energy reduction: } \frac{0.08780 – 0.08588}{0.08780} \times 100\% \approx 2.2\% $$
$$ \text{Tool life extension: } \frac{328.04 – 320.94}{320.94} \times 100\% \approx 2.2\% $$
| Parameter Set | \(W\) (kWh) | \(T\) (min) |
|---|---|---|
| Baseline | 0.08780 | 320.94 |
| Optimized Pareto | 0.08588 | 328.04 |
4. Conclusion
Integrating GABP with enhanced NSGA-II significantly improves gear hobbing sustainability. The GABP model achieved \(10^{-5}\) MSE with 36% lower energy prediction error versus BP. Pareto optimization simultaneously extended tool life by 2.2% and reduced energy consumption by 2.2%. This framework demonstrates industrial viability for multi-objective gear hobbing optimization.
