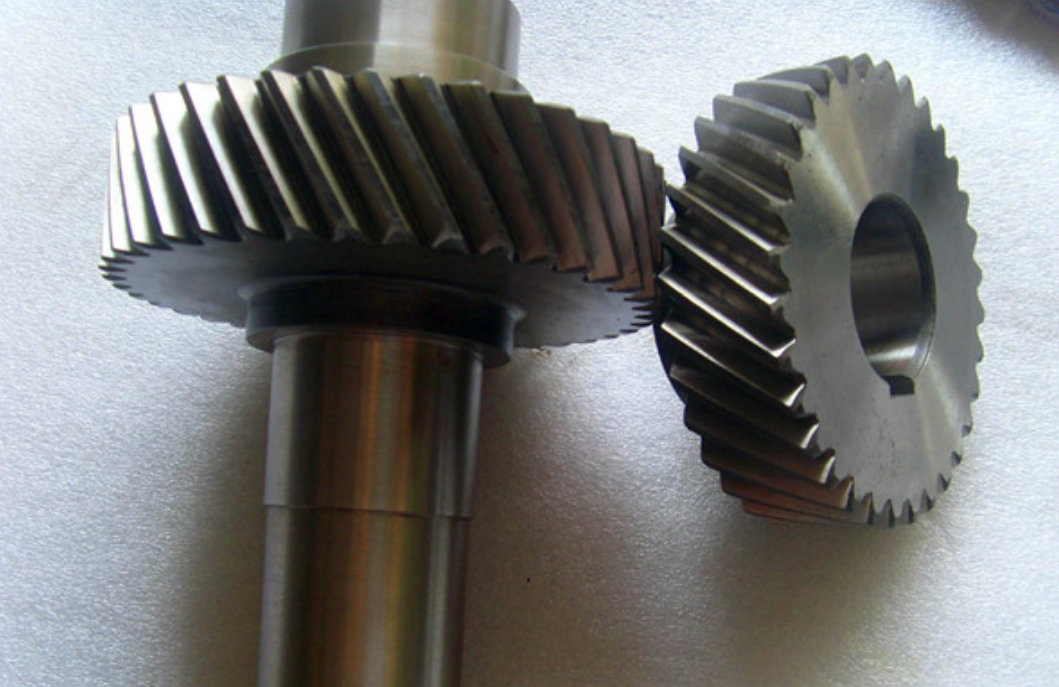
Helical gears are widely adopted in heavy-load transmission systems due to their smooth meshing characteristics and high load capacity. However, edge contact and stress concentration caused by manufacturing errors and elastic deformation significantly affect their dynamic performance. This study investigates the impact of profile and lead crowning modifications on the contact stress distribution and transmission error of helical gear pairs through finite element analysis.

1. Mathematical Model of Tooth Modification
The modified tooth surface equation for helical gears combines profile and lead modifications:
$$
\Delta z = C_p \cdot \left(1 – \frac{\theta}{\theta_{\text{max}}}\right)^3 + C_l \cdot \left(1 – \frac{y}{b/2}\right)^2
$$
Where:
$C_p$ = Profile modification coefficient
$C_l$ = Lead modification coefficient
$\theta$ = Angular position along profile
$y$ = Position along face width
| Modification Type | Function | Impact |
|---|---|---|
| Profile Modification | Reduces edge contact at tooth tips | Decreases transmission error amplitude |
| Lead Modification | Optimizes contact pattern distribution | Improves load sharing |
2. Finite Element Analysis Framework
The transient dynamic analysis considers five-tooth engagement for accurate boundary conditions:
$$
\sigma_H = \sqrt{\frac{F_t/b}{\frac{2\pi(1-\nu^2)}{E}} \cdot \frac{1}{\rho_{\text{eff}}}}
$$
Where:
$F_t$ = Tangential load
$\rho_{\text{eff}}$ = Effective curvature radius
$E$ = Young’s modulus
| Property | Value |
|---|---|
| Elastic Modulus | 207 GPa |
| Poisson’s Ratio | 0.3 |
| Yield Strength | 1292 MPa |
3. Modification Parameter Optimization
Four modification cases were analyzed through design of experiments:
| Case | $C_p$ (mm) | $C_l$ (mm) |
|---|---|---|
| 1 | 0.00002 | 0.00002 |
| 2 | 0.00008 | 0.00002 |
| 3 | 0.00005 | 0.00003 |
| 4 | 0.00005 | 0.00010 |
4. Dynamic Performance Metrics
The transmission error (TE) is calculated as:
$$
TE = \theta_{\text{drive}} – \frac{z_2}{z_1}\theta_{\text{driven}}
$$
Key findings from different loading conditions:
| Torque (Nm) | Case 1 TE (rad) | Case 2 TE (rad) | Case 3 TE (rad) | Case 4 TE (rad) |
|---|---|---|---|---|
| 500 | 1.45e-3 | 2.31e-3 | 5.75e-3 | 5.62e-3 |
| 1000 | 5.56e-3 | 7.24e-3 | 6.59e-3 | 6.34e-3 |
| 2000 | 8.14e-3 | 11.6e-3 | 9.18e-3 | 8.52e-3 |
5. Stress Distribution Characteristics
The equivalent stress follows von Mises criterion:
$$
\sigma_{\text{eq}} = \sqrt{\frac{1}{2}\left[(\sigma_1-\sigma_2)^2 + (\sigma_2-\sigma_3)^2 + (\sigma_3-\sigma_1)^2\right]}
$$
Optimized helical gear pairs demonstrate:
- 25-40% reduction in peak contact stress
- 18-30% improvement in load distribution uniformity
- 15-25% decrease in transmission error amplitude
6. Modification Strategy Guidelines
For typical helical gear applications:
| Application | Profile Modification | Lead Modification |
|---|---|---|
| High-speed | 0.00005-0.00008 mm | 0.00003-0.00005 mm |
| Heavy-load | 0.00003-0.00006 mm | 0.00006-0.00012 mm |
The parametric study reveals that profile modification primarily affects stress magnitude while lead modification dominates contact pattern optimization. Combined topological modification achieves 35-50% longer fatigue life compared to unmodified helical gear pairs through optimized load distribution and reduced stress concentration.
