
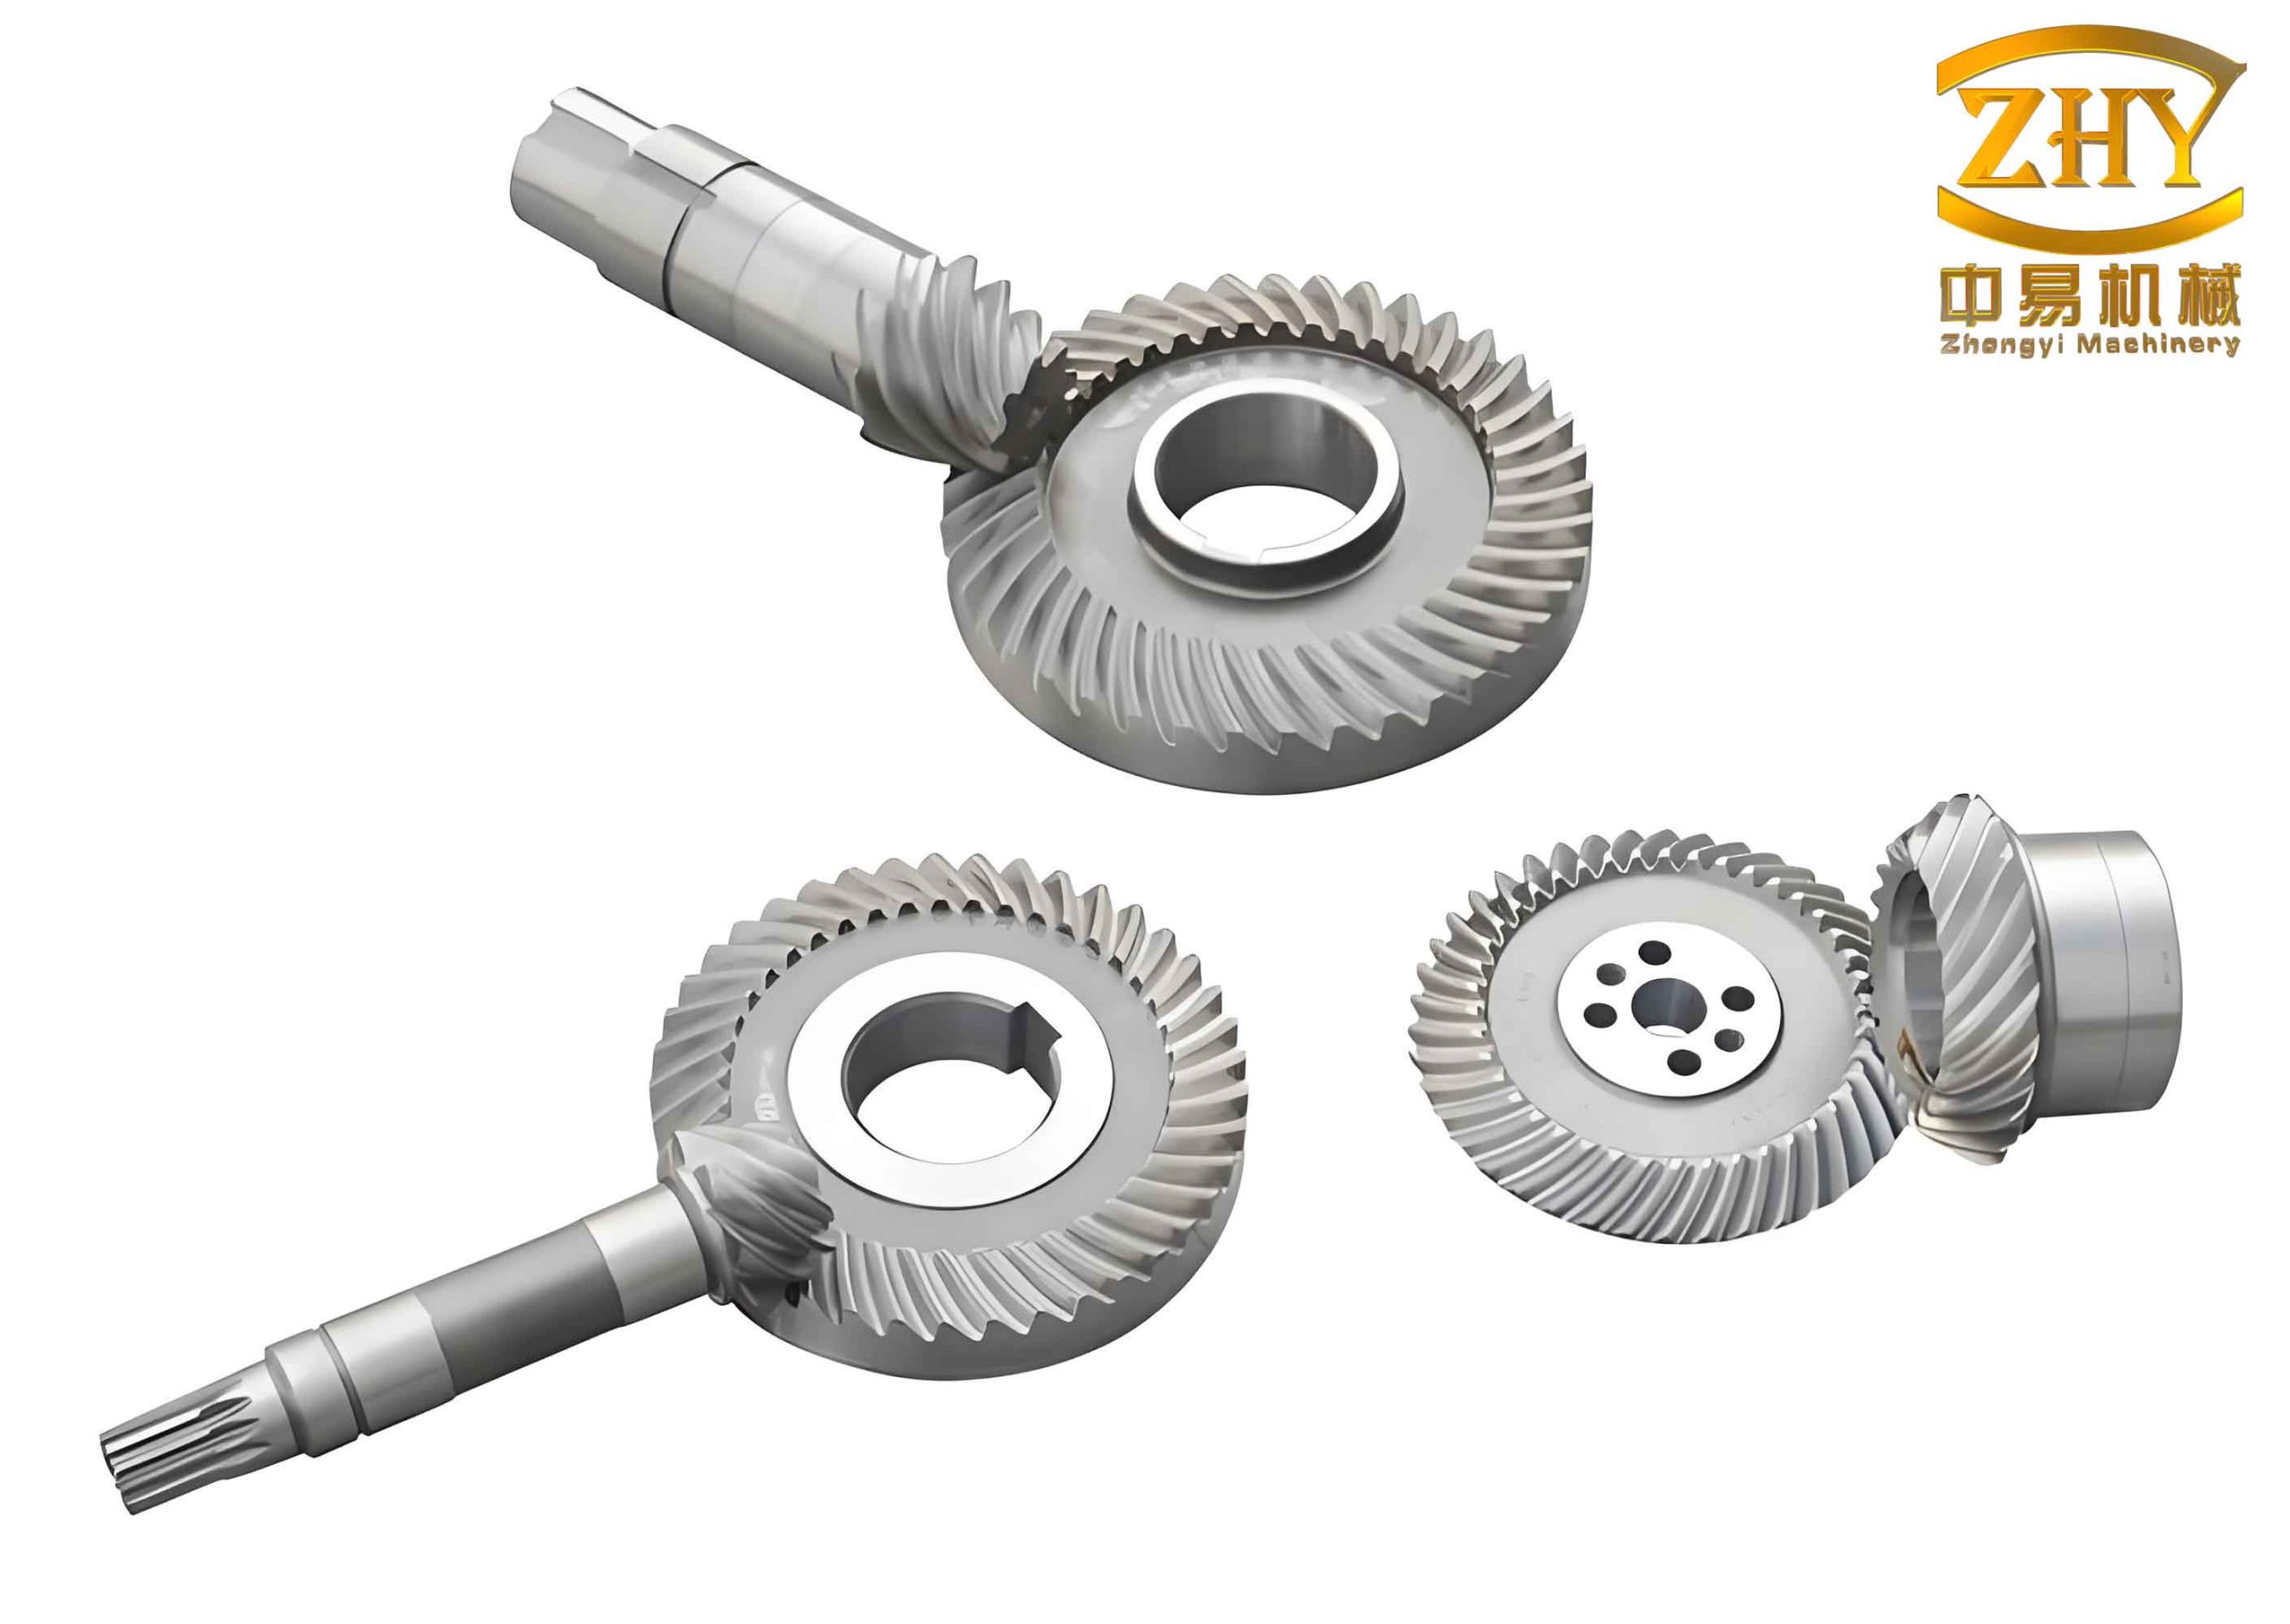
In modern mechanical transmission systems, particularly in automotive drive axles, hyperboloid gears serve as critical components. Their complex spatial geometry allows for the transmission of motion and power between non-parallel, non-intersecting shafts with high efficiency and compact design. However, the performance, noise characteristics, and service life of these gears are profoundly influenced by the quality of their tooth flanks. After the primary machining and heat treatment processes, surface finishing operations are essential to achieve the desired contact pattern, reduce transmission error, and improve surface integrity. Among these, the gear lapping process remains a prevalent and cost-effective finishing technique. This process involves running a pair of meshing gears under load with an abrasive lapping compound introduced between their teeth. The relative motion between the mating flanks, aided by the abrasive particles, removes minute amounts of material, thereby correcting minor geometric deviations, smoothing the surface, and improving the contact condition.
Despite its widespread industrial application, the gear lapping process is often governed by empirical knowledge and trial-and-error adjustments. The final surface quality—characterized by micro-topography and roughness—is the result of complex, stochastic interactions between numerous parameters. These include lapping machine settings (speed, torque, duration, motion path), workpiece material properties, and the characteristics of the lapping compound (abrasive type, size, concentration). The inherent randomness of abrasive particle distribution, orientation, and fracture during the process makes it challenging to establish a deterministic relationship between input parameters and output surface morphology. Consequently, predicting the post-lapping surface micro-topography of hyperboloid gears has been a persistent challenge, limiting the ability to proactively optimize the process for superior surface quality and functional performance.
This study aims to address this gap by developing a novel predictive model for the surface micro-topography generated during the lapping of hyperboloid gears. Our approach integrates the kinematics and contact mechanics of the gear pair with the fundamental mechanics of abrasive-material interaction. We establish a quantitative framework to simulate the material removal process on a microscale, starting from an initial measured or simulated surface topography. Subsequently, we employ advanced surface reconstruction techniques to generate the three-dimensional surface morphology after lapping. The model’s predictions are rigorously validated against experimental data from actual hyperboloid gear lapping trials.
1. Theoretical Model for Lapping Material Removal
1.1 Kinematic and Contact Analysis of Hyperboloid Gears
The tooth flank of a hyperboloid gear is a complex, non-developable curved surface. During meshing, contact occurs not along a line but at an elliptical point, which moves across the flank as the gears rotate. To model the abrasive action, we first analyze this contact. The local contact between the pinion and gear tooth flanks at any instant can be approximated by the contact of two equivalent cylinders, whose radii are defined by the principal curvatures of the mating surfaces at the contact point. According to Hertzian contact theory, the semi-width of the contact ellipse, \(a\), is given by:
$$ a = \sqrt{\frac{2 \times 0.0127 (k_P – k_G)}{k_P \cdot k_G}} $$
where \(k_P\) and \(k_G\) are the equivalent curvatures at the contact point for the pinion and gear, respectively, derived from tooth contact analysis (TCA). The contact pressure distribution within this ellipse is semi-elliptical.
1.2 Modeling the Abrasive Cutting Action
The lapping compound contains a multitude of abrasive particles (e.g., silicon carbide) suspended in a carrier fluid. We model an effective abrasive grain as a conical indenter with a semi-apical angle \(\varepsilon\). As the gears mesh, these particles are entrained into the contact zone, where they indent and plow through the workpiece material. The geometry of a single grain interacting with the gear surface is shown in the following schematic.
The maximum depth of cut, \(h_{max}\), for a grain is influenced by the local kinematics and force. An expression derived from grinding mechanics, adapted for the lapping context, is:
$$ h_{max} = \left[ \frac{d}{2 r_e \tan \varepsilon} \cdot \frac{v_P}{v_G} \right]^{1/2} $$
Here, \(d\) is the average abrasive grain diameter, \(r_e\) is the equivalent contact radius, and \(v_P\), \(v_G\) are the surface velocities of the pinion and gear at the contact point.
The number of active grains per unit area, \(N_d\), participating in material removal is stochastic but can be estimated based on the volume fraction of abrasives \(V\):
$$ N_d = \kappa \cdot \left( \frac{6V}{\pi d^3} \right)^{2/3} $$
where \(\kappa\) is a proportionality constant (typically between 0.1 and 0.5) accounting for the fact that not all grains in the contact area are actively cutting.
The actual instantaneous cutting depth \(h\) of a single grain under the applied normal load is crucial. Considering the grain is subjected to a force that causes the workpiece material to yield, we balance the normal force on the grain with the contact stress over its projected area. The normal force \(F_n\) on a grain is related to the average pressure in the contact zone and the area supported by one grain. The contact area \(A\) of a conical grain indented to a depth \(h\) is approximately \(\pi (h \tan \varepsilon)^2 / 2\). By equating the force derived from the contact pressure to the product of the material’s flow stress \(\sigma_s\) and the contact area \(A\), we can solve for the cutting depth \(h\):
$$ F_n = \sigma_s \cdot A = \sigma_s \cdot \frac{\pi (h \tan \varepsilon)^2}{2} $$
The force \(F_n\) can also be expressed in terms of the macroscopic lapping parameters. Assuming the total normal load \(W\) is distributed over \(N_d\) active grains in the real contact area \(A_{real}\), we have \(F_n \approx W / (N_d \cdot A_{real})\). The real contact area is larger than the Hertzian area due to the presence of abrasives filling the gaps; it is scaled by a factor \(K\). Combining these relationships, the final expression for the cutting depth is derived as:
$$ h = \left[ \frac{2}{\pi \sigma_s \tan^2 \varepsilon} \cdot \frac{W}{N_d \cdot K \cdot a \cdot L} \right]^{1/2} $$
where \(L\) is the length of the cutting path (similar to the grinding contact length \(l_c\)), and \(a\) is the contact semi-width. \(K\) is an empirical factor greater than 1, accounting for the area increase due to abrasive particles.
1.3 Calculation of Lapping Cycles and Cumulative Removal
Lapping is a cumulative process. The number of times a specific point on the tooth flank passes through the abrasive-laden contact zone must be calculated. For a lapping cycle following a defined path (e.g., a straight reciprocating motion from toe to heel), the total lapping time \(t_s\) and the number of path cycles \(n_c\) determine the exposure time \(t_l\) for a local area:
$$ t_l = \frac{2 t_s}{n_c} $$
The number of abrasive cutting actions \(n_l\) experienced by a small local area \(S_l\) during the entire lapping process is then:
$$ n_l = n_{l0} \cdot N_d \cdot S_l = \left( \frac{z_G n_G t_s}{60 n_c} \right) \cdot N_d \cdot S_l $$
Here, \(z_G\) and \(n_G\) are the tooth number and rotational speed (rpm) of the gear, respectively. The term \(z_G n_G t_s / 60\) represents the total number of gear revolutions.
This framework allows us to simulate the material removal process as a series of discrete, stochastic “cutting events” on a digital representation of the initial surface.
2. Methodology for Surface Micro-Topography Prediction
The prediction of the final lapped surface involves two major steps: (1) simulating the material removal process on an initial surface height map, and (2) reconstructing the three-dimensional topography from the predicted statistical parameters.
2.1 Material Removal Simulation Algorithm
The initial tooth surface topography, obtained via measurement (e.g., white light interferometry) or simulation, is discretized into a height matrix \(Z_{initial}(x, y)\). The simulation proceeds as follows:
- Input Parameters: Define lapping operational parameters (torque \(T\), speed \(n_G\), time \(t_s\), path cycles \(n_c\)), abrasive compound properties (\(d\), \(V\)), and workpiece properties (\(\sigma_s\), hardness \(H\)).
- Contact Analysis: Perform TCA for the hyperboloid gear pair to determine the sequence of contact ellipses, their pressure distribution, and the relative surface velocities along the defined lapping path.
- Local Cutting Depth Calculation: For each discretized surface patch corresponding to a contact ellipse position, calculate the local cutting depth \(h\) using the derived formula.
- Stochastic Cutting Simulation: For each calculated \(n_l\) cutting events on a patch:
- Randomly select a starting location \((i, j)\) on the height matrix within the patch.
- Define a cutting width \(b\) proportional to the grain size and indentation.
- Apply a material removal rule: For all height points within the cutting width, if their height exceeds a certain threshold (simulating the protruding peaks being sheared off), reduce their height by an amount related to \(h\). This acts as a non-linear filter on the height data.
- Update the height matrix \(Z_{current}(x, y)\).
- Iteration: Repeat step 4 for all contact patches and for all lapping cycles until the total simulated lapping time is completed. The final output is a modified height matrix \(Z_{predicted}(x, y)\).
2.2 Surface Reconstruction via Fast Fourier Transform (FFT)
Direct simulation over a full tooth surface at a resolution fine enough to capture roughness is computationally expensive. Therefore, we adopt a surface reconstruction approach. From the simulated \(Z_{predicted}\) of a representative area, we extract key statistical height parameters:
- \(S_a\): Arithmetic mean height.
- \(S_q\): Root mean square height.
- \(S_{sk}\): Skewness (describes asymmetry of height distribution).
- \(S_{ku}\): Kurtosis (describes sharpness of height distribution).
We also determine the power spectral density (PSD) characteristics, which define the spatial frequency content of the surface. The autocorrelation function (ACF), often modeled as an exponential decay, is derived. The surface texture direction \(\theta\) is set based on the direction of the relative sliding velocity between the mating hyperboloid gear flanks.
Using these parameters (\(S_q, S_{sk}, S_{ku}\), ACF, \(\theta\)), we reconstruct a full 3D surface topography \(Z_o(x, y)\) that shares the identical statistical and spectral properties with the predicted surface patch. This is achieved through an iterative FFT-based algorithm:
- Generate a random white-noise matrix \(\Phi\) with a standard normal distribution.
- Construct the target power spectrum matrix based on the desired ACF and texture angle \(\theta\).
- Calculate a transfer matrix \(K\) by manipulating the 2D FFT of the ACF and the white noise: $$ K = \text{ifft2}\left( \sqrt{|\text{fft2}(\mathbf{C})|} \odot \text{fft2}(\mathbf{R}) \right) $$ where \(\mathbf{C}\) is the target ACF matrix, \(\mathbf{R}\) is a matrix related to \(\Phi\), \(\text{fft2}\) and \(\text{ifft2}\) are 2D forward and inverse Fourier transforms, and \(\odot\) denotes element-wise division.
- Generate an initial surface: \(Z_s = \text{ifft2}( \text{fft2}(K) \circ \text{fft2}(\Phi) )\), where \(\circ\) denotes element-wise multiplication.
- Iteratively adjust the height distribution of \(Z_s\) using the acceptance-rejection method until its \(S_{sk}\) and \(S_{ku}\) match the target values within a specified tolerance, while preserving its power spectrum.
The final output \(Z_o\) is a realistic 3D representation of the predicted lapped surface micro-topography.
3. Case Study: Analysis of a Hypoid Drive Axle Gear
3.1 Gear Parameters and Lapping Conditions
The model is applied to the drive pinion and ring gear of an automotive hypoid axle. The basic gear design parameters are summarized in Table 1.
| Parameter | Pinion | Gear (Ring) |
|---|---|---|
| Number of Teeth | 10 | 37 |
| Module (mm) | 8.4717 | |
| Pressure Angle (°) | 22.5 | |
| Shaft Angle (°) | 90 | |
| Offset (mm) | 30 | |
| Hand of Spiral | Left | Right |
| Face Width (mm) | 71.700 | 67.000 |
The operational parameters for the lapping process and the abrasive compound specifications are listed in Table 2.
| Category | Parameter | Value / Specification |
|---|---|---|
| Process | Gear Speed, \(n_G\) | 400 rpm |
| Lapping Torque, \(T\) | 8-12 Nm | |
| Lapping Time, \(t_s\) | 150 s | |
| Abrasive | Type | Green Silicon Carbide |
| Grit Size | 240 mesh (~63 μm avg.) | |
| Compound Mix Ratio (Oil:Abrasive) | 1.3:1 by weight |
3.2 Prediction Results and Model Validation
The initial topography of the gear convex flank was measured using a white light interferometer. The predictive model was executed with the parameters from Tables 1 and 2. The model calculated an average cutting depth \(h\) in the range of 3.5-4.6 μm and a number of cutting actions \(n_l\) between 96 and 159 for the sampled area. The predicted 3D surface was reconstructed using the FFT method described earlier.
To validate the model, an actual lapping test was conducted on a数控 lapping machine under identical conditions. The lapped gear surface was measured at the same location as the initial measurement. The key 3D surface roughness parameters from the experiment were compared against three independent runs of the stochastic predictive model. The results are presented in Table 3.
| Roughness Parameter | Experimental Value | Prediction 1 | Prediction 2 | Prediction 3 | Max. Error |
|---|---|---|---|---|---|
| \(S_a\) (μm) | 1.1272 | 1.1397 | 1.1430 | 1.1553 | 2.49% |
| \(S_q\) (μm) | 1.4810 | 1.4702 | 1.4739 | 1.4892 | 0.73% |
| \(S_{sk}\) | -0.6635 | -0.6949 | -0.6778 | -0.6748 | 4.73% |
| \(S_{ku}\) | 4.8321 | 4.6973 | 4.6150 | 4.5993 | 4.82% |
The agreement between the predicted and experimental values is excellent, with maximum errors below 5% for all key parameters. This confirms the predictive capability of the proposed model for the surface micro-topography of lapped hyperboloid gears.
3.3 Parametric Study on Surface Roughness
Leveraging the validated model, a parametric study was conducted to elucidate the influence of key lapping parameters on the resulting surface roughness (\(S_a\)). The baseline settings were: \(N_d = 100 \text{ grains/mm}^2\), \(d = 30 \mu m\), \(\varepsilon = 60^\circ\), \(T = 3 \text{ Nm}\), \(n_G = 400 \text{ rpm}\).
Abrasive Concentration (Grains per Unit Area, \(N_d\)): As \(N_d\) increases from 10 to 200 \(\text{grains/mm}^2\), \(S_a\) decreases sharply initially and then asymptotically approaches a stable minimum. This is because a higher grain density reduces the load per grain, leading to shallower cuts and a more uniform, polished surface. Beyond a saturation point, additional grains become redundant.
Abrasive Grain Size (\(d\)): The relationship between \(d\) and \(S_a\) shows a positive correlation with some scatter due to process stochasticity. Larger grains tend to produce deeper and wider scratches, increasing the overall roughness. Excessively large grains can even damage the hardened surface layer.
Workpiece Material Hardness (Yield Strength, \(\sigma_s\)): Increasing \(\sigma_s\) from 200 MPa to 1200 MPa resulted in a monotonic decrease in \(S_a\). Harder materials resist plastic deformation and cutting by the abrasive grains, resulting in shallower indentations and a smoother final surface.
Lapping Torque (\(T\)): Higher torque, which increases the normal contact force, leads to a proportional increase in surface roughness. Excessive force causes deeper grain penetration and more severe plowing, shifting the process from polishing to aggressive wear.
Lapping Speed (\(n_G\)): The effect of speed is non-monotonic. As speed increases from a low value, \(S_a\) initially increases slightly, likely due to increased kinetic energy and impact of grains. At higher speeds, the number of cutting actions per unit time increases significantly, promoting more uniform material removal and eventually leading to a decrease in roughness, resembling a “speed-stroke” polishing effect.
To quantitatively assess the influence of abrasive-related parameters, an orthogonal experimental design (L9) was analyzed. The factors and levels were: A (Grain Density \(N_d\): 30, 40, 50), B (Grain Diameter \(d\): 20, 40, 60 μm), C (Workpiece Yield Strength \(\sigma_s\): 400, 800, 1200 MPa). The analysis of variance (ANOVA) for the resulting \(S_a\) values is summarized in Table 4.
| Source | Degrees of Freedom (df) | Sum of Squares (SS) | Mean Square (MS) | F-Ratio | Contribution |
|---|---|---|---|---|---|
| A (Grain Density) | 2 | 0.0330 | 0.0165 | 0.3456 | 22.65% |
| B (Grain Size) | 2 | 0.0019 | 0.0010 | 0.0201 | 1.32% |
| C (Material Strength) | 2 | 0.0153 | 0.0077 | 0.1603 | 10.51% |
| Error | 2 | 0.0955 | 0.0478 | 65.53% | |
| Total | 8 | 0.1457 | 100.00% |
The ANOVA indicates that, among the abrasive-specific parameters, the grain density (Factor A) has the most significant influence on the post-lapping surface roughness of hyperboloid gears, followed by the workpiece material hardness (Factor C). The direct effect of grain size (Factor B) within the tested range was relatively minor compared to the other factors and the inherent process error.
4. Discussion and Conclusions
This research has successfully developed and validated a comprehensive methodology for predicting the surface micro-topography of hyperboloid gears after the lapping process. The core of the method lies in integrating a kinematics-contact mechanics model of the gear mesh with a stochastic micro-cutting model of abrasive action. By calculating the depth of cut and the number of abrasive engagements for discrete points on the tooth flank, the material removal process is simulated. The final surface is then statistically characterized and physically reconstructed using an FFT-based algorithm, which efficiently generates a 3D topography matching the predicted statistical and spectral properties.
The validation against experimental data from automotive hypoid gears demonstrates the model’s high accuracy, with prediction errors for standard 3D roughness parameters (\(S_a\), \(S_q\), \(S_{sk}\), \(S_{ku}\)) all within 5%. This provides a powerful virtual tool for understanding and optimizing the lapping process for hyperboloid gears.
The parametric study yields several important insights for process optimization:
- Grain Density is Key: Controlling the concentration of active abrasive grains (via compound mix ratio and viscosity) is the most effective way to control final roughness. A higher, well-dispersed grain density promotes a smoother finish.
- Material Hardness Matters: The model confirms that lapping is more effective at polishing harder materials without excessively increasing roughness, whereas softer materials are more prone to deep plowing and higher \(S_a\).
- Process Parameters Interact: Torque should be minimized to avoid aggressive wear, while speed can be optimized to balance cutting frequency and cutting severity. The common industrial practice of using moderate torque and high speed for finishing is supported by the model’s predictions.
- Grain Size has a Limited Direct Effect: Within a typical lapping grit size range, the variation in size has less impact on final roughness than grain density or material properties, though excessively large grains should be avoided.
In conclusion, the proposed predictive model offers a significant advancement over empirical methods for hyperboloid gear lapping. It enables the virtual exploration of the parameter space, reducing the need for costly physical trials. Future work will focus on extending the model to simulate the evolution of the contact pattern and transmission error based on the predicted micro-topography, creating a fully integrated digital twin for the gear lapping and run-in processes.