
1. Training data validation


The 90 groups of trained samples are predicted by the RBF neural network established. Fig. 1 (a) and Fig. 1 (b) are the prediction curve and training curve of P10 row ∑ FB and P20 row ∑ FB respectively. It can be seen that the prediction curve can well follow the training curve. The dashed line in Fig. 5 shows the relative error between the predicted value and the training value. The maximum error in Fig. 1 (a) appears at the starting position of prediction, which is 5.21%. In Fig. 1 (b), the maximum error is 4.89% at No. 35 and 55. 0200 and 0. 0139, respectively. The training data is close to the prediction data.


At the same time, 30 groups of known fresh data are used for prediction, and the data points are shown in Fig. 2 (a) and Fig. 2 (b). The maximum relative error is 5.63% and 4.89% respectively, and the root mean square error is 0.0263 and 0.0185 respectively. The difference between the relative error and the mean square error of the fresh data and the training samples is small, which indicates that the model can accurately predict the frequency coupling influence ratio of the meshing force.
2. Grid prediction

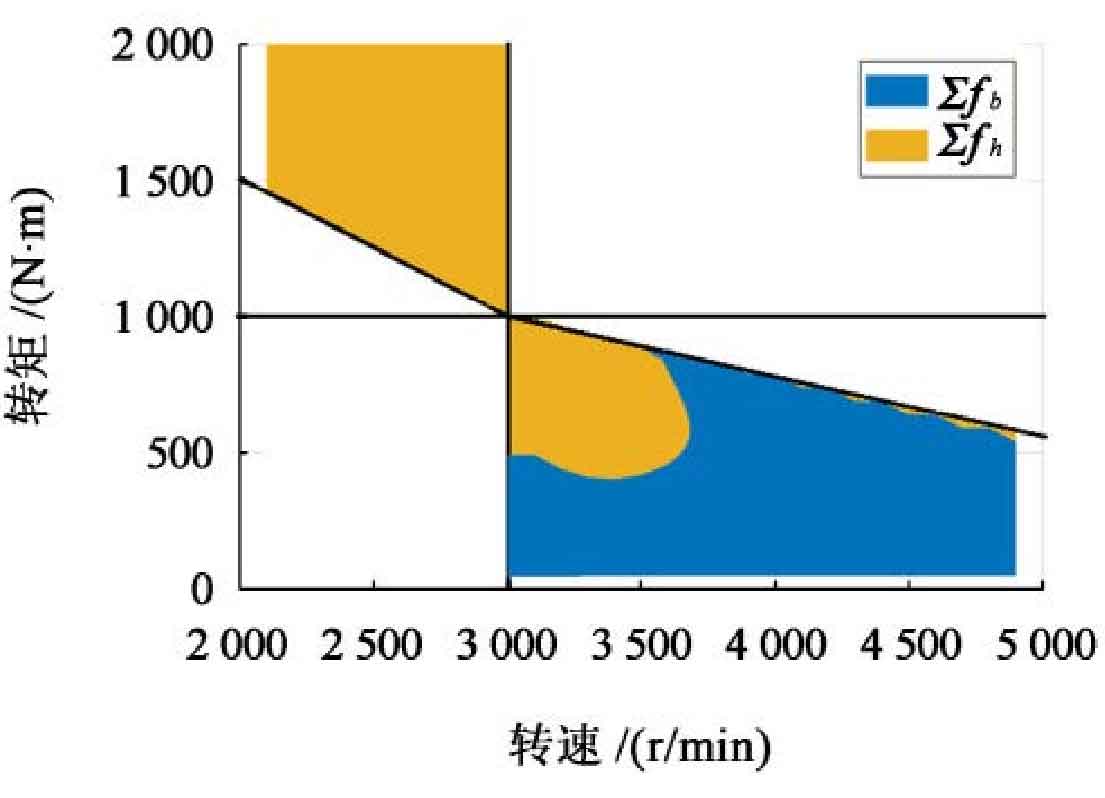
In order to further analyze the factors that affect the frequency coupling of meshing force, the original data points are not comprehensive enough, the trained RBF neural network model is applied to predict the grid points in the analysis interval, and the data are obtained at the same time, as shown in Figure 3. The results show that the graph is similar to figure 4, and the prediction result is smoother.

