
I have focused my research on the dynamic response and fatigue life of helical gears under quenching residual stress. Helical gears are widely used in high-speed and heavy-load transmission systems because they offer stable transmission ratios, high efficiency, compact structures, long service life, and wide ranges of speed and power. Compared with spur gears, helical gears exhibit better meshing performance, larger transmission ratios, higher load-carrying capacity, and lower vibration and noise. Therefore, they are increasingly applied in high-precision equipment. However, the quenching heat treatment that is often used to improve the load-carrying capacity of helical gears introduces significant residual stresses. These residual stresses persist during the meshing process of helical gear pairs, changing the contact state and bending performance, and further affecting the dynamic response and fatigue life of the gears. My study aims to clarify how quenching residual stress influences the time-varying meshing stiffness, dynamic meshing force, vibration response, meshing characteristics, fatigue life, and crack propagation of helical gears.
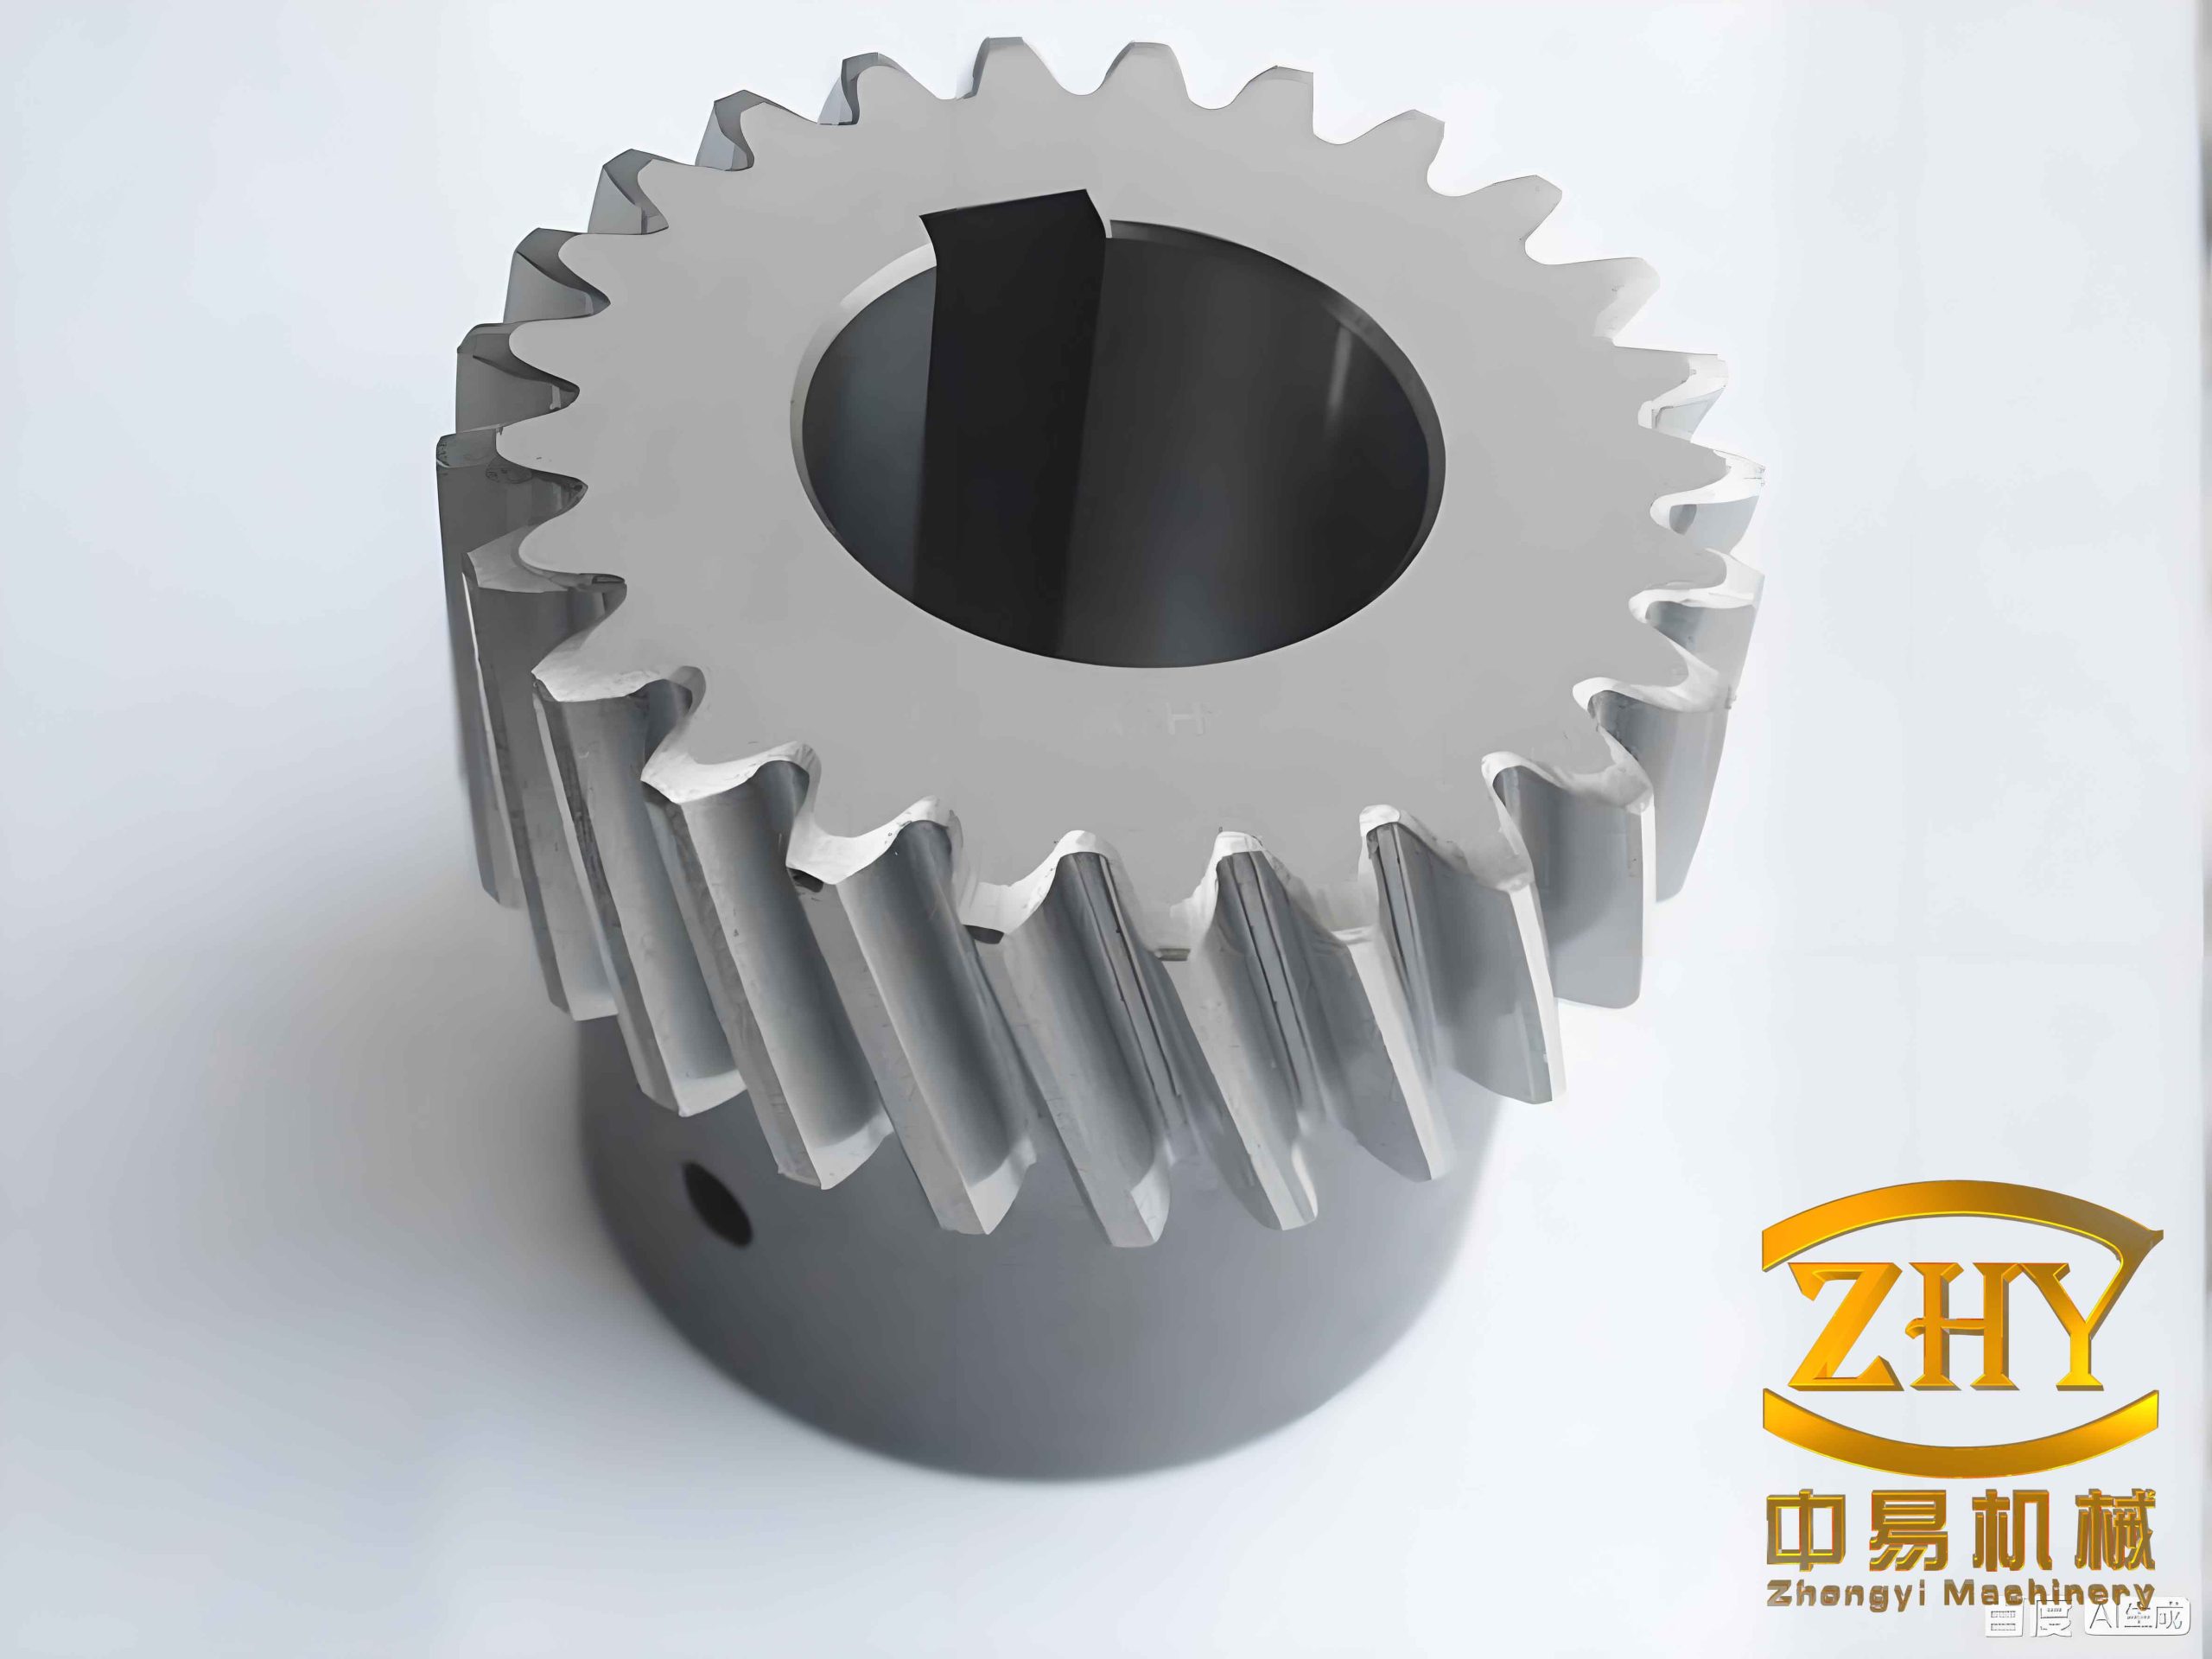
I began by recognizing that residual stress in helical gears is generated by a complex interaction of thermal stress, transformation stress, and additional stress. Thermal stress arises from temperature gradients during rapid cooling. Transformation stress arises from volume changes during martensitic transformation. Additional stress arises from non-uniform chemistry or microstructure. The sum of these stresses forms the final residual stress field. For helical gears, the distribution of residual stress is influenced by cooling medium, geometry, size, thermal physical properties, and phase transformation kinetics. Beneficial compressive residual stress can strengthen the tooth surface and improve fatigue life, while harmful tensile residual stress can reduce mechanical performance and shorten service life. Therefore, understanding the quenching residual stress distribution in helical gears is fundamental to improving their performance and extending their life.
1. Formation and Numerical Modeling of Quenching Residual Stress
I treated the quenching process of helical gears as a non-steady-state heat transfer problem. The temperature field was governed by the Fourier heat conduction equation in a three-dimensional Cartesian coordinate system:
$$ \rho c \frac{\partial T}{\partial t} = \frac{\partial}{\partial x}\left(\lambda \frac{\partial T}{\partial x}\right) + \frac{\partial}{\partial y}\left(\lambda \frac{\partial T}{\partial y}\right) + \frac{\partial}{\partial z}\left(\lambda \frac{\partial T}{\partial z}\right) + q_v $$
Here, $\rho$ is density, $c$ is specific heat capacity, $T$ is temperature, $t$ is time, $\lambda$ is thermal conductivity, and $q_v$ is the volumetric heat generation. I used the third kind of boundary condition to describe the heat exchange between the helical gear surface and the quenching medium:
$$ -\lambda \frac{\partial T}{\partial n} = h(T_s – T_a) $$
where $h$ is the surface heat transfer coefficient, $T_s$ is the surface temperature, and $T_a$ is the quenching medium temperature. I set the initial temperature of the helical gear to 850 °C and the initial temperature of the quenching oil to 80 °C, followed by air cooling at 25 °C. The heat transfer coefficient of the quenching oil was taken from established data and varied with surface temperature. I used a sequential coupling method: first, I solved the transient temperature field, and then I imported the temperature history into the stress field model to calculate the residual stress. This approach is computationally efficient and provides sufficient accuracy for helical gears.
For the stress field, I used the classical thermo-elastic-plastic theory. The total strain was decomposed as:
$$ \varepsilon = \varepsilon_e + \varepsilon_p + \varepsilon_{th} $$
where $\varepsilon_e$ is elastic strain, $\varepsilon_p$ is plastic strain, and $\varepsilon_{th}$ is thermal strain. The incremental stress-strain relation was written as:
$$ \Delta \sigma = \mathbf{D} (\Delta \varepsilon – \Delta \varepsilon_{th}) $$
where $\mathbf{D}$ is the temperature-dependent elastic-plastic matrix. The finite element equilibrium equation for the quenching stress analysis was expressed as:
$$ \int_V \mathbf{B}^T \mathbf{D} \mathbf{B} \, dV \, \Delta \mathbf{u} = \int_V \mathbf{B}^T \mathbf{D} \Delta \varepsilon_{th} \, dV + \int_V \mathbf{B}^T \Delta \sigma_0 \, dV $$
I built a three-dimensional finite element model of a helical gear pair. The pinion had 41 teeth and the gear had 145 teeth. The normal module was 2.0 mm, the normal pressure angle was 20°, and the helix angle was 21.6°. The pinion had a left-hand helix, and the gear had a right-hand helix. The face widths were 50 mm and 45 mm, respectively. The center distance was 199.98 mm. The material was 20CrMnTi low-carbon alloy steel, which is commonly used for carburized and quenched gears. The chemical composition and thermal physical properties are summarized in Table 1 and Table 2.
| Parameter | Pinion | Gear |
|---|---|---|
| Number of teeth, $Z$ | 41 | 145 |
| Normal module, $m_n$ (mm) | 2.0 | 2.0 |
| Normal pressure angle, $\alpha_n$ (°) | 20.0 | 20.0 |
| Helix angle, $\beta$ (°) | 21.6 | 21.6 |
| Helix direction | Left | Right |
| Profile shift coefficient, $x$ | 0.345 | −0.3449 |
| Face width, $B$ (mm) | 50.0 | 45.0 |
| Center distance, $a$ (mm) | 199.98 | |
| Property | Value |
|---|---|
| Elastic modulus, $E$ (GPa) | 210 |
| Poisson’s ratio, $\nu$ | 0.278 |
| Density, $\rho$ (kg/m³) | 7850 |
| Carbon, C (wt%) | 0.21 |
| Manganese, Mn (wt%) | 0.99 |
| Chromium, Cr (wt%) | 1.08 |
| Silicon, Si (wt%) | 0.35 |
| Titanium, Ti (wt%) | 0.064 |
| Sulfur, S (wt%) | ≤0.035 |
| Phosphorus, P (wt%) | ≤0.035 |
I used the finite element method to simulate the quenching of helical gears. The gear model was discretized with C3D8R elements. The tooth surface, end faces, and shaft hole surface were set as heat exchange surfaces with the quenching medium. A cyclic symmetry boundary condition was applied to the cut faces. The mesh was refined near the tooth surface and root to capture sharp gradients. The temperature field was solved first, and the resulting nodal temperatures were imported into the stress analysis. I found that the cooling rate varied significantly across the helical gear. The tooth tip cooled fastest, followed by the tooth root, and the tooth core cooled slowest. The temperature contour showed that the maximum temperature moved from the core toward the shaft hole surface as quenching progressed. After about 500 s, the entire helical gear reached the quenching oil temperature, and the subsequent air cooling brought it to room temperature.
I selected characteristic points on the tooth surface, tooth root, and tooth core to analyze the temperature history. The temperature at the tooth core decreased more slowly than at other locations. The tooth root temperature fell between the core and the surface. These differences in cooling rate are responsible for the residual stress distribution. During the early stage of quenching, the surface cooled rapidly and contracted, while the core remained hot and resisted contraction. This produced tensile stress at the surface and compressive stress in the core. In the later stage, martensitic transformation occurred. The surface transformed first because it reached the martensite start temperature earlier. The volume expansion associated with martensite formation reversed the stress state. After quenching, the tooth surface was in compression and the tooth core was in tension. The tooth root experienced even higher compressive residual stress than the tooth surface because of its more complex geometry. Therefore, introducing residual stress into the tooth surface by quenching also introduces larger residual stress into the tooth root.
2. Time-Varying Meshing Stiffness Under Quenching Residual Stress
I established a finite element model of a helical gear pair to calculate the time-varying meshing stiffness. I used a single-node meshing method. For each contact node, the meshing stiffness was defined as:
$$ k_i = \frac{F_i}{\delta_i} $$
where $F_i$ is the normal contact force at node $i$ and $\delta_i$ is the elastic deformation at that node. The single-tooth stiffness for the pinion and gear was obtained by summing the nodal stiffnesses over the contact area:
$$ k_p = \sum_{i=1}^{m} k_i, \quad k_g = \sum_{i=1}^{m} k_i $$
For a pair of meshing teeth, the combined stiffness was:
$$ k_j = \frac{k_p k_g}{k_p + k_g} $$
When $t$ pairs of teeth were in contact, the total time-varying meshing stiffness was:
$$ K_t = \sum_{j=1}^{t} k_j $$
I used the same helical gear parameters as in the quenching analysis. The pinion rotated at a low speed of 5 rad/s to maintain quasi-static conditions. The driven gear was loaded with a torque of 2424 N·m. The contact was defined as surface-to-surface with hard normal behavior and a friction coefficient of 0.15. The mesh was refined in the contact zone. The analysis was divided into 200 time steps. I compared the calculated average meshing stiffness with the ISO standard and with published results. The average meshing stiffness from my model was $6.051 \times 10^5$ N/mm, which was 2.7% lower than the ISO standard value of $6.220 \times 10^5$ N/mm. This small difference confirmed the reliability of my model. The time-varying meshing stiffness curve showed that the stiffness increased when the helical gear pair moved from a four-tooth contact zone to a five-tooth contact zone. The maximum stiffness occurred in the five-tooth contact zone because the contact area was larger. Small fluctuations appeared at the transition from five-tooth contact to four-tooth contact due to meshing impact.
I then imported the quenching residual stress field into the meshing stiffness model as an initial stress condition. I compared the time-varying meshing stiffness with and without residual stress. The residual stress caused the stiffness curve to fluctuate. The fluctuation was amplified at the transition from five-tooth contact to four-tooth contact. The peak stiffness in the five-tooth contact zone increased noticeably. The average meshing stiffness with residual stress was $6.065 \times 10^5$ N/mm, which was slightly larger than the value without residual stress, $6.051 \times 10^5$ N/mm. The influence of residual stress on meshing stiffness was not a simple increase or decrease. Instead, the stiffness increased in some regions and decreased in others within one meshing cycle. This regional fluctuation affects the vibration state of the helical gear pair. Therefore, the effect of residual stress should be included when calculating the time-varying meshing stiffness of helical gears.
3. Ten-Degree-of-Freedom Dynamic Model of Helical Gears
I used the lumped parameter method to establish a ten-degree-of-freedom dynamic model for the helical gear pair. The model included the translational displacements of the pinion and gear in the $x$, $y$, and $z$ directions, the torsional displacement about the $z$-axis, and the swing displacement about the $y$-axis. The dynamic equations were written in matrix form as:
$$ \mathbf{M} \ddot{\mathbf{q}} + \mathbf{C} \dot{\mathbf{q}} + \mathbf{K} \mathbf{q} = \mathbf{F} $$
where $\mathbf{q}$ is the displacement vector:
$$ \mathbf{q} = \{x_1, y_1, z_1, \theta_{1z}, \theta_{1y}, x_2, y_2, z_2, \theta_{2z}, \theta_{2y}\}^T $$
The mass matrix $\mathbf{M}$, damping matrix $\mathbf{C}$, and stiffness matrix $\mathbf{K}$ were assembled from the individual gear parameters. The dynamic meshing force along the line of action was calculated as:
$$ F_n = K_t \delta_n + C_m \dot{\delta}_n $$
where $K_t$ is the time-varying meshing stiffness, $C_m$ is the meshing damping, and $\delta_n$ is the dynamic transmission error along the normal direction. The dynamic transmission error included the effects of gear backlash, mesh error, and relative displacements. I used a nonlinear backlash function:
$$ f(\delta_n, b) = \begin{cases} \delta_n – b, & \delta_n > b \\ 0, & -b \le \delta_n \le b \\ \delta_n + b, & \delta_n < -b \end{cases} $$
where $b$ is half of the average normal backlash. The mesh error was modeled as a harmonic function:
$$ e(t) = e_0 + e_r \sin(2\pi f t + \varphi_e) $$
where $e_0$ is the mean mesh error, $e_r$ is the fluctuation amplitude, $f$ is the meshing frequency, and $\varphi_e$ is the initial phase. The meshing damping was calculated from an empirical formula:
$$ C_m = 2 \zeta \sqrt{\frac{K_t m_1 m_2}{m_1 + m_2}} $$
where $\zeta$ is the damping ratio, taken between 0.03 and 0.17, and $m_1$ and $m_2$ are the equivalent masses of the pinion and gear. The dynamic parameters used in my model are summarized in Table 3.
| Parameter | Pinion | Gear |
|---|---|---|
| Mass, $m$ (kg) | 2.74 | 11.15 |
| Rotational inertia, $J$ (kg·m²) | 0.0028 | 0.14 |
| Support stiffness, $k_x$ (N/m) | $2.3 \times 10^8$ | $3.7 \times 10^8$ |
| Support stiffness, $k_y$ (N/m) | $2.3 \times 10^8$ | $3.7 \times 10^8$ |
| Support stiffness, $k_z$ (N/m) | $1.5 \times 10^8$ | $2.0 \times 10^8$ |
| Torsional stiffness, $k_{y\theta}$ (N/m) | $1.5 \times 10^6$ | $2.0 \times 10^6$ |
| Equivalent damping, $c$ (Ns/m) | $1.5 \times 10^3$ | $1.5 \times 10^3$ |
| Rotational speed, $n$ (rpm) | 20900 | 5909.63 |
| Power, $P$ (kW) | 1500 | |
I solved the dynamic equations using the Runge–Kutta method. The time-varying meshing stiffness calculated with and without residual stress was used as the internal excitation. The dynamic meshing forces in the tangential, axial, radial, and normal directions were obtained. The frequency spectra were obtained by fast Fourier transform. The meshing frequency of the helical gear pair was $f_m = 14281$ Hz. The pinion rotational frequency was $f_{s1} = 348.33$ Hz, and the gear rotational frequency was $f_{s2} = 98$ Hz.
4. Dynamic Response of Helical Gears Under Quenching Residual Stress
I found that the dynamic meshing force of the helical gear pair changed significantly when residual stress was considered. The time-domain dynamic meshing force with residual stress had a larger amplitude than that without residual stress. The peak normal meshing force increased by 1843.2 N, or 8.47%. The amplitude difference of the normal meshing force increased from 4684 N to 7566.4 N. The impact phenomenon became more severe, although the impact period did not change noticeably. In the frequency domain, the amplitude spectral density of the rotational frequency and the meshing frequency increased. The change in the meshing frequency was more significant than the change in the rotational frequency. The normal and tangential meshing frequency amplitudes increased more obviously than the axial one. The amplitude spectral density of the normal meshing frequency increased by 29.8%, while the amplitude spectral density of the second harmonic decreased by 16.03%. Therefore, quenching residual stress affects both low-frequency and high-frequency components of the dynamic meshing force of helical gears.
I also analyzed the vibration displacements of the pinion and gear. The vibration displacements were periodic. For the pinion, the vibration displacement in the $x$ direction was $0$ to $2.983 \times 10^{-5}$ m, in the $y$ direction was $0$ to $6.814 \times 10^{-5}$ m, in the $z$ direction was $0$ to $4.516 \times 10^{-5}$ m, and the swing displacement was $0$ to $10.032 \times 10^{-4}$ rad. The largest translational vibration displacement occurred in the $y$ direction, and the smallest occurred in the $x$ direction. For the gear, the vibration displacements were smaller than those of the pinion because the pinion is on the high-speed shaft. The residual stress had a small effect on the overall vibration displacement in the large period, but the fluctuation in the small period was slightly larger when residual stress was included. In the frequency domain, the vibration acceleration of the pinion was dominated by the meshing frequency. The second and third harmonics also contributed to the vibration response. The residual stress increased the amplitude at the first meshing frequency by 94.187% in the $x$ direction. The amplitudes at the second and third meshing frequencies increased by 120.087% and 61.4%, respectively. Therefore, the influence of residual stress on the vibration acceleration of helical gears is not limited to the first meshing frequency but also strongly affects the higher harmonics.
5. Meshing Characteristics Under Dynamic Load and Residual Stress
I converted the dynamic meshing force obtained from the dynamic model into a dynamic torque and applied it to the driven gear in the finite element meshing model. The pinion rotated at 5 rad/s, and the corresponding time for one meshing cycle was 0.1287 s. The contact ratio of the helical gear pair was 4.2, meaning that four-tooth and five-tooth contact alternated. I divided one tooth meshing period into 20 positions at equal angular increments. For each position, I analyzed the meshing state of the helical gear pair.
I compared the tooth surface Mises stress with and without residual stress. The maximum Mises stress without residual stress was 446 MPa, and it occurred at the contact position. With residual stress, the maximum Mises stress was 416 MPa, which was about 30 MPa lower. The residual compressive stress on the tooth surface reduced the Mises stress. I also observed stress concentration near the tooth root in the model without residual stress, but this concentration was absent when residual stress was included. The tooth surface contact stress showed a similar trend. The maximum contact stress without residual stress was 654 MPa, while with residual stress it was 607 MPa, a reduction of 47 MPa. The maximum contact force without residual stress was 598 N, while with residual stress it was 553 N, a reduction of 45 N. The nodal contact area was slightly smaller with residual stress, but the difference was only about 0.007 mm². The elastic deformation of the tooth surface was also reduced by residual stress. The maximum elastic deformation without residual stress was 34.8 μm, while with residual stress it was 31.5 μm. The residual compressive stress on the tooth surface reduced the elastic deformation during meshing.
I also analyzed the tooth root stress. In the model without residual stress, a stress concentration appeared on the tooth root near the contact side, with a maximum value of 370 MPa. In the model with residual stress, the stress at the same location was only 242 MPa. The difference was 128 MPa, which is larger than the difference on the tooth surface. Therefore, quenching residual stress has a strong influence on the tooth root stress response of helical gears.
| Quantity | Without residual stress | With residual stress | Difference |
|---|---|---|---|
| Maximum tooth surface Mises stress (MPa) | 446 | 416 | −30 |
| Maximum tooth surface contact stress (MPa) | 654 | 607 | −47 |
| Maximum tooth surface contact force (N) | 598 | 553 | −45 |
| Maximum tooth surface elastic deformation (μm) | 34.8 | 31.5 | −3.3 |
| Maximum tooth root Mises stress (MPa) | 370 | 242 | −128 |
6. Fatigue Life of Helical Gears Under Quenching Residual Stress
I used the nominal stress method and Miner’s linear cumulative damage theory to predict the fatigue life of the helical gears. The fatigue life was calculated using the S-N curve of 20CrMnTi steel, which was generated by the Seeger method. The S-N curve was described by the power function:
$$ \sigma^m N = C $$
Taking the logarithm of both sides gave:
$$ m \log \sigma + \log N = \log C $$
where $\sigma$ is the stress amplitude, $N$ is the number of cycles to failure, and $m$ and $C$ are material constants. The cumulative damage was calculated as:
$$ D = \sum_{i=1}^{n} \frac{n_i}{N_i} $$
where $n_i$ is the number of cycles at stress level $i$ and $N_i$ is the fatigue life at that stress level. Failure was assumed to occur when $D \ge 1$. I used the Goodman mean stress correction in the fatigue analysis. The dynamic meshing force histories with and without residual stress were used as load spectra. Two load cases were considered: load case 1 and load case 2. The fatigue life results are summarized in Table 4.
| Load case | Residual stress | Logarithmic fatigue life | Actual cycles |
|---|---|---|---|
| Load 1 | Without | 5.565 | 367,282 |
| Load 1 | With | 5.991 | 979,489 |
| Load 2 | Without | 5.666 | 463,446 |
| Load 2 | With | 6.103 | 1,267,651 |
I found that the fatigue life decreased as the load fluctuation became more severe. The low-fatigue-life regions appeared not only on the tooth surface but also near the tooth root. The low-fatigue-life region under load case 1 was larger than that under load case 2. When residual stress was considered, the fatigue life of the helical gears increased significantly. Under load case 2, the minimum fatigue life without residual stress was 5.666 in logarithmic scale, while with residual stress it was 6.103. This indicates that quenching residual stress, especially compressive residual stress on the tooth surface and root, greatly improves the fatigue life of helical gears. I also found that the influence of dynamic meshing force on fatigue life was smaller than the influence of residual stress. Therefore, both residual stress and dynamic load should be considered in the fatigue analysis of helical gears.
7. Crack Propagation in Helical Gears Under Quenching Residual Stress
I used FRANC3D and Abaqus to analyze the crack propagation behavior of helical gears. The crack was inserted at the tooth root, where the maximum stress occurred. I assumed that the material was homogeneous, continuous, and isotropic, and that no initial defects existed except for the inserted crack. An elliptical crack with a short-axis radius of 0.5 mm and a long-axis radius of 1 mm was inserted. The crack propagation was driven by the stress intensity factor. The M-integral was used to calculate the stress intensity factors:
$$ M^{(1,2)} = \frac{1-\nu^2}{E} K_I^{(1)} K_I^{(2)} + \frac{1-\nu^2}{E} K_{II}^{(1)} K_{II}^{(2)} + \frac{1+\nu}{E} K_{III}^{(1)} K_{III}^{(2)} $$
where $K_I$, $K_{II}$, and $K_{III}$ are the stress intensity factors for opening, sliding, and tearing modes, respectively. The crack growth rate was calculated using the Paris law:
$$ \frac{da}{dN} = C (\Delta K)^n $$
where $a$ is the crack length, $N$ is the number of cycles, $C$ and $n$ are material constants, and $\Delta K$ is the equivalent stress intensity factor range. For 20CrMnTi steel, I used $C = 1.16 \times 10^{-2}$ and $n = 1.5$. The fracture toughness was 128 MPa·m$^{1/2}$. The crack front was advanced by a fixed increment of 0.1 mm at the midpoint. The new crack front was fitted with a third-order polynomial to maintain smoothness.
I found that the opening mode stress intensity factor $K_I$ was much larger than $K_{II}$ and $K_{III}$. Therefore, the crack propagation was dominated by the opening mode. As the crack propagated, $K_I$ increased, and the increase became faster in the later propagation steps. The distribution of $K_I$ along the crack front was larger at both ends and smaller in the middle. The maximum value was not on the gear surface but at a subsurface location. The stress intensity factor $K_{II}$ was initially positive on one side and negative on the other, but it approached zero as the crack propagated. The stress intensity factor $K_{III}$ decreased from a positive value to a negative value as the crack propagated. The crack growth in the tooth surface direction was faster than in the depth direction.
I compared the crack propagation behavior with and without residual stress. In the first propagation step, the residual stress reduced the stress intensity factor at both ends of the crack front, indicating that the compressive residual stress near the tooth surface inhibited crack initiation and early propagation. However, as the crack propagated deeper, the crack tip moved beyond the compressive residual stress zone. The tensile residual stress in the tooth core accelerated crack propagation. Therefore, the influence of quenching residual stress on crack propagation is twofold: it directly affects the stress intensity factor, and it also changes the load fluctuation. The fatigue crack propagation life with residual stress was slightly longer than that without residual stress in the early stages, but the difference decreased in the later stages. The final number of cycles increased from 133,215 to 136,013, an increase of 2.1%.
| Condition | Final cycles without residual stress | Final cycles with residual stress | Increase |
|---|---|---|---|
| Baseline crack propagation | 133,215 | 136,013 | 2.1% |
| Stress ratio 0.10 | 133,215 | — | — |
| Stress ratio 0.15 | 144,595 | — | 8.0% |
I also investigated the effect of the stress ratio on crack propagation. The stress ratio $R$ is defined as the ratio of the minimum load to the maximum load. I considered $R = 0.1$, $R = 0.15$, and $R = 0.2$. As the stress ratio increased, the equivalent stress intensity factor range $\Delta K$ decreased, and the number of cycles to failure increased. The effect of the stress ratio was most pronounced near the tooth surface. This indicates that the load fluctuation caused by quenching residual stress accelerates crack propagation, especially for cracks close to the surface. When the stress ratio increased from 0.1 to 0.15, the crack propagation life increased from 133,215 cycles to 144,595 cycles, an increase of 8%. Therefore, the dynamic load fluctuation induced by quenching residual stress has a strong influence on the fatigue crack propagation life of helical gears.
8. Summary of Findings
I can summarize my major findings as follows. First, the quenching process of helical gears produces a residual stress field with compressive stress on the tooth surface and tensile stress in the tooth core. The tooth root experiences even larger compressive residual stress than the tooth surface. Second, the time-varying meshing stiffness of helical gears is affected by residual stress in a non-monotonic way. The stiffness increases in some regions and decreases in others within one meshing cycle, and the peaks and valleys are amplified. Third, the dynamic meshing force of helical gears increases when residual stress is considered. The peak normal meshing force increases by 8.47%, and the impact phenomenon becomes more severe. The frequency spectra show that the rotational frequency and meshing frequency amplitudes increase, with the meshing frequency changing more significantly. Fourth, the residual stress reduces the tooth surface Mises stress, contact stress, and contact force. It also reduces the elastic deformation during meshing. The tooth root stress is reduced even more significantly. Fifth, the fatigue life of helical gears is improved by quenching residual stress. The influence of residual stress on fatigue life is greater than the influence of dynamic meshing force. Sixth, the crack propagation in helical gears is dominated by the opening mode. The crack grows faster along the tooth surface direction than in the depth direction. The maximum crack growth rate occurs at a subsurface location. The compressive residual stress near the surface inhibits crack propagation, while the tensile residual stress in the core accelerates it. The stress ratio also affects crack propagation, and the load fluctuation caused by residual stress accelerates crack growth.
My study demonstrates that quenching residual stress must be considered in the dynamic analysis and fatigue life prediction of helical gears. The residual stress changes the time-varying meshing stiffness, which in turn changes the dynamic meshing force and vibration response. The residual stress also directly affects the stress state at the tooth surface and root, which changes the fatigue life and crack propagation behavior. Therefore, a comprehensive analysis of helical gears under quenching residual stress should include the coupled effects of thermal stress, transformation stress, time-varying meshing stiffness, dynamic load, and fatigue damage. In my future work, I plan to consider other surface strengthening processes such as carburizing and shot peening, include the influence of bearings and shafts, and account for material property degradation during fatigue. These extensions will provide a more complete understanding of the service performance of helical gears under complex operating conditions.