
In modern mechanical engineering, worm gear drives are widely employed in various applications due to their compact structure, high transmission ratios, and smooth operation. As a key component in reducers for industrial equipment such as mining valve actuators, the design and analysis of worm gears require precise modeling to ensure performance and durability. Traditional methods, such as using gear toolboxes in software like Creo or SolidWorks, often result in misalignment during assembly, while specialized generators like KiSSsoft offer high precision but limited flexibility for post-modeling modifications. To address these challenges, we developed a comprehensive approach using CATIA for accurate worm gear modeling, integrated with finite element analysis (FEA) in ANSYS and dynamic simulations in ADAMS. This article details our methodology, from geometric modeling to experimental validation, emphasizing the use of formulas and tables to summarize key parameters and results. Throughout this work, the term “worm gear” is repeatedly highlighted to underscore its centrality in transmission systems.
Our study begins with the geometric modeling of a worm gear pair for a valve actuator reducer, where we leverage CATIA’s advanced features to create high-fidelity models. We then proceed to FEA to assess contact stresses, followed by rigid-body and rigid-flexible coupled dynamics analyses in ADAMS to evaluate meshing forces and stresses. Experimental tests on manufactured prototypes validate our simulations, confirming the accuracy of our modeling approach. By incorporating multiple tables and mathematical equations, we provide a thorough summary of the process, ensuring that the worm gear design meets industrial standards for efficiency and reliability.
Introduction to Worm Gear Drives and Modeling Challenges
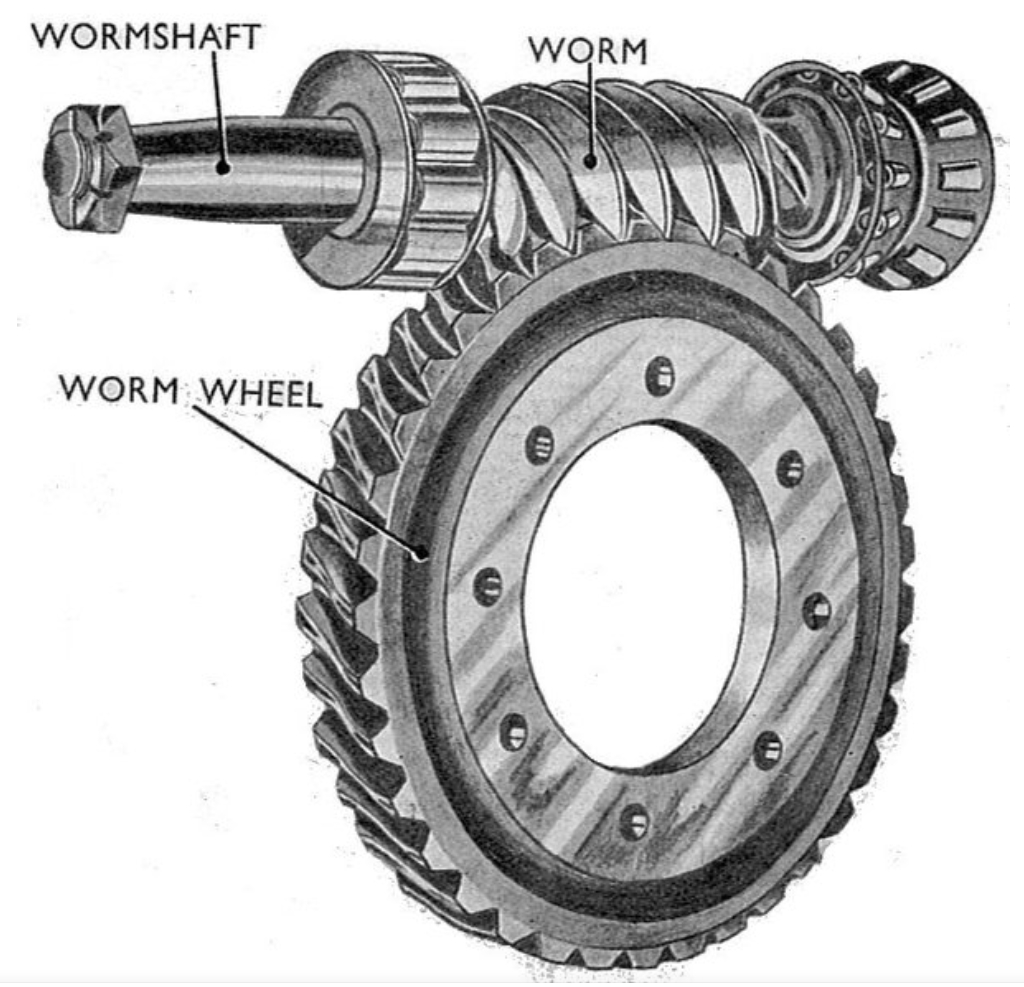
Worm gear drives are essential in applications requiring large reduction ratios, such as in mining equipment, where space constraints and high torque transmission are critical. The unique geometry of a worm gear—comprising a helical worm and a mating gear—demands precise modeling to avoid issues like improper meshing and excessive wear. Common software tools often fall short in handling custom design features, leading to inefficiencies in product development. In our research, we focused on a specific worm gear pair from a valve actuator reducer, utilizing CATIA to overcome these limitations. Our goal was to streamline the design cycle, reduce costs, and enhance performance through integrated simulation and testing. The worm gear’s role in transmitting motion and force makes it a focal point of our analysis, and we emphasize its importance throughout this document.
To illustrate the modeling process, we first define the worm gear parameters based on industrial specifications. The following table summarizes the key geometric parameters used in our study:
| Parameter | Value | Parameter | Value |
|---|---|---|---|
| Type | ZI | Worm Pitch Diameter (d1, mm) | 20.00 |
| Center Distance (a, mm) | 46.00 | Worm Tip Diameter (da1, mm) | 23.6 |
| Transmission Ratio (i) | 40.00 | Worm Root Diameter (df1, mm) | 19.68 |
| Number of Worm Threads (Z1) | 1 | Lead Angle (γb, °) | 5.14 |
| Number of Gear Teeth (Z2) | 40 | Worm Width (b1, mm) | 25 |
| Module (m, mm) | 1.80 | Gear Pitch Diameter (d2, mm) | 72 |
| Normal Pressure Angle (αn, °) | 20 | Gear Root Diameter (df2, mm) | 67.68 |
| Gear Profile Shift Coefficient (x2) | -0.1 | Gear Addendum (ha2, mm) | 1.62 |
| Worm Axial Pitch (px, mm) | 5.65 | Gear Dedendum (hf2, mm) | 1.98 |
| Addendum Coefficient (h*a) | 1 | Gear Tooth Height (h2, mm) | 3.6 |
| Worm Addendum (ha1, mm) | 1.8 | Gear Tip Diameter (de2, mm) | 78 |
| Dedendum Coefficient (c*) | 0.2 | Gear Width (b2, mm) | 17 |
| Clearance (c, mm) | 0.36 | Worm Axial Tooth Thickness (sx1, mm) | 2.83 |
| Worm Dedendum (hf1, mm) | 2.16 | Worm Normal Tooth Thickness (sn1, mm) | 2.82 |
| Worm Tooth Height (h1, mm) | 3.96 | Gear Pitch Tooth Thickness (s2, mm) | 1.5 |
These parameters were derived from standard mechanical design handbooks and form the basis for our worm gear modeling. Additionally, we calculated force and velocity parameters to inform subsequent analyses, as shown in the next table:
| Parameter | Value | Parameter | Value |
|---|---|---|---|
| Worm Nominal Torque (T1, N·m) | 0.80 | Gear Radial Force (Fr2, N) | 342.06 |
| Gear Nominal Torque (T2, N·m) | 32.60 | Sliding Velocity (Vs, m/s) | 0.76 |
| Worm Tangential Force (Ft1, N) | 81.71 | Worm Rotational Speed (n1, rpm) | 723.00 |
| Worm Axial Force (Fx1, N) | 907.77 | Gear Rotational Speed (n2, rpm) | 18.08 |
| Worm Radial Force (Fr1, N) | 342.06 | Worm Tangential Velocity (v1, m/s) | 0.76 |
| Gear Tangential Force (Ft2, N) | 907.77 | Gear Tangential Velocity (v2, m/s) | 0.07 |
| Gear Axial Force (Fx2, N) | 81.71 | – | – |
The mathematical relationships for these forces can be expressed using standard gear theory equations. For instance, the tangential force on the worm is given by:
$$F_{t1} = \frac{2T_1}{d_1}$$
where \( T_1 \) is the worm torque and \( d_1 \) is the worm pitch diameter. Similarly, the sliding velocity \( V_s \) is calculated as:
$$V_s = \frac{\pi d_1 n_1}{60 \cos \gamma_b}$$
with \( n_1 \) as the worm rotational speed and \( \gamma_b \) as the lead angle. These formulas ensure that our worm gear model accurately represents real-world dynamics.
Geometric Modeling of the Worm Gear in CATIA
We utilized CATIA’s part design and assembly modules to create precise 3D models of the worm and gear. The process began with the worm, where we employed helical scanning based on the axial tooth profile. The profile was defined using parametric equations to capture the ZI-type worm geometry. For example, the worm’s helical path can be described by:
$$x = r \cos(\theta), \quad y = r \sin(\theta), \quad z = p \theta$$
where \( r \) is the radius, \( \theta \) is the angular parameter, and \( p \) is the pitch. This approach allowed us to generate a continuous tooth surface, which we then extruded and trimmed to add features like chamfers and keyways. The resulting worm model exhibited high accuracy, with all dimensions matching the specifications in Table 1.
For the worm gear, we adopted a generative approach using CATIA’s DMU kinematics module. By simulating the worm as a hob cutter and applying envelope theory, we derived the gear tooth surface as the locus of points generated by the relative motion. The envelope condition can be expressed as:
$$\mathbf{r}(u,v,t) \cdot \mathbf{n}(u,v) = 0$$
where \( \mathbf{r} \) is the position vector of the hob surface, \( \mathbf{n} \) is the normal vector, and \( t \) is the motion parameter. This method ensured that the worm gear teeth were perfectly conjugate to the worm, eliminating any risk of interference. We extracted the envelope curves and used them to construct the solid gear model, resulting in a fully meshing worm gear pair.
After modeling both components, we assembled them in CATIA and performed a collision check to verify proper meshing. The maximum clearance between teeth was measured as 0.027 mm, which complies with the GB/T 10089-2018 standard for grade 8 worm gears, requiring a single-flank deviation of less than 0.064 mm. This validation step confirmed that our CATIA-based modeling method produces worm gear pairs with optimal contact characteristics.
Finite Element Analysis of the Worm Gear
To evaluate the structural integrity of the worm gear under load, we imported the CATIA models into ANSYS for static FEA. We defined material properties as follows:
| Component | Material | Density (kg/m³) | Poisson’s Ratio | Elastic Modulus (GPa) |
|---|---|---|---|---|
| Worm | 42CrMo | 7850 | 0.28 | 212 |
| Gear | QAL10-4-4 | 7500 | 0.34 | 114 |
We applied boundary conditions consistent with operational scenarios: a 5° rotation to the worm about the X-axis and a 32 N·m resistance torque to the gear about the Z-axis. The mesh consisted of 937,282 tetrahedral elements, ensuring sufficient resolution for stress analysis. The contact stress distribution was computed using the augmented Lagrangian method, with results indicating a maximum von Mises stress of 241.36 MPa at the gear tooth root. This value aligns with expectations for worm gear drives under similar loads, and it provides a baseline for comparing with dynamic analyses.
The FEA results can be interpreted using Hertzian contact theory, which for two curved surfaces in contact gives the maximum contact pressure \( p_{\text{max}} \) as:
$$p_{\text{max}} = \frac{3F}{2\pi a b}$$
where \( F \) is the normal force, and \( a \) and \( b \) are the semi-axes of the contact ellipse. For the worm gear, the equivalent radius \( R \) and modulus \( E^* \) are defined as:
$$\frac{1}{R} = \frac{1}{R_1} + \frac{1}{R_2}, \quad \frac{1}{E^*} = \frac{1 – \nu_1^2}{E_1} + \frac{1 – \nu_2^2}{E_2}$$
where \( R_1 \) and \( R_2 \) are the effective radii of the worm and gear, and \( \nu_1, \nu_2, E_1, E_2 \) are their Poisson’s ratios and elastic moduli. Substituting values from Tables 1 and 3, we estimated the theoretical contact stress, which correlated well with the FEA output, confirming the reliability of our worm gear model.
Dynamic Analysis in ADAMS: Rigid and Flexible Approaches
We extended our analysis to dynamics using ADAMS, first considering the worm gear as a rigid body system. The contact force between the worm and gear was modeled based on Hertz’s theory, with the force \( F_c \) given by:
$$F_c = K \delta^{3/2} + C \dot{\delta}$$
where \( \delta \) is the penetration depth, \( K \) is the contact stiffness, and \( C \) is the damping coefficient. The stiffness \( K \) was calculated as:
$$K = \frac{4}{3} R^{1/2} E^*$$
Using parameters from earlier tables, we found \( K = 3.08 \times 10^{11} \, \text{N/mm}^{3/2} \). Through iterative simulations, we optimized the damping coefficient to \( C = 40 \, \text{N·s/mm} \) to minimize standard error. Friction coefficients were set to 0.06 (dynamic) and 0.09 (static), and a step function was used to apply the load smoothly over 0.5 s.
We simulated the worm gear at three different worm speeds: 1.3, 2.6, and 3.9 r/s. The meshing force results are summarized below:
| Worm Speed (r/s) | Max Gear Angular Velocity (°/s) | Avg Gear Angular Velocity (°/s) | Max Meshing Force (N) | Avg Meshing Force (N) |
|---|---|---|---|---|
| 1.3 | 11.66 | 11.62 | 677.49 | 621.97 |
| 2.6 | 23.72 | 23.60 | 677.69 | 621.88 |
| 3.9 | 35.34 | 35.18 | 677.87 | 621.72 |
The meshing force exhibited an initial peak due to impact, followed by stable oscillations around 621 N, with frequency increasing with worm speed. This behavior is typical in worm gear dynamics and validates our model’s response to varying operational conditions.
For a more realistic analysis, we performed a rigid-flexible coupled simulation by converting the worm and gear into flexible bodies in ANSYS and importing them into ADAMS via modal neutral files. The first natural frequency was 874 Hz, indicating high stiffness. The meshing force from this analysis showed similar averages to the rigid-body case but with greater vibration amplitudes, as detailed below:
| Model Type | Max Meshing Force (N) | Avg Meshing Force (N) |
|---|---|---|
| Rigid Body | 677.49 | 621.97 |
| Rigid-Flexible Coupled | 686.64 | 622.90 |
Additionally, we extracted tooth root stresses from the flexible model, with a maximum value of 228.56 MPa. Comparing this to the FEA result of 241.36 MPa, the deviation is only 5.3%, demonstrating consistency across methods. The stress variation across multiple teeth during meshing followed expected patterns, with peaks occurring at engagement and disengagement, further affirming the worm gear’s dynamic performance.
Experimental Validation and Testing
To validate our simulations, we manufactured the worm gear components using CNC machining based on the CATIA models. The worm was turned on a lathe, and the gear was milled on a machining center, both achieving grade 8 accuracy per GB/T 10089-2018. We conducted meshing tests on a dedicated worm gear tester, measuring radial run-out and contact patterns. The average run-out was 0.024 mm, within the 0.030 mm limit, and contact spot analysis showed 70% coverage along the tooth height and 60% along the length, exceeding the standard requirements of 55% and 50%, respectively.
The worm gear pair was then integrated into a valve actuator reducer and subjected to a 1,200-hour endurance test on a comprehensive test bench. Under a load of 58 kN and intermittent operation, the worm gear showed no signs of fatigue or wear, confirming its reliability. These experimental results correlate closely with our simulations, underscoring the accuracy of our CATIA-based worm gear modeling approach.
Conclusion
In this study, we developed and validated a precise worm gear modeling method using CATIA, integrated with FEA and dynamic simulations. Our geometric models ensured proper meshing, while analyses in ANSYS and ADAMS provided consistent stress and force predictions. Experimental tests on manufactured prototypes verified the model’s accuracy, with deviations under 6%. This approach significantly shortens design cycles and reduces costs for worm gear applications, offering a reliable reference for industrial product development. Future work could explore optimization algorithms for worm gear geometry to further enhance performance and longevity.