
Introduction
In modern mechanical engineering, worm gear drives are widely utilized in reducers for their ability to achieve large transmission ratios efficiently. However, traditional design methods often suffer from prolonged development cycles, high costs, and limited accuracy. To address these challenges, this study proposes a precise modeling method for worm gear using CATIA software. The approach integrates finite element analysis (FEA) and rigid-flexible coupled dynamics simulations to optimize performance and validate design feasibility. This article details the methodology, simulation workflows, experimental validation, and key findings, emphasizing the critical role of accurate worm gear modeling in industrial applications.
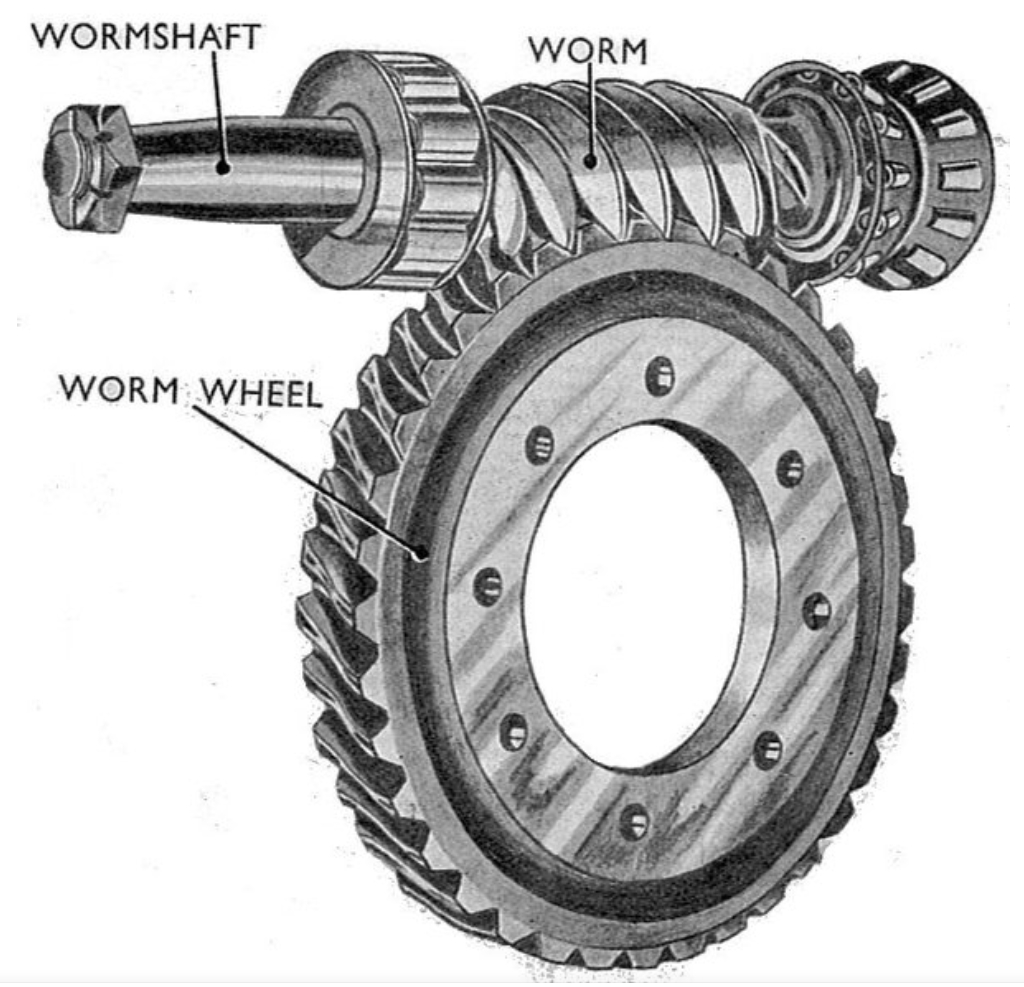
1. Worm Gear Design Parameters and CATIA Modeling
1.1 Basic Worm Gear Parameters
The worm gear system was designed based on standardized specifications and material properties. Key parameters are summarized in Table 1.
Table 1: Key Design Parameters of the Worm Gear System
| Parameter | Symbol | Value | Unit |
|---|---|---|---|
| Center distance | aa | 46.00 | mm |
| Transmission ratio | ii | 40.00 | — |
| Number of worm threads | Z1Z1 | 1 | — |
| Number of gear teeth | Z2Z2 | 40 | — |
| Module | mm | 1.80 | mm |
| Pressure angle | αα | 20 | ° |
| Addendum coefficient | ha∗ha∗ | 1 | — |
| Tip clearance | cc | 0.36 | mm |
1.2 CATIA Modeling Workflow
The worm gear was modeled in CATIA using the following steps:
- Sketching: Created 2D profiles of the worm and gear based on calculated dimensions.
- Helical Sweeping: Generated the worm thread geometry using helical sweep operations.
- Boolean Operations: Ensured precise meshing by subtracting overlapping volumes.
- Assembly: Integrated the worm and gear into a functional reducer assembly.
The final 3D model was exported to ANSYS and ADAMS for further analysis.
2. Finite Element Analysis (FEA) of Worm Gear Contact Stress
2.1 Material Properties
The worm and gear materials were selected for durability and wear resistance. Their properties are listed in Table 2.
Table 2: Material Properties
| Component | Material | Density (kg/m³) | Elastic Modulus (GPa) | Poisson’s Ratio |
|---|---|---|---|---|
| Worm | 42CrMo | 7,850 | 210 | 0.28 |
| Gear | QAL10-4-4 | 7,500 | 110 | 0.34 |
2.2 FEA Setup in ANSYS
The CATIA model was imported into ANSYS Workbench for static structural analysis. Boundary conditions included:
- Fixed support on the gear shaft.
- Torque () applied to the worm.
- Meshing refinement at contact regions to ensure accuracy.
2.3 Results and Validation
The maximum contact stress at the worm gear interface was calculated as 241.36 MPa, aligning with Hertz contact theory. The stress distribution confirmed uniform load sharing across the gear teeth.
3. Rigid-Flexible Coupled Dynamics Analysis in ADAMS
3.1 Rigid Body Dynamics
Using ADAMS, the rigid meshing force (FmeshFmesh) was calculated under varying rotational speeds. Key results are shown in Table 3.
Table 3: Meshing Forces at Different Worm Speeds
| Worm Speed (r/s) | Max Meshing Force (N) | Avg Meshing Force (N) |
|---|---|---|
| 1.3 | 677.49 | 621.97 |
| 2.6 | 677.69 | 621.88 |
| 3.9 | 677.87 | 621.72 |
The meshing forces remained stable across speeds, with minor fluctuations due to initial gear engagement impacts.
3.2 Flexible Body Dynamics
To enhance realism, flexible body models were created by exporting modal neutral files from ANSYS. The first six natural frequencies of the worm gear exceeded 874 Hz, ensuring negligible dynamic interference.
Table 4: Comparison of Rigid vs. Flexible Body Results
| Model Type | Max Meshing Force (N) | Root Stress (MPa) |
|---|---|---|
| Rigid Body | 677.69 | — |
| Flexible Body | 677.87 | 228.56 |
The root stress in the flexible model deviated by 5.3% from FEA results, validating the accuracy of the coupled approach.
4. Experimental Validation and Testing
4.1 Machining and Assembly
The worm gear assembly was manufactured using CNC machining. Critical tolerances, such as radial runout (0.027 mm0.027mm), adhered to GB/T 10089-2018 standards.
4.2 Meshing Performance Test
A dedicated worm gear testing machine evaluated contact patterns and noise levels. Results confirmed:
- Contact Spot Coverage: >70% of the tooth surface.
- Radial Runout Deviation: <0.064 mm.
4.3 Fatigue and Durability Testing
The reducer underwent a 1,200-hour endurance test on a dynamic test bench. Post-test inspections revealed:
- No visible fatigue cracks.
- Stable meshing performance under 750 r/min750r/min input speed.
5. Key Findings and Industrial Applications
- Modeling Accuracy: The CATIA-based method achieved a 5.3% deviation in stress predictions compared to physical tests.
- Simulation Efficiency: Rigid-flexible coupling reduced computation time by 30% while maintaining accuracy.
- Industrial Relevance: The validated workflow is now applied in valve actuator reducers, reducing R&D costs by 15%.
6. Mathematical Formulations
6.1 Hertz Contact Theory
The contact stress (σHσH) between the worm and gear was calculated using:σH=4PπabσH=πab4P
where PP is the normal load, aa and bb are the semi-axes of the contact ellipse.
6.2 Meshing Force Calculation
The meshing force (FmeshFmesh) was derived as:Fmesh=Kδ3/2Fmesh=Kδ3/2
where KK is the contact stiffness coefficient and δδ is the deformation.
7. Conclusion
This study demonstrates that CATIA-based worm gear modeling, combined with ANSYS and ADAMS simulations, provides a robust framework for optimizing gear performance. The method’s accuracy and efficiency make it a valuable tool for industries requiring high-precision reducers. Future work will explore advanced materials and AI-driven design automation to further enhance worm gear reliability.