
The drive axle assembly is a critical transmission component in electric vehicles, with its performance and longevity directly impacting vehicle reliability. Fatigue failure of gears under random operational loads represents the predominant failure mode, necessitating accurate fatigue life prediction. This study investigates the fatigue life of electric vehicle gear using theoretical calculations and finite element analysis under standardized and real-world driving conditions.
Fatigue life estimation employs the nominal stress method and linear cumulative damage theory. The stress-time history is derived from driving resistance equations using the China Light-Duty Vehicle Test Cycle-Passenger (CLTC-P) as speed input. The driving resistance equation is expressed as:
$$F_t = F_f + F_w + F_i + F_j$$
$$F_f = mgf \cos\alpha; \quad F_w = \frac{C_DAu_a^2}{21.15}; \quad F_i = mg \sin\alpha; \quad F_j = \delta m \frac{du}{dt}$$
where $F_f$, $F_w$, $F_i$, and $F_j$ denote rolling, aerodynamic, gradient, and acceleration resistance respectively. Input torque $T_{tq}$ for the electric vehicle gear is calculated as:
$$T_{tq} = \frac{r}{\eta i_0} \left( mgf + mgi + \frac{C_DAu_a^2}{21.15} + \delta m \frac{du}{dt} \right)$$
Contact stress for helical gears is computed using:
$$\sigma_H = Z_H Z_E Z_{\varepsilon\beta} \sqrt{\frac{F_t}{b d_1} \cdot \frac{u+1}{u} \cdot K_A K_V K_{H\beta} K_{H\alpha}$$
where $Z_H$, $Z_E$, and $Z_{\varepsilon\beta}$ are zone, elasticity, and contact ratio coefficients. The Gear Counting Method (GCM) processes stress-time histories into amplitude-mean-frequency matrices:
$$GCM = \begin{bmatrix}
\frac{\sigma_1}{2} & \frac{\sigma_2}{2} & \cdots & \frac{\sigma_n}{2} \\
n_0 \Delta t_1 & n_0 \Delta t_2 & \cdots & n_0 \Delta t_n
\end{bmatrix}$$
Goodman mean stress correction converts stresses to equivalent fully-reversed values:
$$\sigma_{eq} = \frac{\sigma_{-1} \cdot \sigma_a}{\sigma_{-1} – \sigma_m \left( \frac{\sigma_{-1}}{\sigma_b} – 1 \right)}$$
Material S-N curves for 20CrMnTi steel (Table 1) are modified for electric vehicle gear applications considering stress concentration, size, and surface finish effects:
$$K_f = 1 + q(K_t – 1); \quad q = \frac{1}{1 + \sqrt{\rho’ / \rho}}; \quad K_{\sigma D} = \frac{K_f}{\varepsilon \beta_1}$$
| Survival Rate (%) | a | b | Fatigue Limit (MPa) | Specified Life (cycles) |
|---|---|---|---|---|
| 99 | 102.0343 | -28.5714 | 2003 | 5E7 |
Field testing captured real-world driving profiles using XW-ADU5600 navigation systems. Vehicle speed was calculated from kinematic data:
$$V = 3.6 \times \sqrt{V_e^2 + V_n^2 + V_u^2}$$
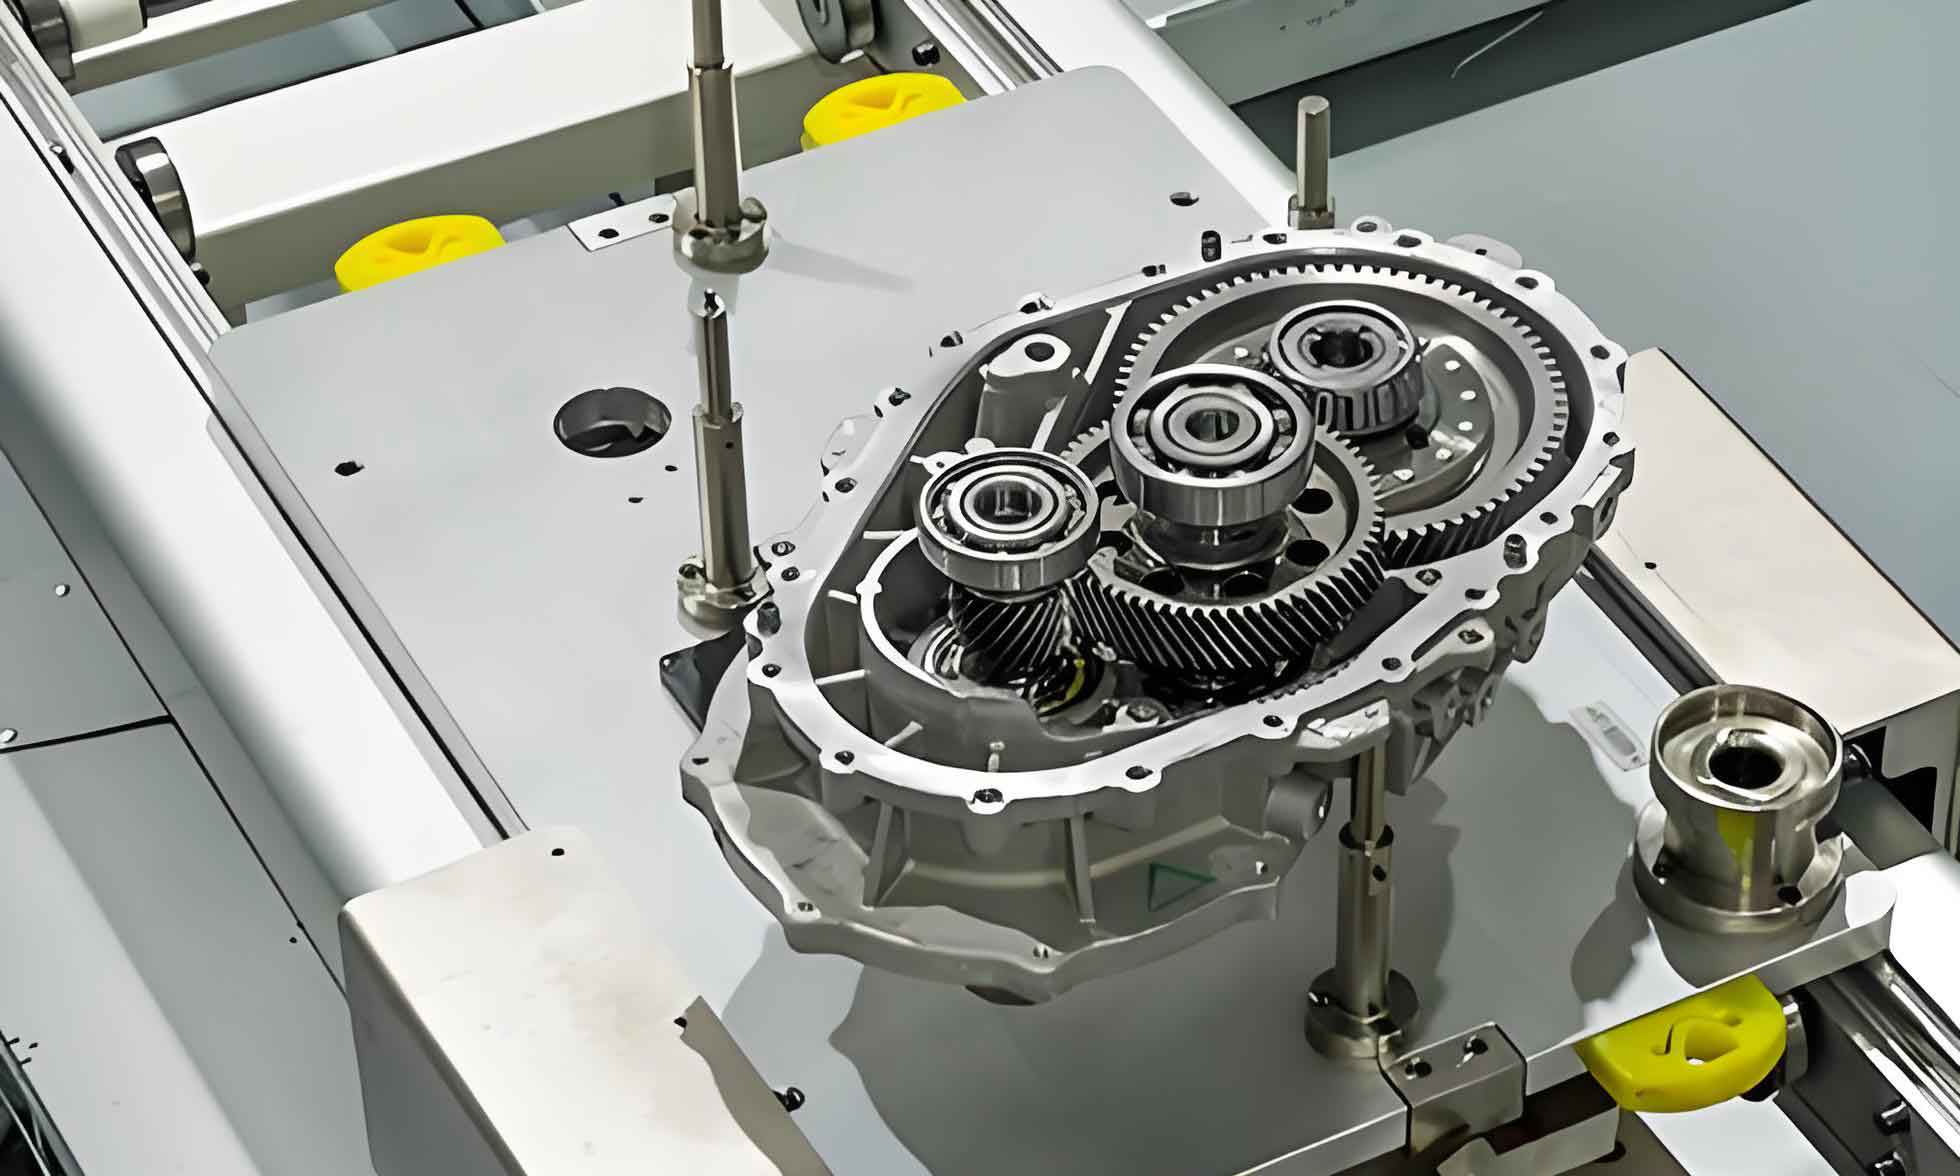
Parameterized gear modeling in CATIA enabled finite element analysis. Static contact stress simulations in ANSYS/Workbench (Figure) informed nCode DesignLife fatigue analysis. The damage accumulation follows:
$$D = \sum_{i=1}^{k} \frac{n_i}{N_i}; \quad N_{\text{life}} = \frac{1}{D}$$
Fatigue life results comparison reveals:
| Method | Driving Cycle | Fatigue Life (km) | Deviation |
|---|---|---|---|
| Theoretical | CLTC-P | 482,000 | – |
| FEA | CLTC-P | 494,000 | +2.5% |
| FEA | Measured | 458,000 | -5.0% |
The methodology demonstrates viability for electric vehicle gear design validation. Future work should incorporate direct torque measurement and experimental S-N curves for enhanced accuracy in predicting electric vehicle gear durability under complex loading spectra.