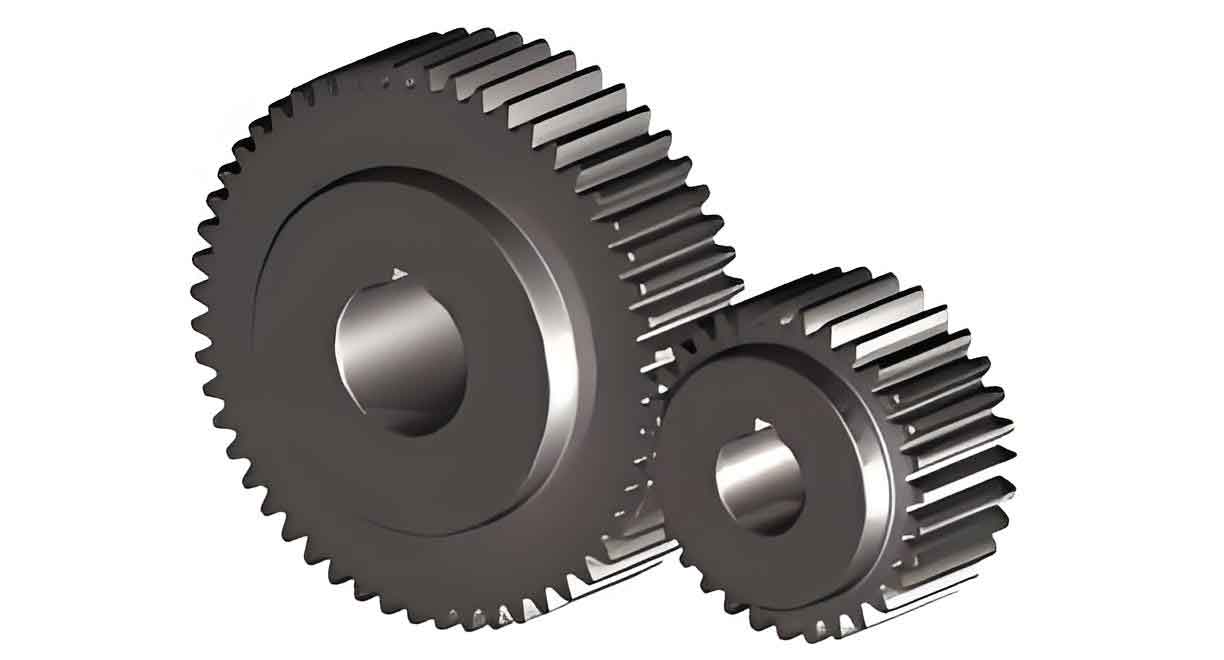
This study investigates the surface quality enhancement of 20CrMnTi steel spur gears through gear hobbing and shot peening processes. Combining experimental tests and finite element simulations, the effects of machining parameters on surface roughness, microhardness, and residual stress distribution are systematically analyzed.

Experimental Analysis of Gear Hobbing
The hobbing experiments revealed significant parameter-dependent effects on power consumption and surface characteristics. Table 1 summarizes the relationship between cutting parameters and surface roughness:
| Spindle Speed (rpm) | Feed Rate (mm/rev) | Surface Roughness Ra (μm) |
|---|---|---|
| 165 | 0.47 | 0.392 |
| 165 | 1.20 | 0.742 |
| 275 | 1.20 | 0.589 |
The cutting power consumption followed the relationship:
$$P = 1828.3 + 161.2 \left(\frac{f}{1.2}\right)$$
where \( f \) represents feed rate. Microhardness measurements showed surface hardening effects ranging from 233.1 HV to 249.4 HV, significantly higher than the base material’s 195.6 HV.
Finite Element Simulation of Hobbing Process
DEFORM-based simulations revealed the chip formation mechanism and stress distribution patterns. The Johnson-Cook constitutive model effectively described material behavior:
$$\sigma = \left[1241 + 622\varepsilon^{0.6522}\right]\left[1 + 0.0134\ln\left(\frac{\dot{\varepsilon}}{1}\right)\right]$$
Key simulation findings include:
- Maximum cutting force variation: 1,200-1,550 N
- Equivalent stress concentration: 1,300-1,580 MPa
- Chip thickness correlation: \( h = 0.47f + 0.12v \)
Shot Peening Modeling and Parameter Analysis
ABAQUS simulations with Python-generated random impact patterns revealed significant parameter effects:
| Velocity (m/s) | Surface Stress (MPa) | Max Stress Depth (mm) |
|---|---|---|
| 40 | -636 | 0.06 |
| 80 | -710 | 0.08 |
The surface roughness evolution followed:
$$R_a = 0.113v + 0.8 \quad (R^2=0.9847)$$
$$R_{pv} = 0.654v + 2.58 \quad (R^2=0.9745)$$
where \( v \) represents peening velocity. Double-shot peening demonstrated surface roughness reduction up to 8.2% compared to single-stage processing.
Experimental Validation
Surface roughness measurements confirmed simulation accuracy:
| Peening Velocity (m/s) | Simulated Ra (μm) | Experimental Ra (μm) |
|---|---|---|
| 40 | 4.0 | 4.24 |
| 50 | 4.6 | 4.49 |
The research establishes optimal parameter combinations for spur gear manufacturing:
- Hobbing: 275 rpm spindle speed with 0.47 mm/rev feed rate
- Shot peening: 80 m/s velocity using 0.4 mm diameter media at 300% coverage
These findings provide theoretical guidance for improving spur gear performance through surface quality optimization, demonstrating the effectiveness of combined experimental and numerical approaches in gear manufacturing research.
