
Introduction
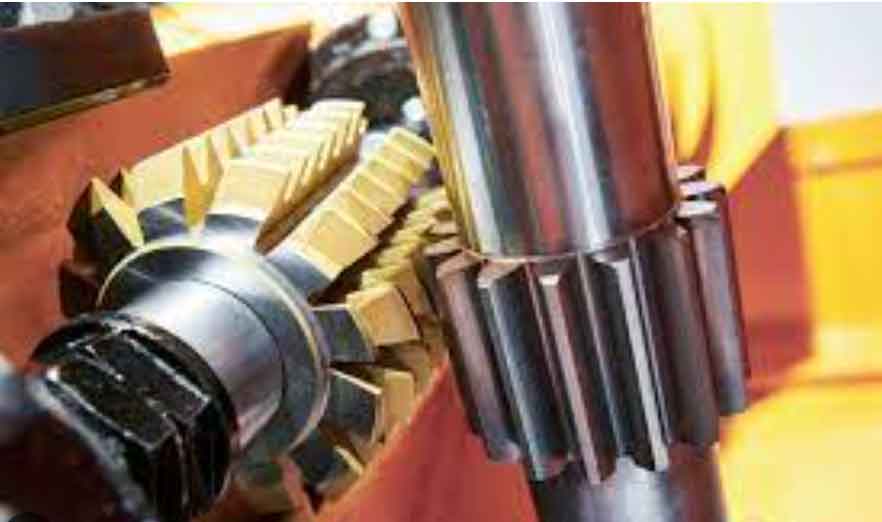
Gear transmission systems are critical in automotive machinery, where spur gears play a pivotal role in transmission quality, power loss, lifespan, and noise control. Surface quality of gears directly impacts fatigue life, with 20CrMnTi steel being widely used due to its high impact load capacity and wear resistance. Gear hobbing dominates roughing/semi-finishing processes for its efficiency, yet surface quality variations from hobbing parameters and subsequent shot peening significantly affect performance. This study integrates experimental and finite element methods to optimize gear hobbing and shot peening parameters, enhancing surface integrity.
Experimental Study on Gear Hobbing
Hobbing trials used 20CrMnTi steel (Table 1) on a HI-008 hobbing machine with W6542 HSS tools (Table 2). Parameters varied were hob speed (165–275 rpm) and feed rate (0.47–1.2 mm/rev). Power consumption was measured using clamp ammeters and multimeters, surface roughness via 2302A profilometer (sampling length: 0.8 mm), and microhardness via HV-1000A tester (1 kg load).
| Element | C | Si | Mn | Cr | S | P | Ni | Ti |
|---|---|---|---|---|---|---|---|---|
| Wt. % | 0.18 | 0.28 | 0.93 | 1.12 | 0.007 | 0.010 | 0.0045 | 0.065 |
| Property | Density (kg/m³) | Elastic Modulus (GPa) | Thermal Expansion (1/°C) | Poisson’s Ratio | Hardness (HB) | |||
| Value | 7800 | 200 | 5×10⁻⁶ | 0.3 | ≤217 | |||
| Hob Parameters | Gear Parameters | ||
|---|---|---|---|
| Module (mm) | 3 | Module (mm) | 3 |
| Pressure Angle (°) | 20 | Pressure Angle (°) | 20 |
| Outer Diameter (mm) | 70 | Number of Teeth | 23 |
| Length (mm) | 60 | Face Width (mm) | 30 |
Key Findings:
- Power consumption rose with hob speed (ΔP = 152.6 W at 275 rpm vs. 110.6 W at 165 rpm) and feed rate (ΔP = 161.2 W at 1.2 mm/rev vs. 96.1 W at 0.47 mm/rev).
- Surface roughness increased with feed rate (Ra = 0.742 μm at 1.2 mm/rev vs. 0.392 μm at 0.47 mm/rev) but decreased with hob speed (Ra = 0.589 μm at 275 rpm vs. 0.742 μm at 165 rpm).
- Microhardness peaked at 249.4 HV (204 rpm, 1.2 mm/rev), exceeding the base material (195.6 HV) due to phase transformation (ferrite to fine pearlite).
$$\Delta P = P_{\text{cutting}} – P_{\text{idle}}$$
where \(P_{\text{cutting}}\) is power during cutting and \(P_{\text{idle}}\) is idle power.
Finite Element Simulation of Gear Hobbing
A simplified DEFORM-3D model simulated single-tooth engagement (Fig. 1) using Johnson-Cook constitutive model:
$$\sigma_p = \left[A + B \left(\epsilon_p\right)^n \right] \left[1 + C \ln \left(\frac{\dot{\epsilon}_p}{\dot{\epsilon}_0}\right)\right]$$
where \(A\) = 1241 MPa, \(B\) = 622 MPa, \(n\) = 0.6522, and \(C\) = 0.0134. Chip formation involved primary (downward-curling) and secondary chips from flank engagement. Cutting forces remained stable across speeds (Fig. 2) but increased marginally with feed:
| Hob Speed (rpm) | Feed (mm/rev) | Peak Cutting Force (N) |
|---|---|---|
| 165 | 0.47 | 312 |
| 165 | 1.2 | 338 |
| 275 | 1.2 | 335 |
Equivalent stress distributions were material-dependent, unaffected by parameters. High-speed (275 rpm) and low-feed (0.47 mm/rev) conditions minimized surface roughness while maximizing efficiency.
Shot Peening Simulation Models
Single-Particle Model (ABAQUS): A 2×2×1.5 mm3 target impacted by a rigid sphere simulated impact dynamics. Crater dimensions followed:
$$d_{\text{crater}} = k \cdot v^{0.5} \cdot d^{0.8}$$
where \(d_{\text{crater}}\) is crater diameter, \(v\) is velocity, \(d\) is particle diameter, and \(k\) is a material constant.
Random Multi-Particle Model: Python-generated stochastic distributions ensured coverage (\(C\)) accuracy:
$$C = \left(1 – e^{-\frac{n \pi r^2}{S}}\right) \times 100\%$$
where \(n\) = particle count, \(r\) = crater radius, \(S\) = target area. A 100% coverage required 190 particles (0.4 mm diameter, 80 m/s). Residual stress (\(\sigma_{xx}\)) and PEEQ were averaged across 2,601 nodes per layer.
Random Shot Peening Results
Peening Velocity (40–80 m/s): Surface residual stress (\(\sigma_{\text{surf}}\)) and maximum compressive stress (\(\sigma_{\text{max}}\)) increased linearly with velocity (Fig. 3):
$$\begin{align}
\sigma_{\text{surf}} &= -563.842 – 1.794v \\
\sigma_{\text{max}} &= -776.5 – 5.072v
\end{align}$$
Surface roughness (Ra) rose from 4.0 μm (40 m/s) to 8.4 μm (80 m/s). PEEQ depth increased by 40% (0.20→0.28 mm).
Coverage (100–400%): At 80 m/s, \(\sigma_{\text{max}}\) peaked at -1357.7 MPa (300% coverage) before declining. Ra increased linearly:
$$\begin{align}
\text{Ra} &= 6.45 + 0.0163C \\
\text{Rpv} &= 37.2 + 0.1885C
\end{align}$$
Particle Diameter (0.4–0.8 mm): Optimal \(\sigma_{\text{surf}}\) (-872 MPa) occurred at 0.7 mm. Ra nearly doubled (4.0→7.9 μm) at larger diameters.
Double Peening: Secondary peening (40 m/s, 0.4 mm) after primary (80 m/s, 0.8 mm) reduced Ra by 8.2% (18.4→16.9 μm) and shifted \(\sigma_{\text{max}}\) closer to the surface (0.14→0.08 mm).
Experimental Validation
Shot peening tests (0.4 mm steel grit, 40/50 m/s) confirmed simulation trends (Table 4). Post-peening surfaces showed eliminated hobbing marks and dimples matching simulated morphologies.
| Condition | Simulation | Experiment | Error (%) |
|---|---|---|---|
| 40 m/s | 4.0 | 4.238 | 5.9 |
| 50 m/s | 4.6 | 4.486 | 2.5 |
Conclusion
- Gear hobbing: Low feed (0.47 mm/rev) and high speed (275 rpm) minimized surface roughness (Ra = 0.289 μm). Microhardness increased by 27.5% post-hobbing.
- Shot peening: Velocity ≤70 m/s, coverage ≤300%, and particle diameter ≤0.7 mm optimized residual stresses while limiting Ra to ≤8.4 μm. Secondary peening further reduced roughness by 8.2%.
- Synergistic optimization of gear hobbing and shot peening enhances surface integrity, extending gear fatigue life in transmission systems.