
Spiral bevel gears are widely used in right-angle, high-torque drivetrains because their curved teeth engage gradually, share load across several teeth, and run more quietly than straight bevel gears. The same geometry that smooths torque transmission also concentrates bending and contact stress at the tooth root. In carburized and quenched gears, a second, self-equilibrated stress field remains locked into the material after heat treatment. Whether that quench field accelerates or retards a root crack depends on where the crack front lies relative to the compressive surface layer and the tensile core.
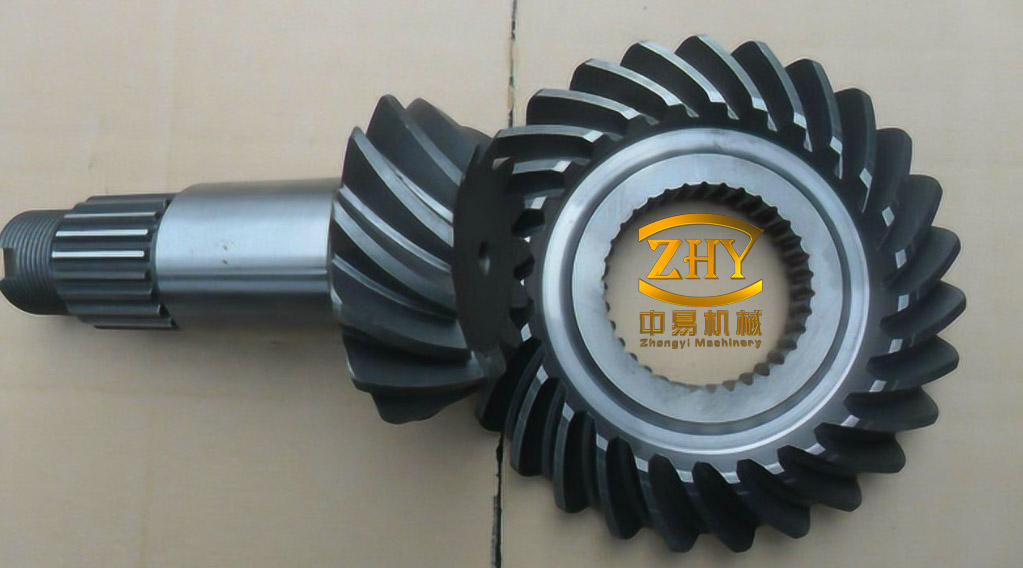
A three-dimensional extended finite element method (XFEM) model of a 20CrMnTi spiral bevel gear pair was used to examine this interaction. The pinion has 18 teeth and meshes with a 34-tooth gear; the main geometry is summarized in Table 1. The steel was represented with a density of 7850 kg/m³, an elastic modulus of 207 GPa, and a Poisson ratio of 0.3. The global mesh used eight-node reduced-integration brick elements, with local refinement in the contact zone. Artificial strain energy was kept below 1% of internal energy to limit hourglassing.
| Parameter | Value |
|---|---|
| Number of teeth, gear / pinion | 34 / 18 |
| Module | 2.117 mm |
| Spiral angle | 35° |
| Shaft angle | 90° |
| Pressure angle | 20° |
Geometry and Critical Tooth
Reference points coupled to the bore surfaces imposed rotation, while all other degrees of freedom were constrained. The gear was driven at 2220 r/min and the pinion carried the load torque. Under this operating condition, the middle pinion tooth experienced the highest root bending stress and the highest contact force. That tooth therefore became the object of the crack analysis. The result is specific to the mesh position and load case; it is not a general rule that the middle tooth of every spiral bevel gear is critical.
The root stress state also defined where a crack would be expected to start. Bending stress peaked near the middle of the root section, and the contact force was largest on the same tooth. This coincidence made the mid-root region the natural initiation site for the subsequent XFEM and stress intensity factor calculations.
Crack Path Under Tooth-Loading
XFEM represents a crack by enriching the displacement field with a Heaviside jump function across the crack faces and with asymptotic crack-tip functions near the front. The crack can therefore advance across element boundaries without remeshing. Four single-pair contact load cases were applied at the highest point of contact, as listed in Table 2.
| Case | Tangential force Ft (N) | Radial force Fr (N) |
|---|---|---|
| 1 | 4000 | 1000 |
| 2 | 5000 | 2000 |
| 3 | 6000 | 2000 |
| 4 | 7000 | 3000 |
The computed path began at the middle of the tooth root, extended first along the tooth face, and then turned into the depth. The face-direction growth rate was higher than the depth-direction rate. The sequence resolved four stages: initiation, stable growth along the face, stable growth in the depth direction, and unstable fracture.
Increasing the load changed the trajectory more than the initiation site. In the lowest-load case, the crack followed a relatively smooth path from the tensile flank toward the compressive flank before final fracture. At the intermediate loads, the path first followed the compressive side and then turned toward the rim; the deviation was larger in case 3 than in case 2. Case 4 produced the largest deviation. In all four cases, however, the crack started near the mid-root and eventually traversed the root section.
Quenching Residual Stress Field
The heat-treatment simulation used a 20CrMnTi gear quenched from 850 °C into oil to 80 °C and then air-cooled. The analysis ran for 500 s, with 200 s in oil and 300 s in air. Convective heat transfer was applied to the exposed surfaces, and two symmetry planes constrained the thermal-mechanical model. The plane-strain fracture toughness of the steel was taken as 128 MPa·m1/2.
Cooling was not uniform. At 4 s, the tooth tip had fallen to 310 °C, while the root and core were still near 365 °C. The root surface and tip cooled faster than the core, and the three cooling curves gradually converged as the oil stage ended. The resulting stress history at the root surface reversed sign: early surface contraction produced tension, and later cooling of the interior produced compression. The core behaved in the opposite sequence.
| Region | Transient extrema | Stable residual stress at about 100 s |
|---|---|---|
| Root surface | +335 MPa tension; −413 MPa compression | −78 to −239 MPa, compression |
| Core | −408 MPa compression; +430 MPa tension | +192 to +269 MPa, tension |
This is the familiar “surface compression, core tension” quench pattern, but the transient reversal is technically important. A crack front that samples both the surface layer and the core does not see a single residual stress value. It sees a through-thickness gradient whose sign changes with position and time.
Stress Intensity Factors With and Without Residual Stress
The stress intensity factor quantifies the amplitude of the r−1/2 crack-tip stress field. Mode I is opening, mode II is in-plane sliding, and mode III is out-of-plane tearing. For the numerical fracture model, a 0.2 mm initial crack was introduced at the mid-root. The crack-tip mesh used 20-node brick elements with collapsed edges and quarter-point midside nodes to reproduce the r−1/2 singularity. Stress intensity factors were extracted by contour integral, and the stabilized quench field was imported as an initial stress state.
Table 3 compares the crack-front values under load case 3 with and without the quench field. The units are those used in the model, MPa·mm1/2; for conversion, 1 MPa·mm1/2 = 0.0316 MPa·m1/2.
| Quantity, load case 3, a = 0.2 mm | Without residual stress | With residual stress |
|---|---|---|
| KI maximum | 1598 | 1679 |
| KI minimum | 91.96 | 179.2 |
| KII maximum | 148.7 | 133.0 |
| KII minimum | −180.8 | −153.4 |
The residual field raised the peak KI by 81 MPa·mm1/2 and raised the minimum KI by 87.24 MPa·mm1/2. The KI distribution along the front was arch-shaped: maximum near the middle of the root, lower toward both ends, and lower at the small end than at the large end. The KII magnitude remained less than about 10% of the peak KI, so opening-mode loading dominated. A mode-I-based growth criterion is therefore a reasonable first approximation, although the mixed-mode contribution at the ends should not be discarded in detailed life prediction.
The crack front crosses a non-uniform residual field. Where the local field is compressive, crack closure tends to reduce the driving force; where it is tensile, the driving force increases. This explains why residual stress can both promote and inhibit growth along the same crack front. The net effect in the present case is an increase in peak KI, consistent with the tensile contribution from the core region.
Load and Crack-Length Effects
Across the four load cases, the maximum KI remained at the mid-root and increased with load. The shape of the crack-front distribution did not change: it stayed high in the middle and lower at both ends. Residual stress shifted the magnitude upward but did not alter the fundamental trend. In the residual-stress load sweep, the large-end node reached a peak KI of 768.4 MPa·mm1/2, while the small-end node reached 179.2 MPa·mm1/2; the large-end value was 4.29 times the small-end value. The middle node showed the highest KI and therefore the fastest local crack advance under a given growth criterion.
Crack length was varied from 0.2 mm to 0.4 mm, 0.6 mm, and 0.8 mm under load case 4. The peak KI increased with crack length, and the arch-shaped front distribution persisted. The middle and large-end nodes varied almost linearly with crack length. The small-end node first increased and then decreased, a non-monotonic response linked to the changing load share along the face width. With residual stress, the small-end peak KI reached 1.92 times the no-residual value. This supports the interpretation that tensile residual stress in the gear matrix promotes crack growth, while the depth-direction growth remains stable over the range examined.
The load distribution along the face width is not uniform; the large end carries more load and has a thicker tooth section. The crack grew faster near the large end in the depth direction than near the small end, but the larger ligament at the large end provides a reserve against complete section fracture. The analysis interprets this trade-off as a potential delay in final fracture and a possible fatigue-life benefit, rather than a guarantee of longer life for every load history.
Design Implications and Model Limits
Three technical points follow from the coupled thermal-mechanical and fracture-mechanics results.
- The mid-root is the critical initiation site for this geometry and load position. A life assessment that uses only the applied tooth load and omits the quench field underestimates the minimum KI by nearly a factor of two at a = 0.2 mm under load case 3, and underestimates the peak by about 5%.
- Mode I dominates the crack front. Opening-mode stress intensity is therefore the primary driving parameter, but the sign and magnitude of the local residual field determine whether a particular point on the front is retarded or accelerated.
- Quench design should be judged by the through-thickness residual profile, not only by the surface value. A compressive root surface is beneficial only if the crack front does not simultaneously sample a strongly tensile core that raises the peak driving force.
The absolute values are model predictions for a specific 20CrMnTi gear geometry, quench schedule, and set of tooth loads. They are not a substitute for experimental crack-growth data under controlled residual fields. The more transferable result is the trend: residual stress changes the magnitude and local mixed-mode balance of the crack driving force, but it does not change the basic mode-I, mid-root initiation pattern of this spiral bevel gear.