
In the field of high-performance gear transmission systems, the helical gear is widely utilized due to its superior load-carrying capacity, smooth engagement, and low noise characteristics. The dynamic performance of a helical gear pair is critically dependent on the time-varying meshing stiffness (TVMS). However, during the manufacturing process, quenching heat treatment introduces significant residual stresses within the gear material. These stresses modify the material’s local stiffness properties and the contact mechanics, thereby influencing the TVMS and subsequent dynamic behavior of the transmission system. This study aims to quantify the effect of quenching residual stress on the TVMS and dynamic response of a helical gear pair using finite element simulations and a lumped-parameter dynamic model.
Our methodology is established on a multi-physics framework. First, a direct thermo-mechanical coupling simulation is employed to predict the quenching residual stress distribution in the helical gear blank. Second, this residual stress field is mapped into a gear meshing model as a pre-stress condition. The TVMS is then calculated using a single-node method, which precisely evaluates the stiffness at each contact node based on the pre-stressed state. Finally, a 10-degree-of-freedom (DOF) lumped-parameter dynamic model is developed to analyze the system’s vibration response, including the dynamic load in time and frequency domains. The fourth-order Runge-Kutta method is used for numerical integration. Our results reveal a clear pattern: residual stress increases the peak values of TVMS and dynamic loads, and significantly amplifies the vibration amplitude at the meshing frequency and its harmonics.
1. Theoretical Foundation for Stiffness and Stress Calculation
1.1 Finite Element Formulation for Quenching Residual Stress
The quenching process is a coupled thermal-structural problem. The residual stress is induced by the thermal gradient and phase transformation. The finite element equilibrium equation for the stress field is derived from the principle of virtual work. The total incremental strain consists of elastic, plastic, and thermal components. The governing equation for the incremental stress can be expressed as follows:
$$ \int_{V} \mathbf{B}^T \Delta \sigma \, dV = \Delta \mathbf{P} $$
Where B is the strain-displacement matrix. The incremental stress-strain relationship, considering temperature dependence, is written as:
$$ \Delta \sigma = \mathbf{D}_T \Delta \varepsilon – \mathbf{h} \Delta T $$
Here, DT is the temperature-dependent elastic-plastic matrix, and h is the thermal stress vector. Substituting the total strain increment leads to the final equilibrium equation used for the thermal-stress analysis:
$$ \int_{V} \mathbf{B}^T \mathbf{D}_T \mathbf{B} \, dV \Delta u = \Delta \mathbf{P} + \int_{V} \mathbf{B}^T \mathbf{h} \Delta T \, dV $$
The parameters involved in the thermal-mechanical finite element analysis are summarized in Table 1.
| Parameter | Symbol | Description |
|---|---|---|
| Strain-displacement matrix | B | Converts nodal displacement to elemental strain |
| Elastic-plastic matrix | DT | Temperature-dependent material matrix |
| Thermal stress vector | h | Relates temperature change to stress increment |
| Total strain increment | Δε | Sum of elastic, plastic, and thermal strain increments |
| Nodal displacement increment | Δu | Unknown variable to be solved |
| Temperature increment | ΔT | Nodal temperature change from heat transfer analysis |
1.2 Time-Varying Meshing Stiffness Calculation via Single-Node Method
The single-node method is a robust approach for calculating the TVMS of a helical gear pair. For each contact node i in the meshing area, the local mesh stiffness is defined as the ratio of the normal contact force Fi to the local elastic deformation δi at that node:
$$ k_i = \frac{F_i}{\delta_i} $$
The single tooth stiffness for the driving and driven gears (kp and kg respectively) is determined by summing the contributions of all m active contact nodes:
$$ k_p = \sum_{i=1}^{m} k_i \quad \text{and} \quad k_g = \sum_{i=1}^{m} k_i $$
For a given meshing position with t pairs of teeth in contact, the combined stiffness kj for the j-th gear pair is the series connection of the two single tooth stiffnesses:
$$ k_j = \frac{k_p k_g}{k_p + k_g}, \quad 1 \le j \le t $$
Finally, the comprehensive TVMS, kt, is the sum of the transverse tooth pair stiffnesses:
$$ k_t = \sum_{j=1}^{t} k_j $$
2. Numerical Modeling and System Parameters
2.1 Helical Gear Geometry and Material Properties
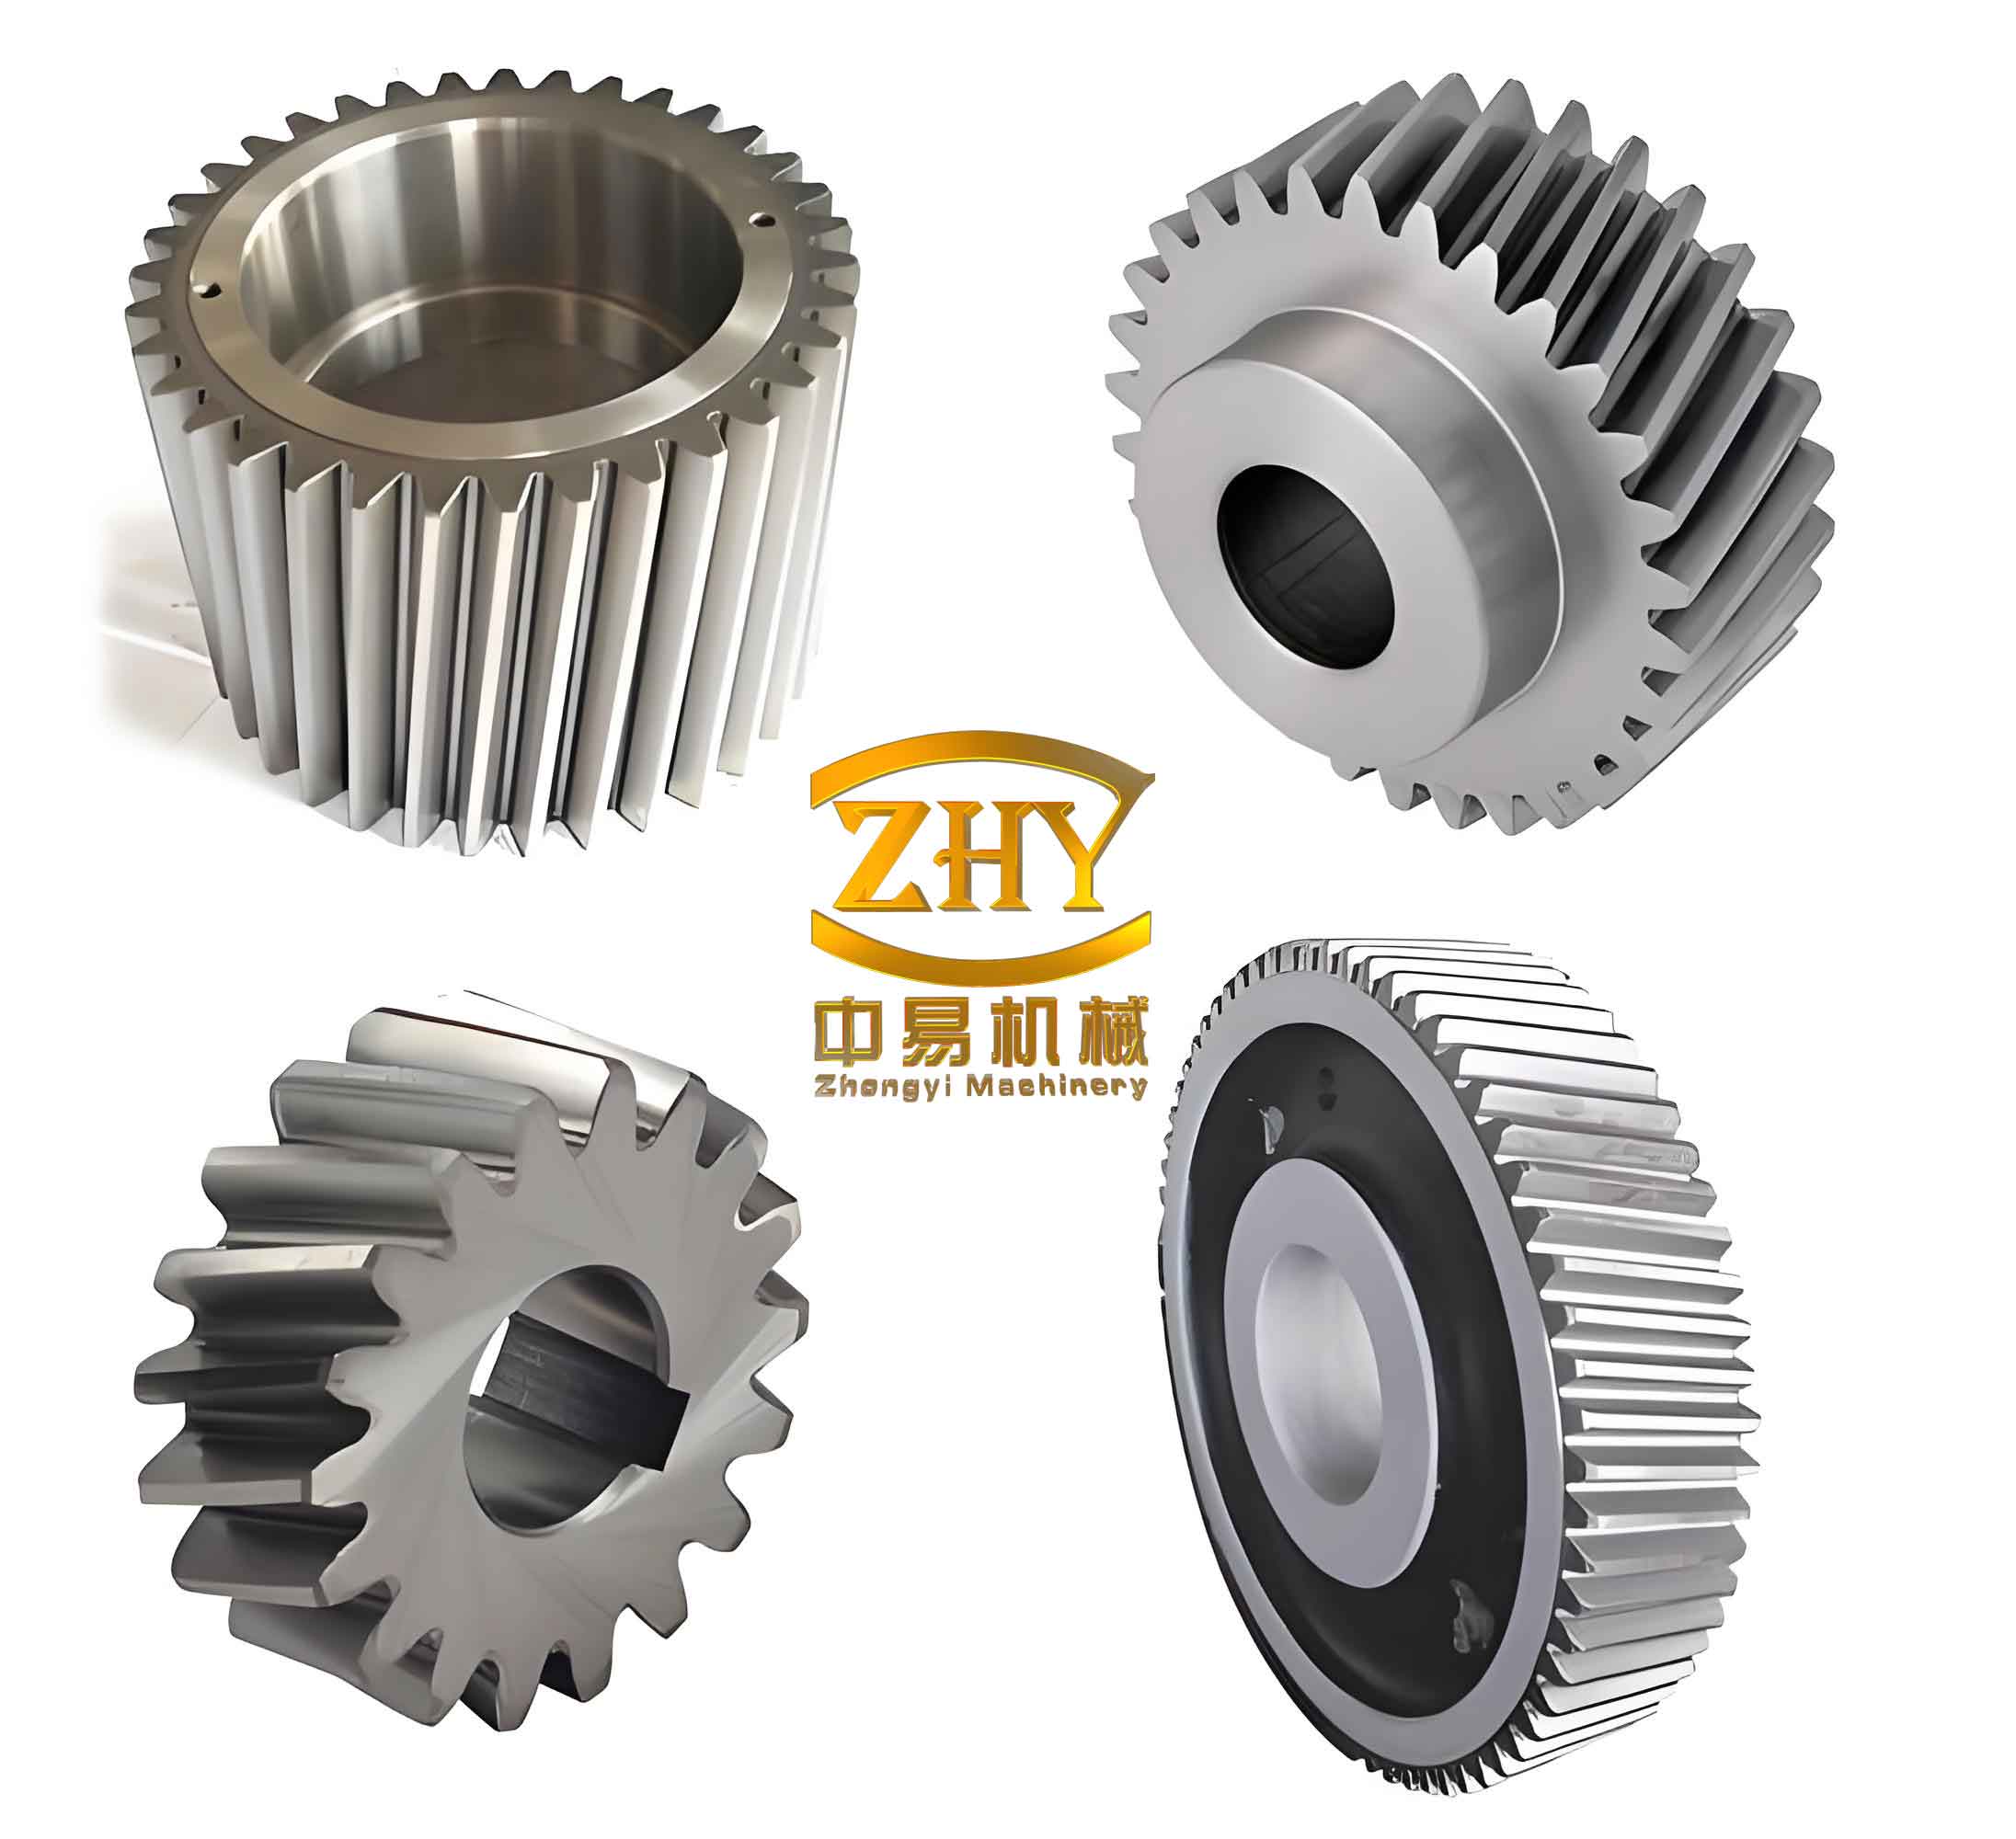
The investigated system is a pair of helical gears made from 20CrMnTi low-carbon alloy steel. The geometric parameters of the helical gear pair are listed in Table 2. The modeled contact ratio of 4.2 indicates that the transmission alternates between 4-tooth and 5-tooth meshing zones.
| Parameter | Driving Gear (Pinion) | Driven Gear |
|---|---|---|
| Number of teeth | 41 | 145 |
| Normal module (mm) | 2 | 2 |
| Normal pressure angle (°) | 20 | 20 |
| Helix angle (°) | 21.56 | 21.56 |
| Helix direction | Left | Right |
| Addendum modification coefficient (mm) | 0.345 | -0.345 |
| Face width (mm) | 50 | 45 |
| Center distance (mm) | 200 | 200 |
2.2 Quenching Simulation Setup
The quenching simulation was performed using a 3D finite element model of the helical gear. The initial temperature was set to 850°C. The gear was then subjected to a martempering (hot oil quenching) process, cooled to 80°C in a quenching medium, and subsequently air-cooled to 25°C. All external surfaces of the helical gear were defined as heat exchange surfaces. The material properties of the steel, including thermal conductivity, specific heat, and thermal expansion coefficient, were defined as functions of temperature.
2.3 Dynamic Model Formulation
A 10-DOF lumped-parameter dynamic model was established to analyze the vibration response. The model considers three translational displacements (x, y, z) for both the driving and driven gears, two rotational displacements (θz, θy) for each, plus the relative displacement along the line of action. The system equation is expressed as:
$$
\begin{aligned}
m_1 \ddot{x}_1 + c_{1x} \dot{x}_1 + k_{1x} x_1 &= -F_x \\
m_1 \ddot{y}_1 + c_{1y} \dot{y}_1 + k_{1y} y_1 &= -F_y \\
m_1 \ddot{z}_1 + c_{1z} \dot{z}_1 + k_{1z} z_1 &= -F_z \\
J_{1z} \ddot{\theta}_{1z} + F_z &= T_1 \\
J_{1y} \ddot{\theta}_{1y} + c_{1y\theta} \dot{\theta}_1 + k_{1y\theta} \theta_1 &= F_z R_1 \\
m_2 \ddot{x}_2 + c_{2x} \dot{x}_2 + k_{2x} x_2 &= F_x \\
m_2 \ddot{y}_2 + c_{2y} \dot{y}_2 + k_{2y} y_2 &= F_y \\
m_2 \ddot{z}_2 + c_{2z} \dot{z}_2 + k_{2z} z_2 &= F_z \\
J_{2z} \ddot{\theta}_{2z} + F_z &= T_2 \\
J_{2y} \ddot{\theta}_{2y} + c_{2y\theta} \dot{\theta}_2 + k_{2y\theta} \theta_2 &= F_z R_2 \\
k_t u_f + c_m \dot{u}_f &= F_f
\end{aligned}
$$
Here, subscript 1 refers to the driving helical gear and 2 to the driven helical gear. The key dynamic parameters for the model are summarized in Table 3.
| Parameter | Driving Gear | Driven Gear |
|---|---|---|
| Mass (kg) | 2.74 | 11.15 |
| Rotational inertia (kg·m²) | 0.0028 | 0.14 |
| X-direction support stiffness (N/m) | 2.3 × 10⁸ | 3.7 × 10⁸ |
| Y-direction support stiffness (N/m) | 2.3 × 10⁸ | 3.7 × 10⁸ |
| Z-direction support stiffness (N/m) | 1.5 × 10⁸ | 2.0 × 10⁸ |
| Rotational stiffness (N/m) | 1.5 × 10⁶ | 2.0 × 10⁶ |
| Equivalent damping (N·s/m) | 1.5 × 10³ | 5.91 × 10³ |
| Power (kW) | 1500 | – |
| Speed (r/min) | 20900 | 5917 |
The meshing damping cm is approximated by the following formula, using a damping ratio ξ of 0.07:
$$ c_m = 2 \xi \sqrt{k_t / (1/m_1 + 1/m_2)} $$
3. Results and Discussion
3.1 Residual Stress Distribution in the Helical Gear
The numerical simulation of the quenching process reveals a distinct residual stress pattern in the helical gear. After cooling, the gear surface is characterized by high compressive residual stresses, while the gear core exhibits tensile residual stresses. This is primarily due to the volume expansion associated with the martensitic phase transformation. The maximum principal stress values (S11, S22, S33) at different locations of the helical gear are presented in Table 4.
| Location | S11 (MPa) | S22 (MPa) | S33 (MPa) |
|---|---|---|---|
| Surface center (A1) | -320 | -280 | -350 |
| Surface tip (A2) | -290 | -260 | -310 |
| Core (B) | 150 | 120 | 180 |
3.2 Impact on Tooth Deformation and Contact
The presence of residual stress modifies the bending and contact behavior of the helical gear teeth. Our analysis shows that the bending deformation increases in the 4-tooth meshing zone but decreases in the 5-tooth meshing zone when residual stress is considered. The contact deformation, however, shows minimal variation. These deformation changes directly affect the calculated TVMS.
Table 5 summarizes the peak bending and contact deformations for the helical gear pair under both conditions.
| Condition | 4-Tooth Zone Bending (µm) | 5-Tooth Zone Bending (µm) | Contact Deformation (µm) |
|---|---|---|---|
| Without residual stress | 1.52 | 1.10 | 0.45 |
| With residual stress | 1.60 | 1.04 | 0.46 |
| Percentage change | +5.3% | -5.5% | +2.2% |
3.3 Influence on Time-Varying Meshing Stiffness (TVMS)
The TVMS of the helical gear pair is significantly influenced by the residual stress. The mean stiffness and the peak stiffness values are both higher when residual stress is considered. The relative error of our average TVMS calculation against the ISO 6336 standard is 2.7%, validating the model’s accuracy. A comparative analysis of the TVMS results is shown in Table 6.
| Condition | Mean Stiffness (×10⁵ N/mm) | Peak Stiffness (×10⁵ N/mm) | Min Stiffness (×10⁵ N/mm) |
|---|---|---|---|
| ISO Standard value | 6.220 | – | – |
| Without residual stress | 6.051 | 7.34 | 4.87 |
| With residual stress | 6.065 | 7.58 | 4.92 |
| Percentage change | +0.23% | +3.27% | +1.03% |
The data indicates that the primary effect of residual stress is to increase the peak stiffness in the 5-tooth meshing region, while also introducing more fluctuation in the 4-tooth regions.
3.4 Dynamic Load Response in Time and Frequency Domains
The dynamic load of the helical gear pair was evaluated in the time domain. The results, presented in Table 7, show that residual stress leads to a substantial increase in the peak dynamic meshing force. The fluctuation range of the dynamic load is expanded, indicating a harsher dynamic environment for the helical gear system. The peak-to-peak amplitude of the normal dynamic load increased by over 61%.
| Parameter | Without Residual Stress | With Residual Stress | Change |
|---|---|---|---|
| Mean tangential meshing force (N) | 16731.99 | 16735.80 | +3.81 N |
| Peak normal meshing force (N) | 21749.2 | 23592.4 | +1843.2 N (+8.47%) |
| Normal force amplitude variation (N) | 4684 | 7566.4 | +2882.4 N (+61.5%) |
In the frequency domain, the residual stress primarily amplifies the vibration at the meshing frequency (fm = 14,281 Hz) and its sidebands. Table 8 summarizes the amplitude spectral density (ASD) at the first two harmonics of the meshing frequency for the normal dynamic load.
| Frequency Component | Without Residual Stress (N) | With Residual Stress (N) | Percentage Change |
|---|---|---|---|
| 1× Meshing frequency (fm) | 145.3 | 188.6 | +29.80% |
| 2× Meshing frequency (2fm) | 72.4 | 60.8 | -16.03% |
4. Conclusions
This study systematically investigated the effect of quenching residual stress on the time-varying meshing stiffness and dynamic performance of a helical gear pair. Based on a detailed finite element analysis and a lumped-parameter dynamic model, the following conclusions can be drawn:
1. The quenching process in a helical gear induces a characteristic “external compression, internal tension” residual stress field, which is primarily a consequence of the martensitic phase transformation. This stress state modifies the local mechanical properties of the gear tooth.
2. The presence of residual stress alters the tooth deformation during the meshing cycle. The bending deformation of the helical gear tooth increases in the 4-tooth contact zone and decreases in the 5-tooth contact zone, while the contact deformation remains largely unaffected. This leads to a corresponding increase in the peak time-varying meshing stiffness of the helical gear pair.
3. Residual stress significantly impacts the dynamic response of the helical gear transmission. The peak-to-peak amplitude of the dynamic loads, particularly the normal meshing force, is substantially higher in the presence of residual stress. The system experiences more pronounced shock loading during the transition between meshing zones.
4. Frequency domain analysis confirms that residual stress amplifies the vibration amplitude at the fundamental meshing frequency of the helical gear pair. The amplitude spectral density at the first harmonic (1×fm) increased by approximately 30%, while the energy at the second harmonic shifted, indicating a redistribution of vibrational energy due to the altered stiffness profile.
5. The numerical model and analytical framework presented in this work provide a quantitative methodology for predicting the influence of manufacturing-induced residual stress on the operational behavior of helical gear systems. These findings highlight the importance of incorporating residual stress into the design and life-prediction models of advanced gear transmissions.